
- Background
- Goals
- Data Collection and Data Cleaning
- Feature Selection
- Modeling
- Results
- Final Thoughts
- Next Steps
- References
- Repo Structure
Chronic kidney disease (CKD) is when the kidneys are damaged and cannot correctly filter waste and excess fluids from the blood. About 37 million people in the United States have Chronic Kidney Disease (CKD). Early detection and diagnosis of CKD are essential to preventing its progression to kidney failure. Machine learning models can assist in predicting CKD. This project will use a decision tree to analyze National Center for Health Statistics (NCHS) data. Variables such as age, gender, medical history, and laboratory test results will be used. By identifying patterns in the data, models can predict a patient's risk of developing CKD, allowing for early intervention and management.
- My goal for this analysis is to predict the risk of CKD.
- Identify factors that increase the risk of CKD.
The dataset was obtained from the National Center for Health Statistics (NCHS), consisting of 34 columns and 8819 rows. The data was collected from the National Health and Nutrition Examination Surveys conducted during the years 1999 to 2000 and 2001 to 2002. The dataset comprises information from adult participants who were 20 years of age or older.
Using the pandas library in Jupyter Notebook, the data was thoroughly examined. Variable types were checked, outliers and null values were identified, and duplicates and class imbalance were checked for. Since there was a class imbalance, random undersampling was applied to the dataset with a 1:1 ratio for targets to non-targets.
- Data -- CSV File
- Processing -- Jupyter Notebook -- Pandas -- NumPy -- RandomUnderSampler
- Modeling -- Sklearn
- Data Visualization -- Matplotlib -- Seaborn
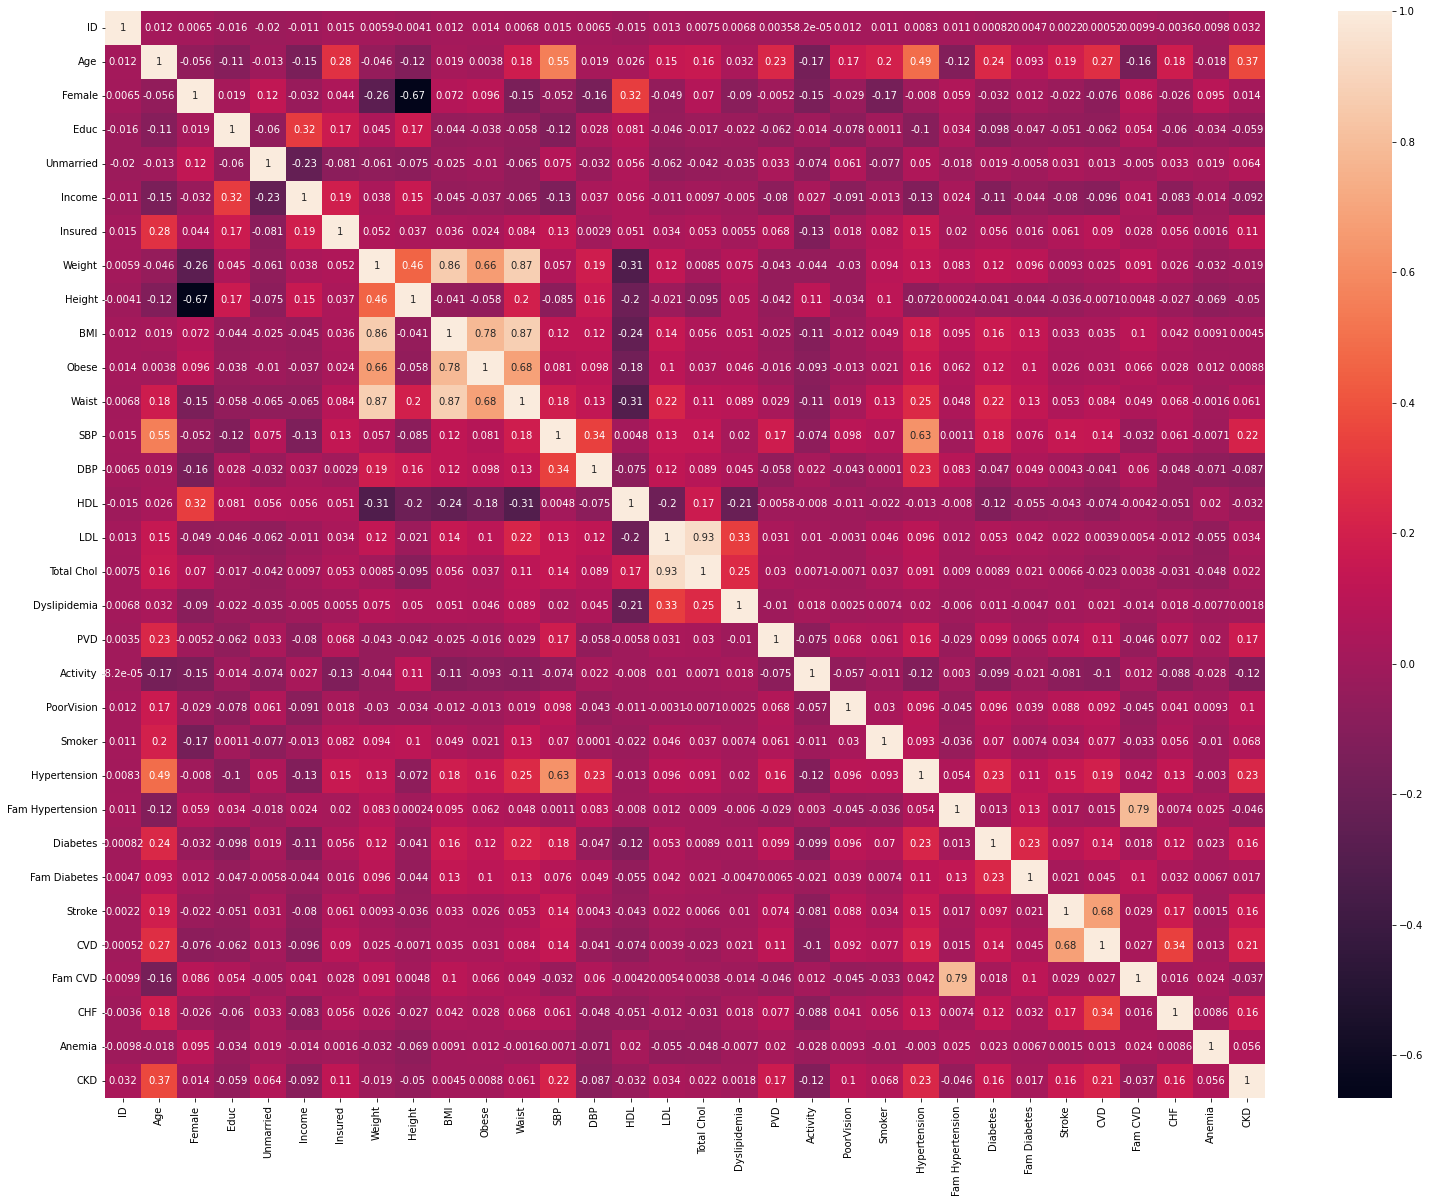
After reviewing the correlation matrix, I dropped the redundant variables like Weight and Height since we had BMI in the dataset.
The first iteration of this model was a decision tree. Hyperparameter tuning was performed for the decision tree classifier using grid search with cross-validation. The hyperparameters considered for tuning were the criterion for splitting, the maximum depth of the tree, and the minimum number of samples required to split an internal node. A dictionary was used to specify a range of values for each hyperparameter.
A decision tree classifier instance was created and hyperparameter tuning was performed using the training set. The best hyperparameters were selected based on the highest mean score across all cross-validation folds. The best hyperparameters were found to be {'criterion': 'gini', 'max_depth': 2, 'min_samples_split': 2}.
The F1 Score was score was too low for the decision tree so additional models(Random Forest and Gradient Boosting Classifier were run.
- Accuracy: 0.7033898305084746
- Precision: 0.6551724137931034
- Recall: 0.7169811320754716
- F1 Score: 0.6846846846846846
- Accuracy: 0.7711864406779662
- Precision: 0.7321428571428571
- Recall: 0.7735849056603774
- F1 Score: 0.7522935779816513
- Accuracy: 0.8050847457627118
- Precision: 0.7678571428571429
- Recall: 0.8113207547169812
- F1 Score: 0.7889908256880735
In this analysis, I implemented five distinct variations of the model, each with different sampling ratios between the target and nontarget groups. Specifically, I used the ratios 1:1, 1:2, 1:3, 1:4, and 1:5. Through evaluation, I determined that the version with a 1:1 sampling ratio yielded the most favorable F1 score. I hope to extend this analysis in the future.
- Combine this with another dataset for a more robust analysis or try machine learning algorithms like logistic regression or a neural network for the next steps.
- Build a web app using streamlit with a user interface for this model.
Kidney Disease Statistics for the United States. National Institute of Diabetes and Digestive and Kidney Diseases. U.S. Department of Health and Human Services. Available at: https://www.niddk.nih.gov/health-information/health-statistics/kidney-disease (Accessed: February 22, 2023).
├── /data (data)
├── /img (contains all images for repo)
├── Predicting-Chronic-Kidney-Disease-Resample.ipynb
└── README.md