NN_visualize
Visualizing Neural Networks with graphviz
Introduction
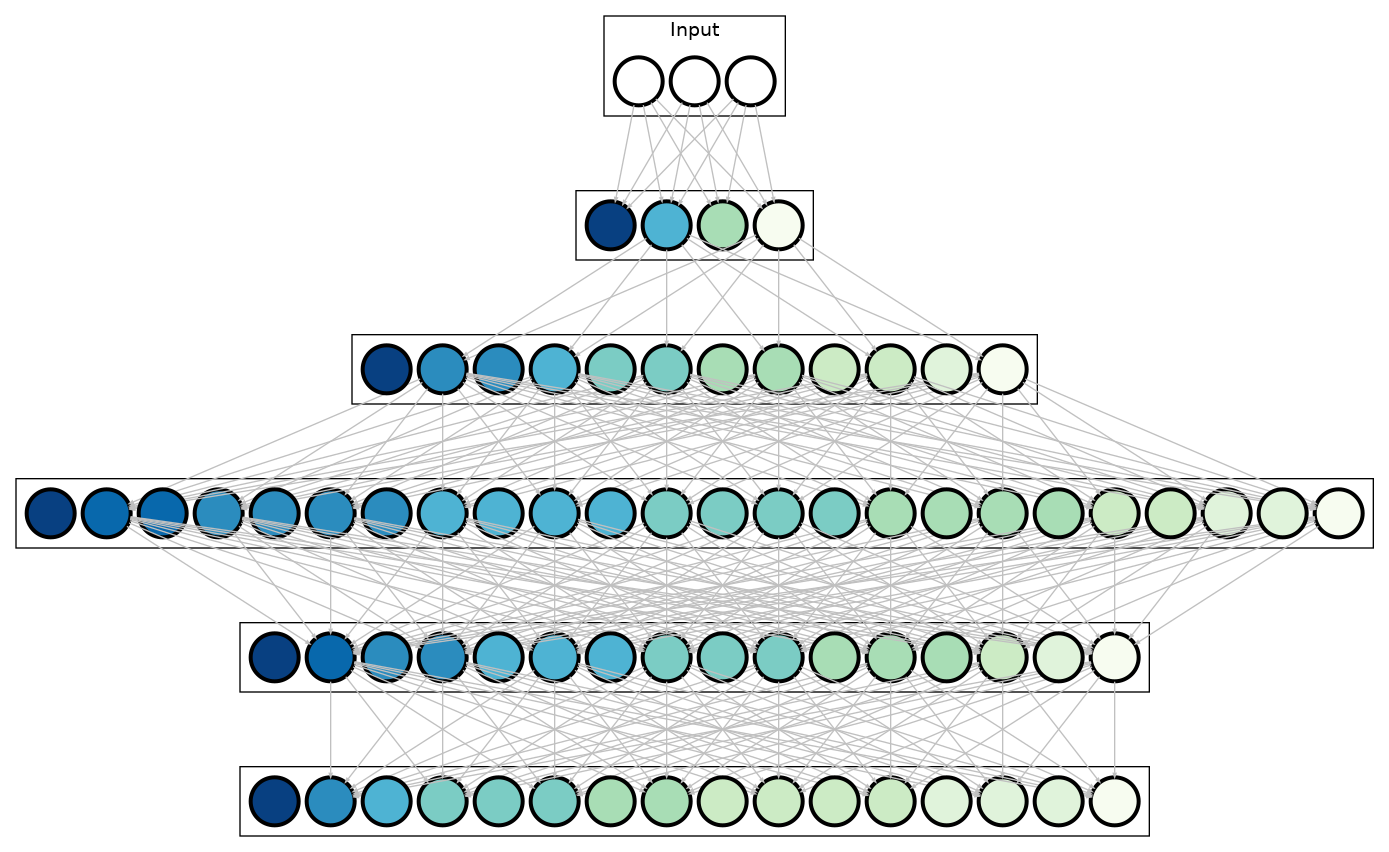
Represent NN as a graph where nodes indicate neurons. It is important that we treate each convolutional channel as one neuron, so the neural network can be visualized in a fully connected way, which is significantlt straightforward.
Here we take the convolutional backend of AlexNet as an example:
Problem is, number of channels in CNN is enormous, so we grouped neurons with fixed group cardinality (16 for AlexNet, see vis_alexnet.py for details). Color of neurons here denotes various neuron activity, given a single input image.
Quick Start
-
- Make sure graphviz is installed. For Linux users:
sudo-apt install graphiviz & pip3 install graphviz -
- Generate
.dotgraph configuration files
python vis_alexnet.py - Generate
-
- Generate output image
dot -Tpdf -o ./img/alexnet_1.pdf ./configs/alexnet_1.dot -
- We provide extra scripts for plotting neuronal activity curves in
plot_curve.py
- We provide extra scripts for plotting neuronal activity curves in
Note
- The neural network activity record in
recordsare recorded for one given image, specifically we add one global average pooling layer after each convolutional layer of AlexNet, and stored this aggregated features for each layer. Users could write scripts based onvis_alexnet.pyfor other network architecture.

