30day-chart-challenge
A repository containing several of my participation attempts in the #30DayChartChallenge in 2021 & 2022.
Check out more information about the challenge on its website, and other challenges I participated in on the data visualization section on my website.
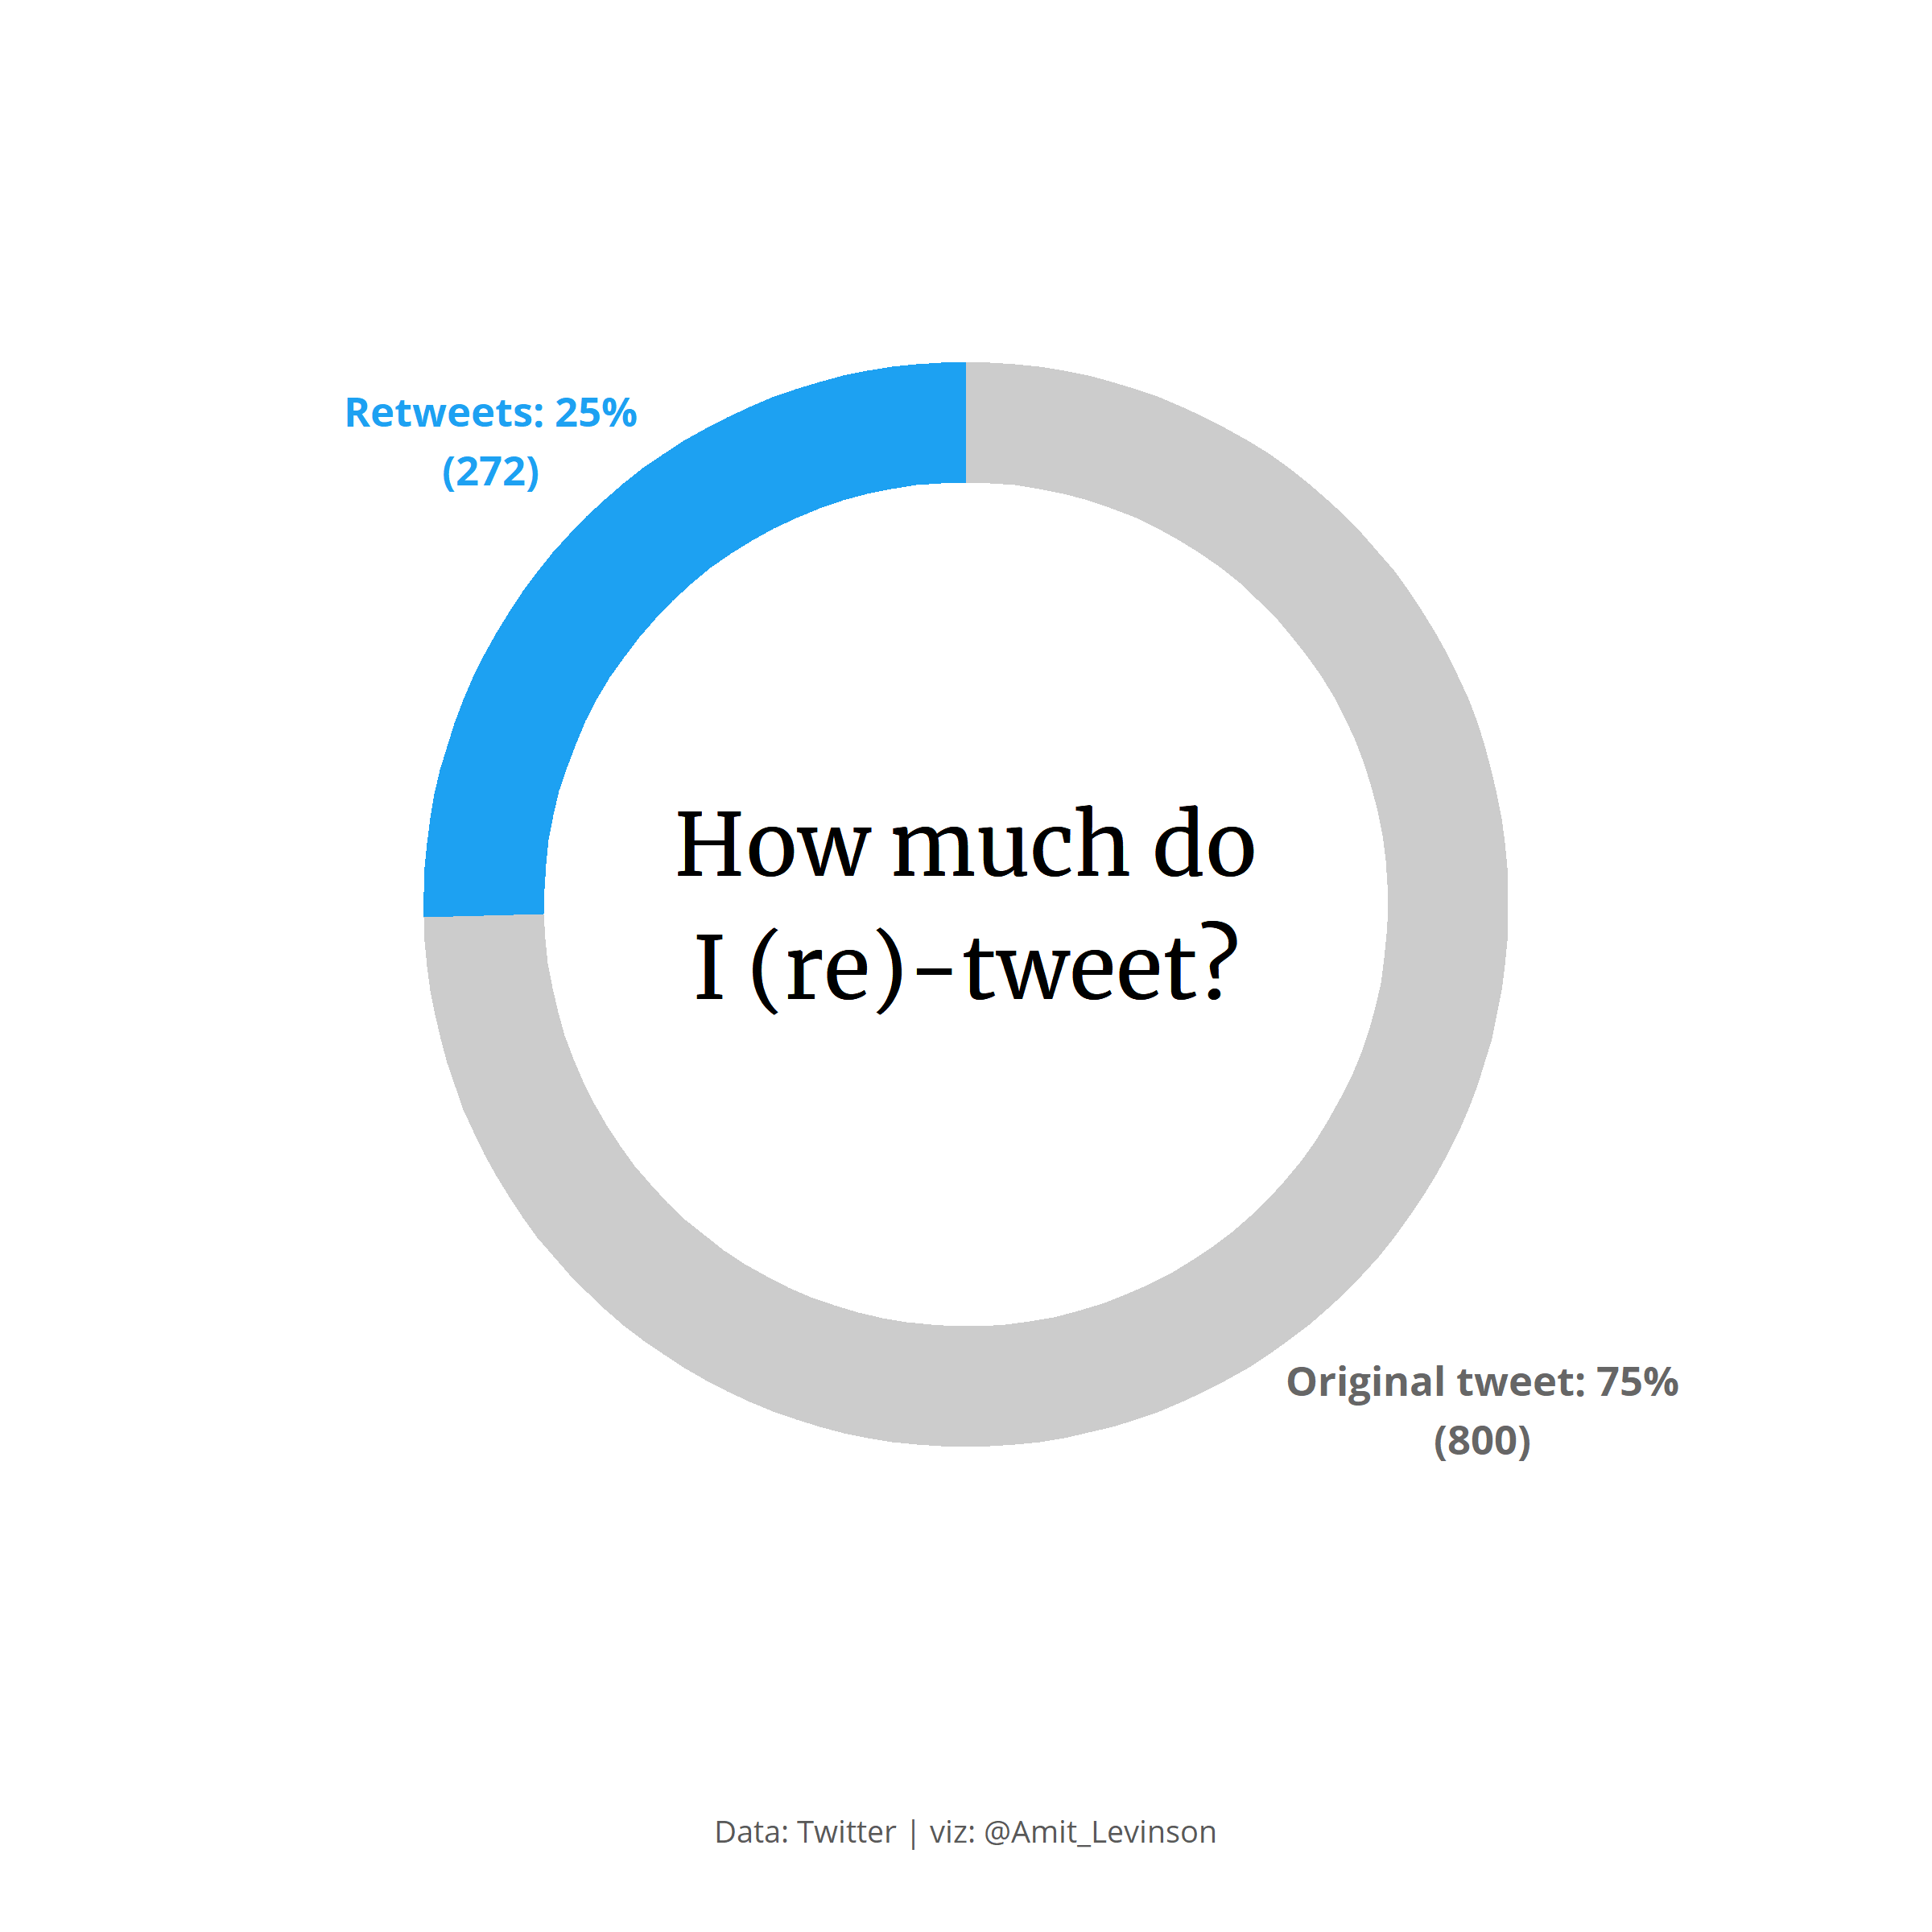
Part to whole

Pictogram

Physical
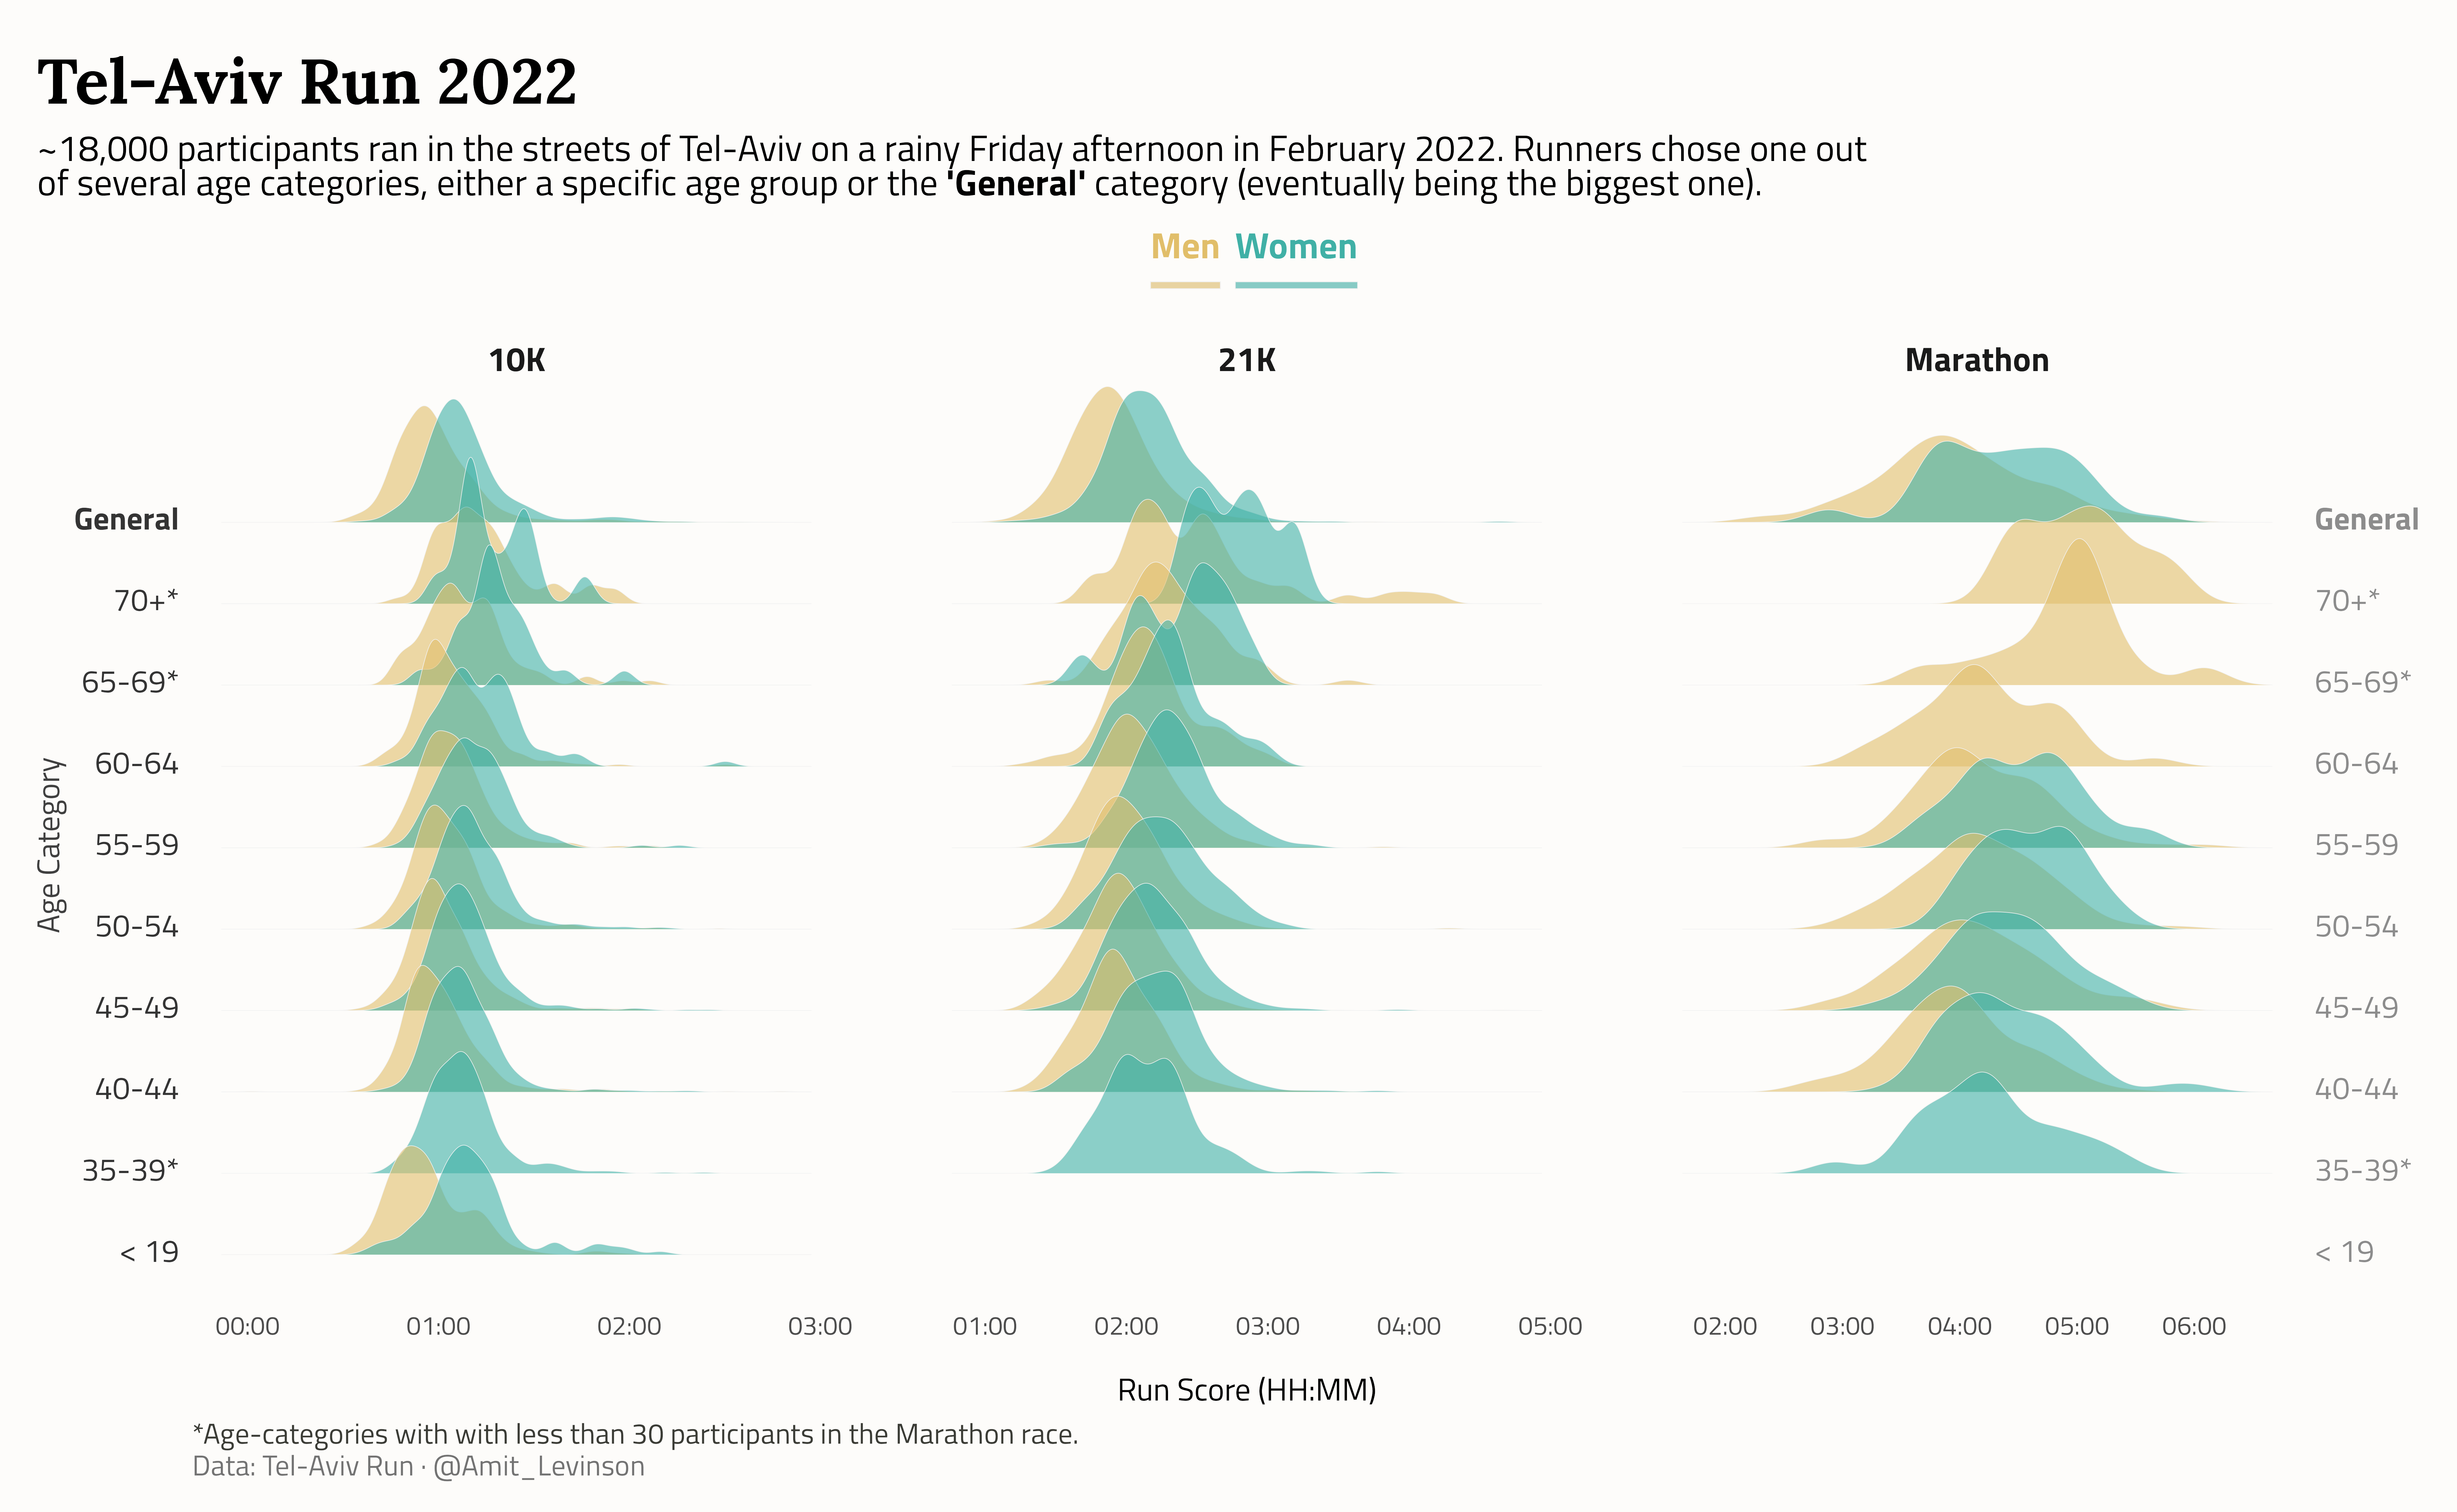
Statistics

2021
Day 20: Upwards

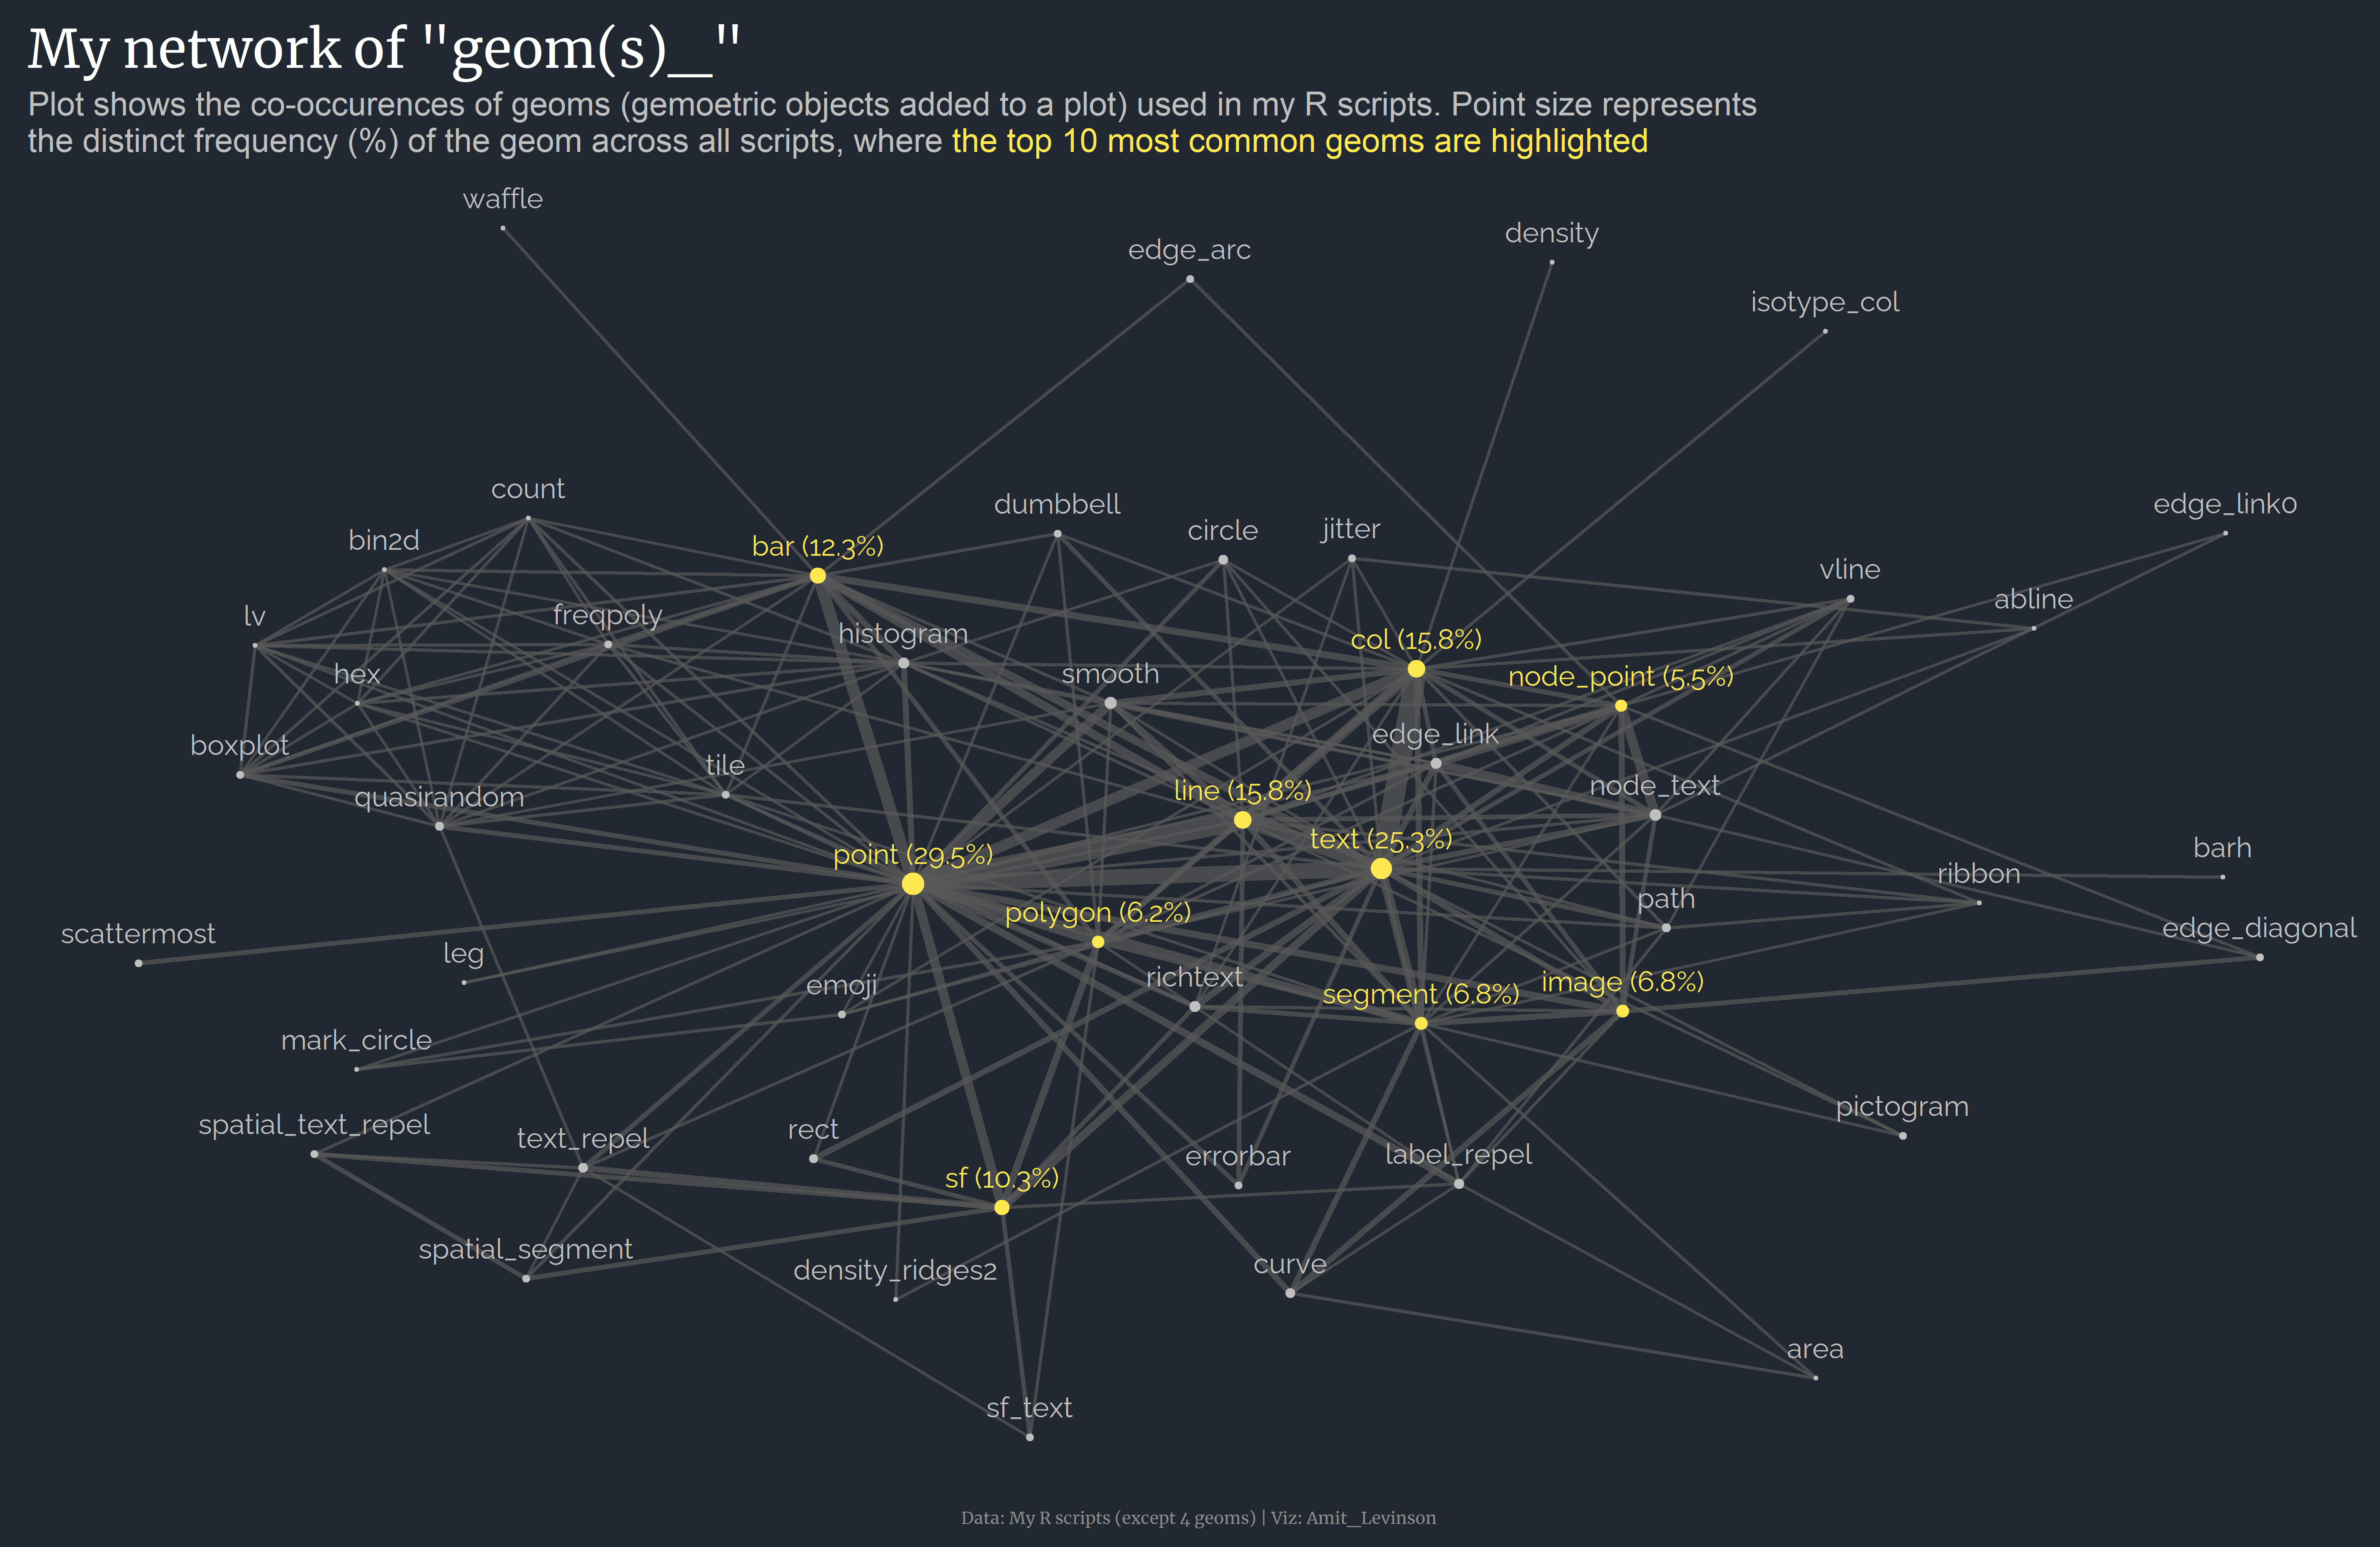
Day 18: Connections
Day 11: Circular
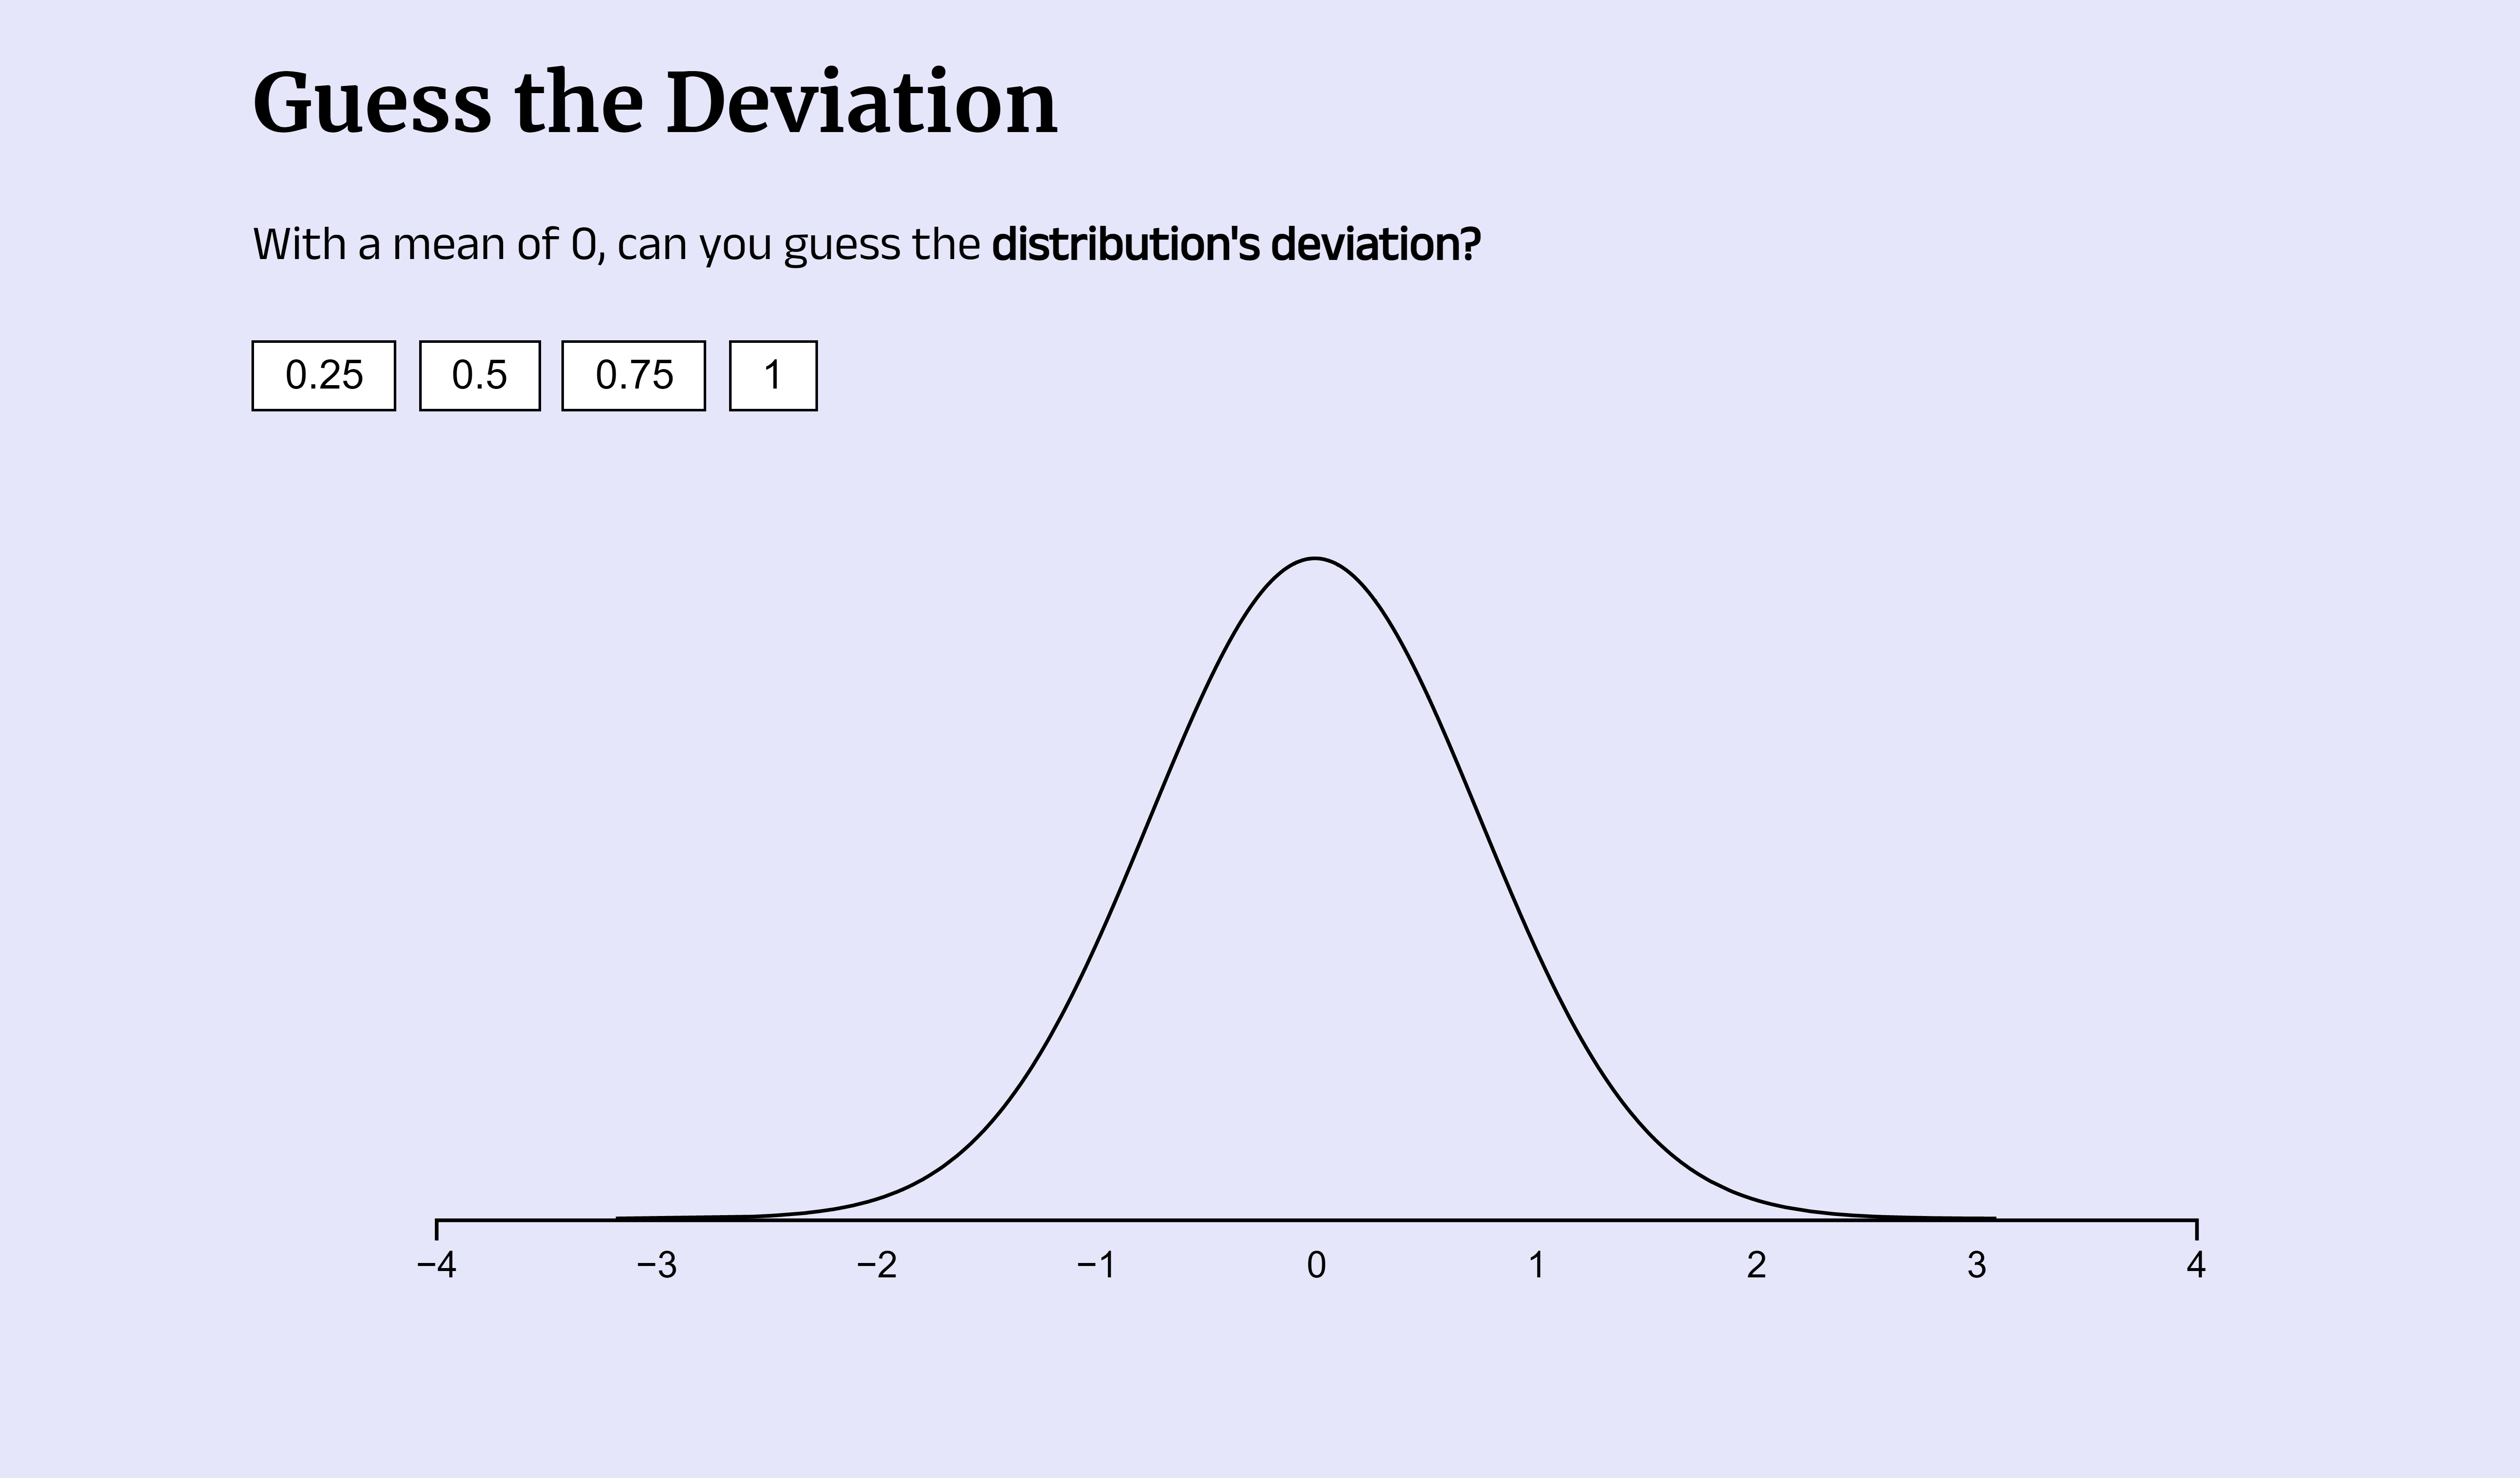
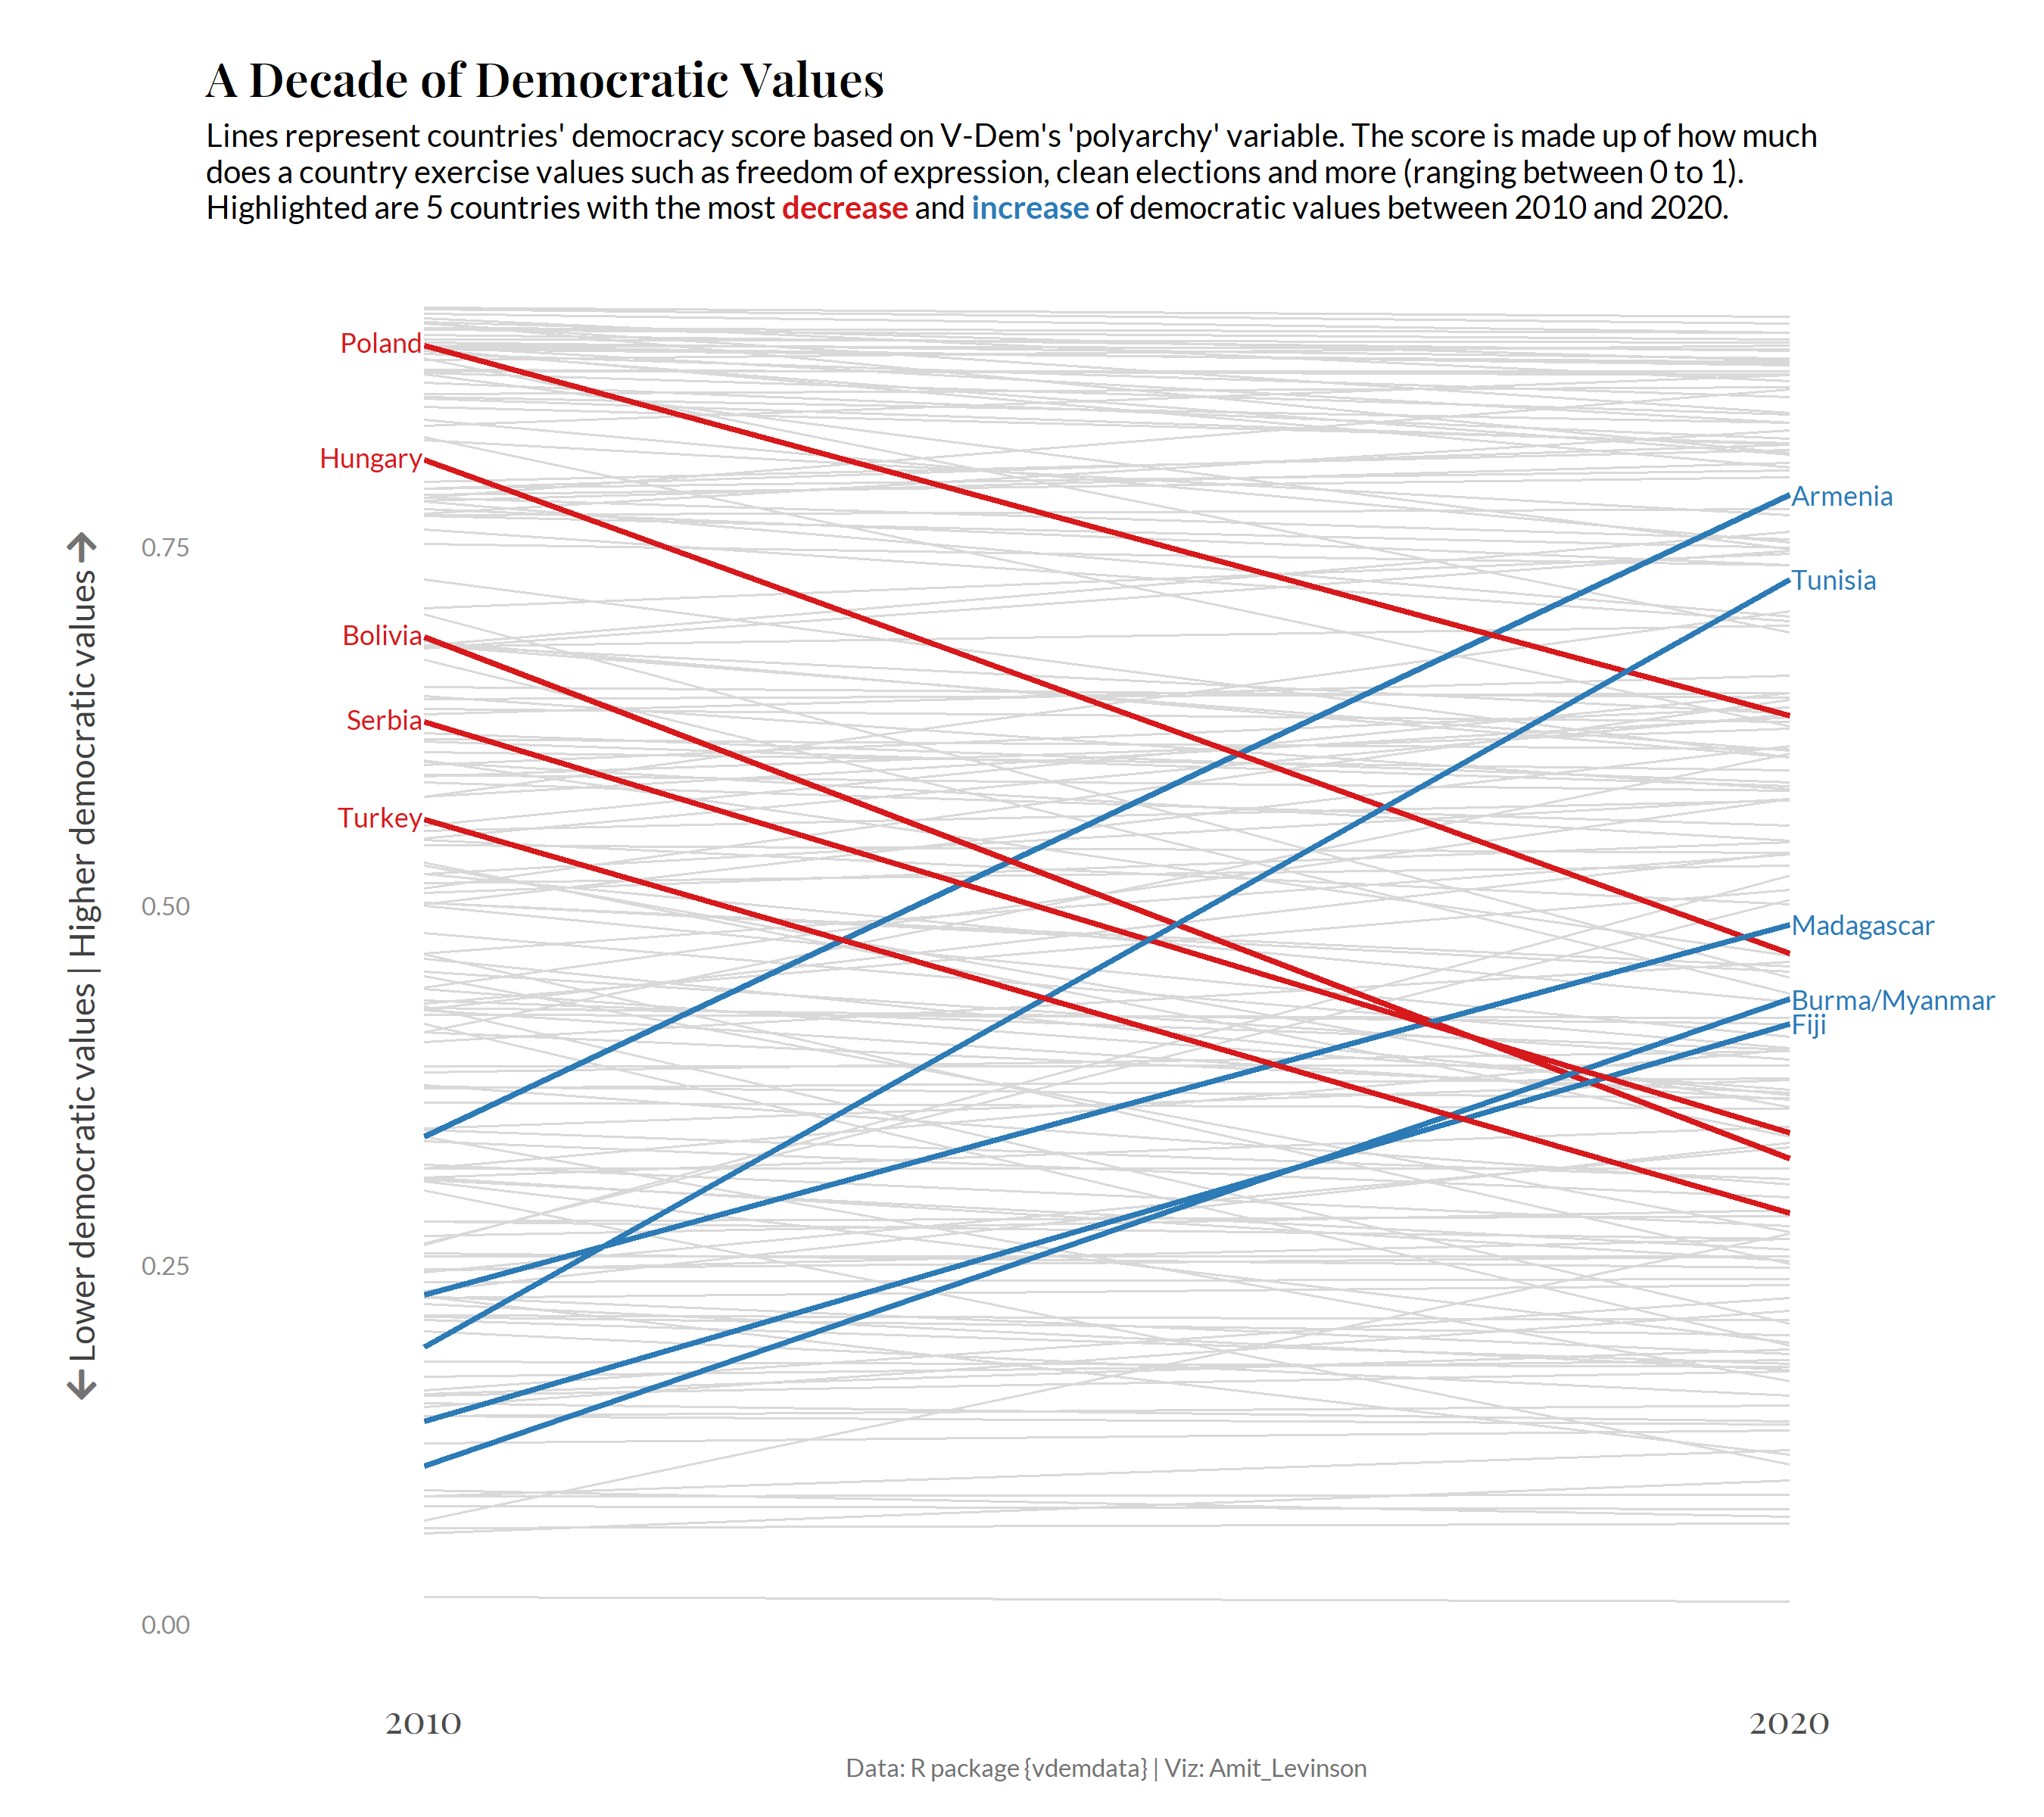
Day 9: Statistics

Day 6: Experimental

Day 5: Slope
Day 4: Magical

Day 3: Historical
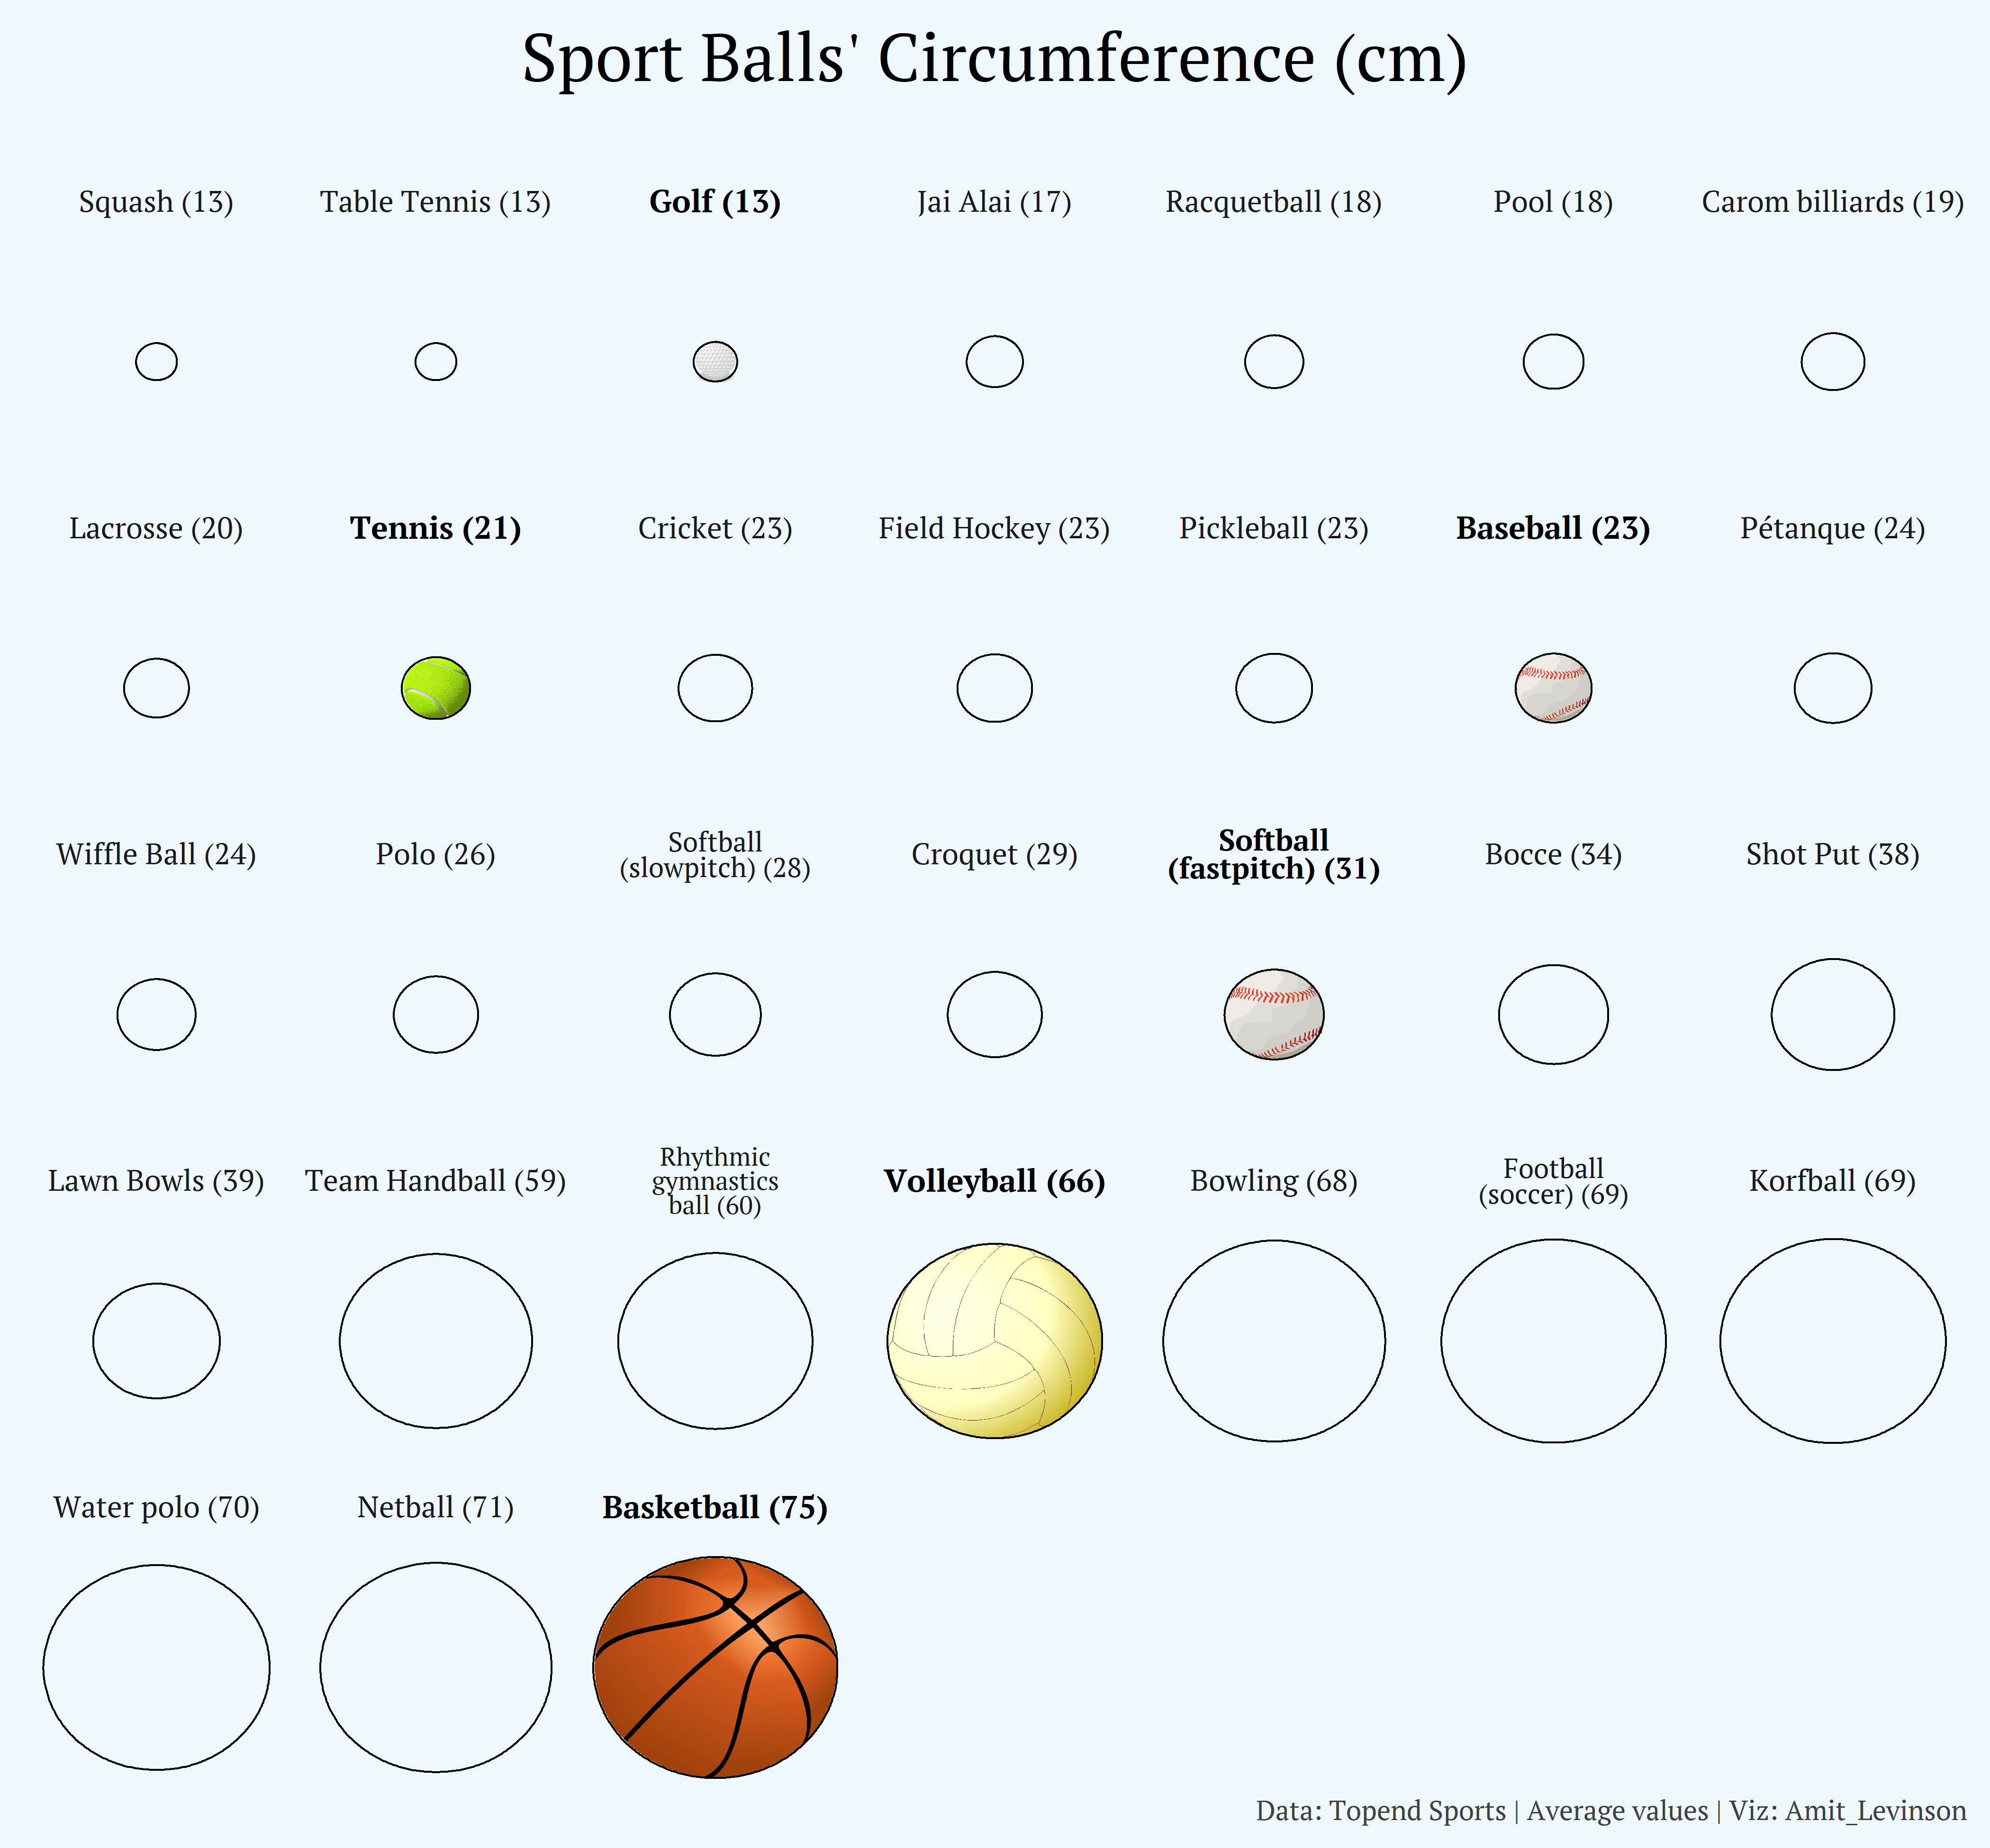
Day 2: Pictogram

Day 1: Part-To-Whole