by Alison Davey
This project is for Tinybird's first hackathon "To Infinity and beyond".
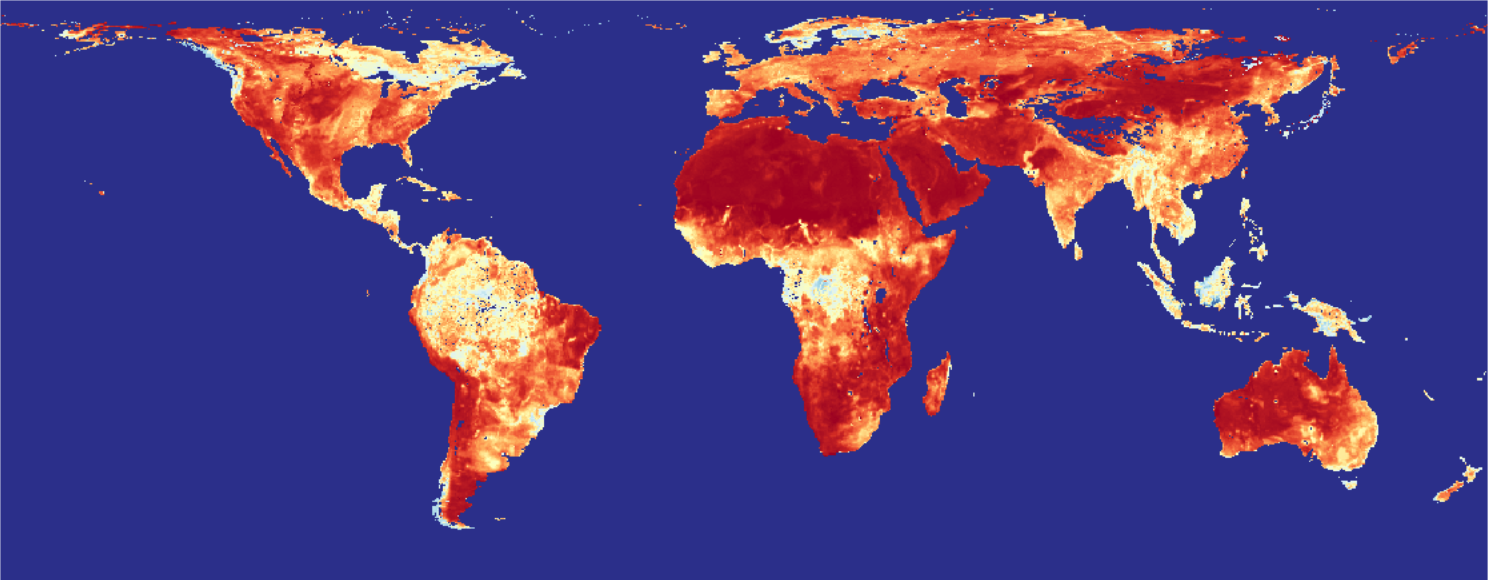
The theme is space. An important part of activity in space is observing the Earth. In this project, satellite data measuring soil moisture across the globe is shown on global maps.
The satellite data stored in Tinybird powers the HEX app.
For the selected day you see the results of the morning pass of the satellite, the afternoon pass, the two passes combined and finally a plot of several days data to fill in the blanks.
You can also select a country and city to show a more local area and a bar plot of the soil moisture numbers for that city.
NASA's Soil Moisture Active Passive (SMAP) satellite uses two microwave instruments to monitor the top 2 inches (5 centimeters) of soil on Earth's surface. Together, the instruments create soil moisture estimates with a resolution of about 6 miles (9 kilometers), mapping the entire globe every two or three days.
These plots are of the Level-3 (L3) soil moisture data, which is a composite of daily estimates of global land surface conditions. SMAP L-band soil moisture data are resampled to a global, cylindrical 36 km Equal-Area Scalable Earth Grid (406 rows x 964 columns).
The NASA National Snow and Ice Data Center Distributed Active Archive Center (NSIDC DAAC) distributes cryosphere and related geophysical data from NASA Earth-observing satellite missions, airborne campaigns, and field observations.
NASA's SMAP viewer is not currently working, so let's build our own!
O'Neill, P. E., S. Chan, E. G. Njoku, T. Jackson, R. Bindlish, and J. Chaubell. (2021). SMAP L3 Radiometer Global Daily 36 km EASE-Grid Soil Moisture, Version 8 [Data Set]. Boulder, Colorado USA. NASA National Snow and Ice Data Center Distributed Active Archive Center. https://doi.org/10.5067/OMHVSRGFX38O. Date Accessed 10-23-2022.
The table of cities is from the World Cities Database.
Go to Tinybird and create a free account, if don't already have one. Either create a new workspace or use an existing one.
workspace directory
The SQL Pipe and Data Source schema needed to build the project.
scripts directory
-
python script to download the data and send it to Tinybird. You will need to set up an Earthdata login to have your {UID} and {PASSWORD}. Use the Tinybird {TOKEN} from your workspace. Store the values in your
.envfile. -
python script of the plot commands used in the HEX app.
- Clone repository in a virtual environment
virtualenv -p python3.8 .e

. .e/bin/activate

git clone https://github.com/AlisonDavey/soil_moisture.git- Authenticate using Tinybird's CLI
pip install tinybird-clicd soil_moisture/workspacetb auth --token $TOKEN- Push project to Tinybird
tb pushDownload, preprocess and push the data to Tinybird using the script script/soil_moisture_data_to_tinybird.py. The script downloads the data file for each day from 6 October 2022 to 28 October 2022. Each file is 30 MB - 35 MB in h5 format. Selecting just the data we want and storing that in Tinybird is less than 400 KB per day. Make sure you have created your .env file with the {UID} amd {PASSWORD} for your Earthdata login and your Tinybird {TOKEN}.
cd ..
python scripts/soil_moisture_data_to_tinybird.py
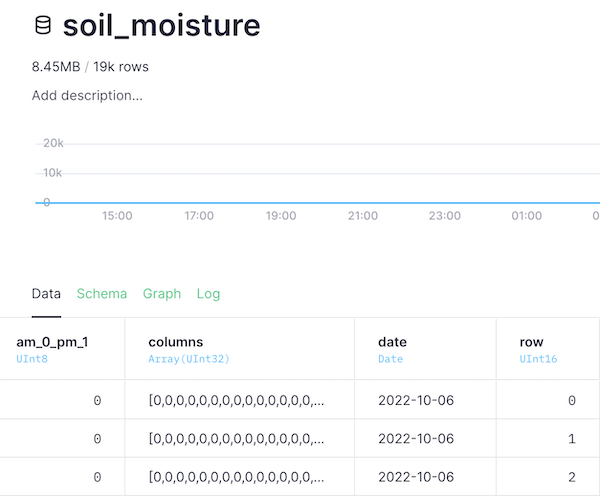
Each record is a row of data, with:
- the flag for the morning or the afternoon pass of the satellite
- an integer array of the 964 column values of soil moisture
- the date of the pass
- the row number for each of the 406 rows.
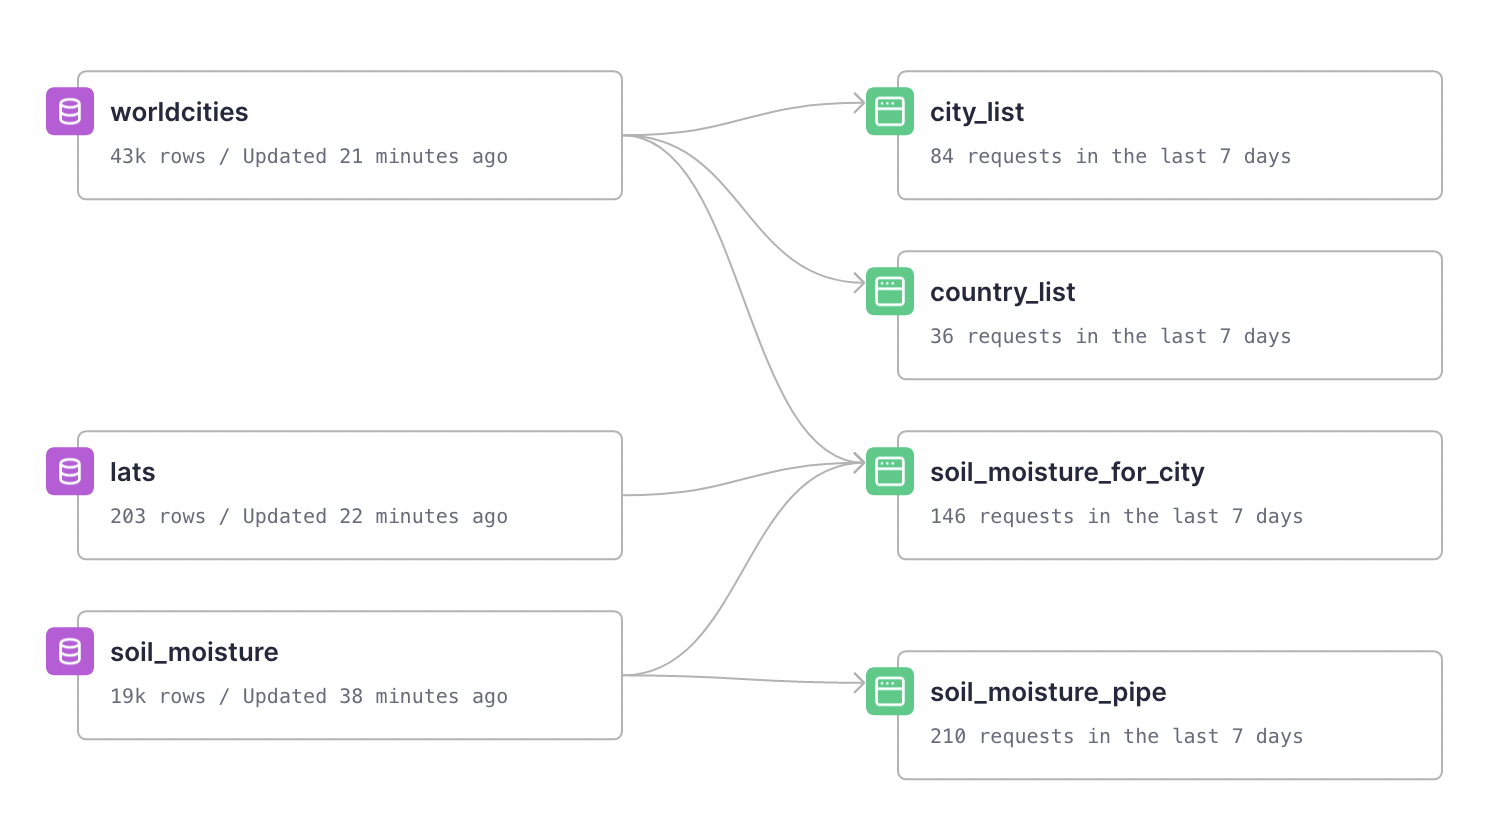
To support selecting data for more local areas the dimension tables were loaded to Tinybird from the UI by appending data to the empty tables created in step 1:
worldcitiesfrom the CSV file downloaded from https://simplemaps.com/data/world-citieslatsan approximate latitude value for each row of data. This was created from a single file of soil moisture datapd.DataFrame((pd.DataFrame(group['latitude_centroid_pm'][()])).replace(-9999.0,0).max(axis=1)[:203]).to_csv('lats.csv')
- the pipe
country_listserves a list of countries to the country dropdown in the app - the pipe
city_listserves a list of cities to the city dropdown in the app, for the selected country - the pipe
soil_moisture_for_cityreturns the time series of the soil moisture data for a single cell, close to the selected city, for the bar plot.
- Elena Torro's entry for the readme and project structure
- NASA's SMAP Documentation
- World Cities Database


