A tool for fetching and visualizing publication trends from ScienceDirect.
- Python 3.6 or higher
- Access to ScienceDirect
First, ensure Python 3.6+ is installed on your system. You can download Python from the Official Python Website.
To install SciDirectTrends:
$ pip install -U SciDirectTrendsUse -U to update SciDirectTrends to the latest version
Basic command to visualize publication trends:
$ scidirecttrends --query "your query here"Customize the visualization:
$ scidirecttrends --title "Custom Title" --query "your query here" --output "trend.png"Sample Code:
from scidirecttrends import visualization
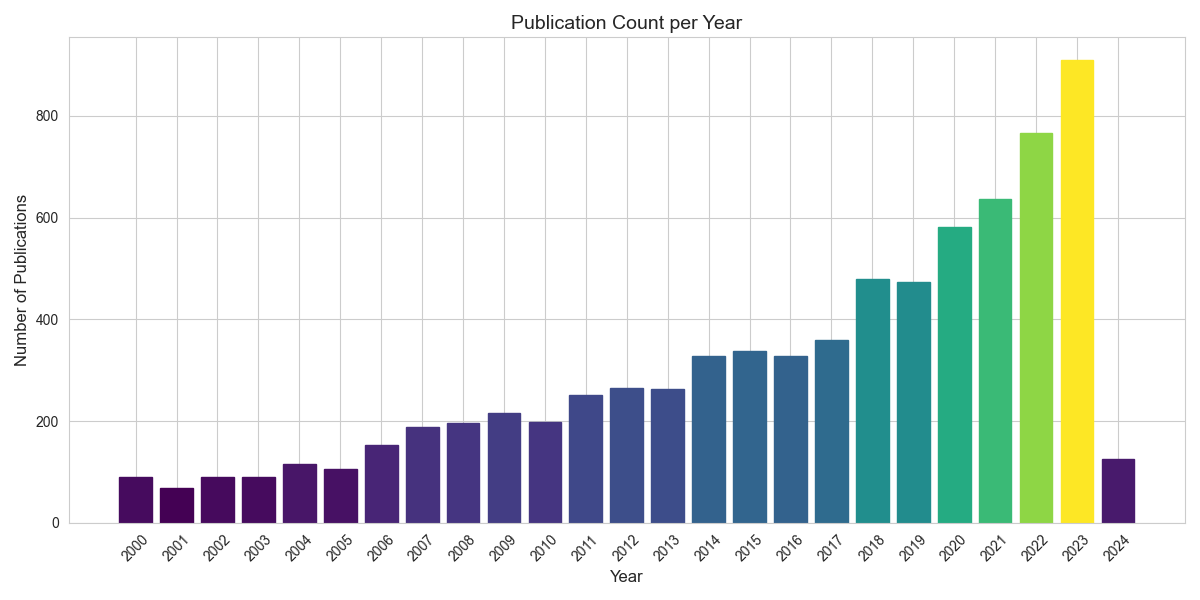
visualization.plot_publication_trends('"Robotic grasping" OR "Robotic manipulation"', 'trend.png', 'Robotic manipulation Publication Count per Year')Fetches publication data from ScienceDirect based on a user-defined query. Generates visualizations of publication trends over time. Customizable visualization titles and output formats.
Contributions to SciDirectTrends are highly appreciated. If you're interested in contributing, feel free to fork the repository, make changes, and create a pull request.
If you need help or have suggestions, please contact me:
Email: alireza.beigy.rb@gmail.com Telegram: @AliRezaBeigy
This project is licensed under the MIT License - see the LICENSE file for details.