Forecasting-Energy-Consumption-Using-Prophet
Brief Introduction
Prophet is a forecasting for time series data method developed and released by Facebook's data science team that open source for everyone. What special about this method is it can plot the trend line of the data in yearly, monthly, weekly, and even daily. Additionally, it can add holiday and custom season effect to the forecast.
The Data
In this tutorial, we use hourly electricity usage/consumption from Kentucky state in USA from June 2013 to August 2018. This data obtained from kaggle here. There are 45334 rows data that consist of timestamp and energy usage in MegaWatt. 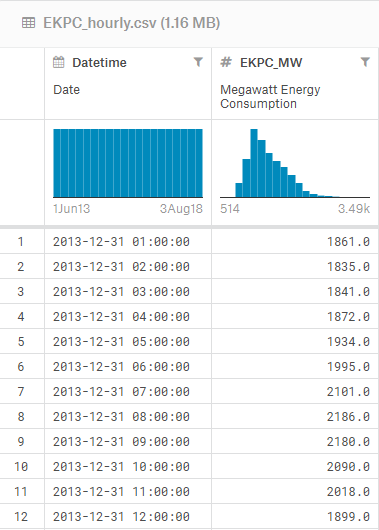
The Code
First load the data and named the column 'ds' for the timestamp/datetime and 'y' for the data in this case the electricity usage.
import pandas as pd

import numpy as np
from fbprophet import Prophet

%matplotlib inline
import matplotlib.pyplot as plt

from IPython.display import display

sample=pd.read_csv('EKPC_hourly.csv')
After that make the model and fit it with the electricity usage data.
from fbprophet.plot import add_changepoints_to_plot
m = Prophet(changepoint_prior_scale=0.01)
m.fit(sample)
Then make the forecast, specify the lenght and the type of time ('H' = hourly, 'Y' = yearly)
future = m.make_future_dataframe(periods=8760, freq='H')
fcst = m.predict(future)
Last is plot the forecast graph
fig = m.plot(fcst)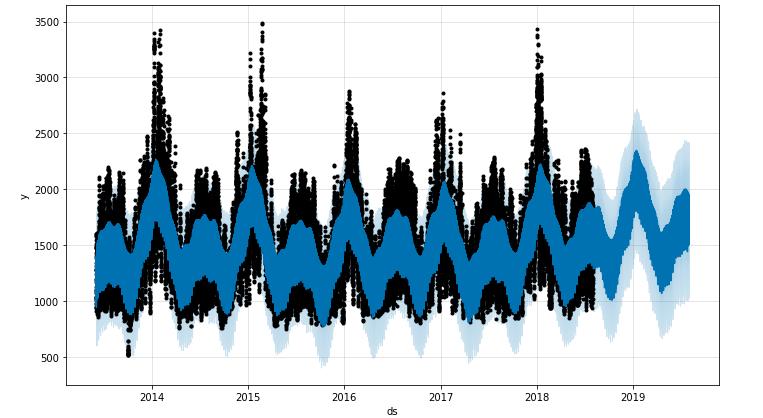
To plot the daily, monthly, and yearly graph, use this code
fig = m.plot_components(fcst)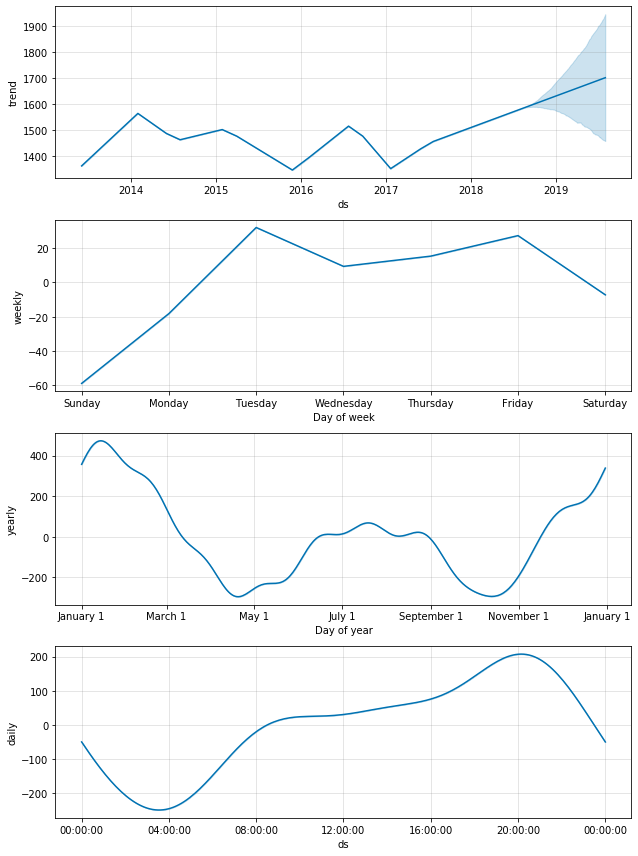
Prophet has built-in holiday date to use. In my case, add the built-in holiday effect in US to the model before fitting the model to data.
m.add_country_holidays(country_name='US')Prophet doesn't have built-in season in US like holiday, therefore we must add the season as custom season. We must specify which data is included in a season
def is_spring(ds):
    date = pd.to_datetime(ds)
    return (date.month >= 3 and date.month <= 5)

def is_summer(ds):
    date = pd.to_datetime(ds)
    return (date.month >= 6 and date.month <= 8)

def is_fall(ds):
    date = pd.to_datetime(ds)
    return (date.month >= 9 and date.month <= 11)

def is_winter(ds):
    date = pd.to_datetime(ds)
    return (date.month == 12 or date.month < 3)

sample['spring day'] = sample['ds'].apply(is_spring)
sample['summer day'] = sample['ds'].apply(is_summer)
sample['fall day'] = sample['ds'].apply(is_fall)
sample['winter day'] = sample['ds'].apply(is_winter)
Then add the seasonality before fitting the model
m.add_seasonality(name='Spring', period=7, fourier_order=3, condition_name='spring day')
m.add_seasonality(name='Summer', period=7, fourier_order=3, condition_name='summer day')
m.add_seasonality(name='Fall', period=7, fourier_order=3, condition_name='fall day')
m.add_seasonality(name='Winter', period=7, fourier_order=3, condition_name='winter day')
That is the simple tutorial for using prophet. Check the notebook for full code and also check prophet documentation for more information about prophet forecasting.