

![]()

Kubernetes Opex Analytics is meant to allow organizations to track the resources being consumed by their Kubernetes clusters to prevent overpaying. To do so, Kubernetes Opex Analytics generates short-, mid- and long-term usage reports so give relevant insights on what amount of resources each project is spending over time. The final goal being to help organizations make cost allocation and capacity planning decisions with factual analytics.
To meet this goal, Kubernetes Opex Analytics periodically collects CPU and memory usage metrics from Kubernetes's APIs, processes and consolidates them over various time-aggregation perspectives (hourly, daily, monthly), to produce resource usage reports covering up to a year. The reports focus on namespace level, while a special care is taken to also account and highlight shares of non-allocatable capacities.
Kubernetes Opex Analytics enables cost allocation and capacity planning analytics based on the following core features:
- Namespace-focused: Means that consolidated resource usage metrics consider individual namespaces as fundamental units for resource sharing. A special care is taken to also account and highlight non-allocatable resources .
- Hourly Usage & Trends: Like on public clouds, resource use for each namespace is consolidated on a hourly-basic. This actually corresponds to the ratio (%) of resource used per namespace during each hour. It's the foundation for cost calculation and also allows to get over time trends about resources being consuming per namespace and also at the Kubernetes cluster scale.
- Daily and Monthly Usage Costs: Provides for each period (daily/monthly), namespace, and resource type (CPU/memory), consolidated cost computed given one of the following ways: (i) accumulated hourly usage over the period; (ii) actual costs computed based on resource usage and a given hourly billing rate; (iii) normalized ratio of usage per namespace compared against the global cluster usage.
- Occupation of Nodes by Namespaced Pods: Highlights for each node the share of resources used by active pods labelled by their namespace.
- Efficient Visualization: For metrics generated, Kubernetes Opex Analytics provides dashboards with relevant charts covering as well the last couple of hours than the last 12 months (i.e. year). For this there are built-in charts, a Prometheus Exporter along with Grafana Dashboard that all work out of the box.
Cost allocation models can be set through the startup configuration variable KOA_COST_MODEL. Possible values are:
CUMULATIVE_RATIO: (default value) compute costs as cumulative resource usage for each period of time (daily, monthly).RATIO: compute costs as normalized ratios (%) of resource usage during each period of time.CHARGE_BACK: compute actual costs using a given cluster hourly rate and the cumulative resource usage during each period of time.
Refer to the Configuration section for more details.
You can find below screenshorts of built-in charts.


You can either build your own dashboard or use our official one.
Our official Grafana dashboard looks as below and is designed to work out-of-the box with the Kubernetes Opex Analytics's Prometheus exporter. It requires to set a Grafana varianle named KOA_DS_PROMETHEUS, which shall point to your Prometheus server data source.
The dashboard currently provides the following reports:
- Hourly resource usage over time.
- Current day's ongoing resource usage.
- Current month's ongoing resource usage.
You should notice those reports are less rich compared against the ones enabled by the built-in Kubernetes Opex Analytics dashboard. In particular, the daily and the monthly usage for the different namespaces are not stacked, neither than there are not analytics for past days and months. These limitations are inherent to how Grafana handles timeseries and bar charts.

Kubernetes Opex Analytics needs read-only access to the following Kubernetes APIs.
- /apis/metrics.k8s.io/v1beta1
- /api/v1
You need to provide the base URL of the Kubernetes API when starting the program (see example below).
Typically if you're planning an installation inside a Kubernetes cluster, you can connect to the local cluster API endpoint at: https://kubernetes.default.
Likewise, if you're planning an installation outside a Kubernetes cluster you can use a proxied access to Kubernetes API as follows:
$ kubectl proxy
This will open a proxied access to Kubernetes API at http://127.0.0.1:8001.
Kubernetes Opex Analytics supports the following environment variables when it starts:
KOA_DB_LOCATIONsets the path to use to store internal data. Typically when you consider to set a volume to store those data, you should also take care to set this path to belong to the mounting point.KOA_K8S_API_ENDPOINTsets the endpoint to the Kubernetes API.KOA_COST_MODEL(version >=0.2.0): sets the model of cost allocation to use. Possible values are: CUMULATIVE_RATIO (default) indicates to compute cost as cumulative resource usage for each period of time (daily, monthly); CHARGE_BACK calculates cost based on a given cluster hourly rate (seeKOA_BILLING_HOURLY_RATE); RATIO indicates to compute cost as a normalized percentage of resource usage during each period of time.KOA_BILLING_HOURLY_RATE(required if cost model is CHARGE_BACK): defines a positive floating number corresponding to an estimated hourly rate for the Kubernetes cluster. For example if your cluster cost is $5,000 dollars a month (i.e.~30*24hours), its estimated hourly cost would be6.95 = 5000/(30*24).KOA_BILLING_CURRENCY_SYMBOL(optional, default is '$'): sets a currency string to use to annotate costs on reports.KOA_ENABLE_PROMETHEUS_EXPORTER: (boolean, default isfalse): set whether the Prometheus exporter will be enabled or not. Prior to version0.4.5the exporter was enabled by default.
Kubernetes Opex Analytics is released as a Docker image. So you can quickly start an instance of the service by running the following command:
$ docker run -d \
        --net="host" \
        --name 'kube-opex-analytics' \
        -v /var/lib/kube-opex-analytics:/data \
        -e KOA_DB_LOCATION=/data/db \
        -e KOA_K8S_API_ENDPOINT=http://127.0.0.1:8001 \
        -e KOA_ENABLE_PROMETHEUS_EXPORTER=true \
        rchakode/kube-opex-analytics
In this command:
- We provide a local path
/var/lib/kube-opex-analyticsas data volume for the container. That's where Kubernetes Opex Analytics will store its internal analytics data. You can change the local path to another location, but you MUST take care to adapt theKOA_DB_LOCATIONenvironment variable accordingly. - The environment variable
KOA_DB_LOCATIONpoints to the path to use by Kubernetes Opex Analytics to store its internal data. You can remark that this directory belongs to the data volume atached to the container. - The environment variable
KOA_K8S_API_ENDPOINTset the address of the Kubernetes API endpoint.
Once the container started you can open access the Kubernetes Opex Analytics's web interface at http://<DOCKER_HOST>:5483/. Where <DOCKER_HOST> should be replaced by the IP address or the hostmane of the Docker server.
For instance, if you're running Docker on your local machine the interface will be available at: http://127.0.0.1:5483/
Due to the time needed to have sufficient data to consolidate, you may need to wait almost a hour to have all charts filled. This is a normal operations of Kubernetes Opex Analytics.
There is a Helm chart to ease the deployment on Kubernetes, either by using Helm Tiller or kubectl.
In both cases check the values.yaml file to modify the configuration options according to your needs (e.g. to enable persistent volume for data storage, Prometheus Operator/ServiceMonitor, security context, etc).
Note on Security Context: Prior to version
0.4.2Kubernetes Opex Analytics's pods were deployed in privileged mode, meaning that, the container program was executed asroot. That was causing some warnings to be prompted during the startup (e.g. issue #15); even worse, on Kubernetes clusters with strong security policies, the execution of the container was prevented. As of version0.4.2a Kubernetes Security Context has been introduced to configure the pod to be launched in unprivileged mode by default. However, for backward compatibility, it it's still possible to launch the pod in privileged mode by setting the Helm configuration valuesecurityContext.enabledtofalse.
In the following deployment commands it's assumed that the target namespace kube-opex-analytics exists. If not yet the case create it first, or alternatively you can use any other namespace of your choice.
Using Helm Tiller:
$ helm upgrade \
  --namespace kube-opex-analytics \
  --install kube-opex-analytics \
  helm/kube-opex-analytics/
Using kubectl:
$ helm template \
  --namespace kube-opex-analytics \
  --name kube-opex-analytics \
  helm/kube-opex-analytics/ | kubectl apply -f -
This will also deploy an HTTP service named
kube-opex-analyticson port80in the selected namespace. This service enables access to the built-in dashboard of kubernetes Opex Analytics.
Starting from version 0.3.0, Kubernetes Opex Analytics enables a Prometheus exporter through the endpoint /metrics.
As of version 0.4.6, the exporter is not enabled by default. You need to set the environment variable KOA_ENABLE_PROMETHEUS_EXPORTER to true to enable it. If you're using the Helm chart, you can set the appropriate entry in the values.yaml file.
The exporter exposes the following metrics:
koa_namespace_hourly_usageexposes for each namespace its current hourly resource usage for both CPU and memory.koa_namespace_daily_usageexposes for each namespace and for the ongoing day, its current resource usage for both CPU and memory.koa_namespace_monthly_usageexposes for each namespace and for the ongoing month, its current resource usage for both CPU and memory.
The Prometheus scraping job can be configured like below (adapt the target URL if needed). A scraping interval less than 5 minutes (i.e. 300s) is useless as Kubernetes Opex Analytics would not generate any new metrics in the meantime.
scrape_configs:
  - job_name: 'kube-opex-analytics'
    scrape_interval: 300s
    static_configs:
      - targets: ['kube-opex-analytics:5483']
When the option
prometheusOperatoris enabled during the deployment (see Helm values.yaml file), you have nothing to do as the scraping should be automatically configured by the deployedPrometheus ServiceMonitor.
The datasets used to generated hourly, daily and monthly analytics charts can be exported in JSON and CSV formats.
The exportation process involves the following steps:
-
Get access to the Kubernetes Opex Analytics's built-in interface.
-
Go to the chart that you want to export dataset.
-
Click on the
tricolonicon near the chart title, and select the desired format for export.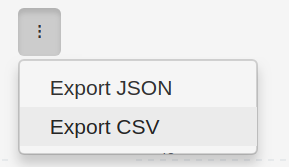
-
Choose a destination filename.
-
You're done, you can now use the dataset to generate other custom analytics according to your specific needs.

This tool (code and documentation) is licensed under the terms of Apache License 2.0. Read the LICENSE file for more details on the license terms.
The tool includes and is bound to third-party libraries provided with their owns licenses and copyrights. Read the NOTICE file for additional information.
We encourage feedback and always make our best to handle any troubles you may encounter when using this tool.
Here is the link to submit issues: https://github.com/rchakode/kube-opex-analytics/issues.
New ideas are welcomed, please open an issue to submit your idea if you have any one.
Contributions are accepted subject that the code and documentation be released under the terms of Apache 2.0 License.
To contribute bug patches or new features, you can use the Github Pull Request model.