Apartment valuator with neural networks and machine learning algorithms.
This project aims to use neural networks to predict apartment prices based on their features.
The data was manually extracted from 50 properties with their features and prices from Zonaprops and stored in the data.csv file, therefore the model only can predict apartment prices the location where the data was extracted.
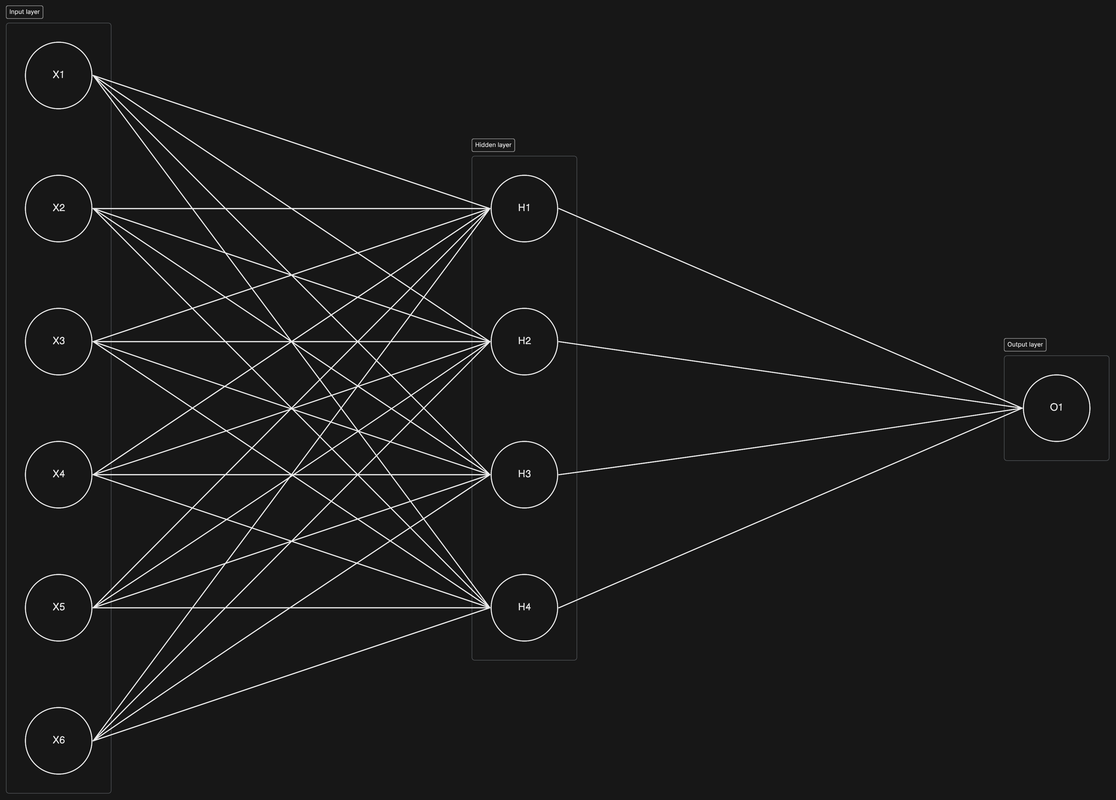
The model uses supervised machine learning to predict the apartment prices and consists of a neural network with one input layer, one hidden layer and one output layer.
In this section, the characteristics of the model and each of its parameters will be explained. To consider:
- All the prices are expressed in AR$ (Argentinian currency).
- Any AI library, such as Keras, were used for this project. It was carried out using numpy, pandas and matplotlib to plot the results.
- A small number of samples and hidden layers were used for the training data to avoid adding unnecessary complexity to the model. The objetive of this project is to learn and delve deeper into the AI ANN models.
- This project would probably be more accurate using another AI methods, such as k-nearest neighbors algorithm.
The input layer has 6 neurons based on the number of features of each apartment. The taken into account features are: surface area (m2), total number of rooms, number of bathrooms, number of bedrooms, the age of the apartment and the presence of a garage.
The output layer has 1 neuron that represents the predicted apartment price.
The hidden layer has 4 neurons determined by considering the number of neurons in both input and output layer as well as the size of the training data. The formula below was used to calculate the size of the hidden layer:
This formula was proposed by Jeff Heaton in his book Introduction to Neural Networks for Java.
Where:
- Nh = is the number of neurons in the hidden layer
- Ns = is the number of samples in the training data
- Ni = is the number of neurons in the input layer
- No = is the number of neurons in the output layer
- a = is an arbitrary value, usually between 2 and 10 (2 was used in this case)
The activation function for the hidden layer is ReLU (Rectified Linear Unit). ReLU returns 0 if the input value is less than 0 and returns the input value if it is greater than or equal to 0:
The error function used is MAE (Mean Absolute Error):
MAE was chosen because it is less sensitive to outliers than MSE (Mean Squared Error) and is easier to read.
The chosen learning rate is 0.0000000007 (7e-10), which was determined by trial and error.
The number of iterations (epochs) was 100 based on the error convergence.
The model is trained using k-fold cross validation with k=5 to avoid the overfitting. In this approach the data set is splitted into 5 equal segments and the model is trained 5 times. During each iteration, one segment serves as the validation set and the remaining 4 segments form the training set.
In this case, with 50 samples, each segment has 10 samples and the model is trained 5 times, each time using 40 samples as training set and 10 samples as validation set.
The weights are initialized using He initialization (also called Kaiming initialization) and the biases are initialized at 0. This initialization method is a variation of Xavier initialization, proposed by Kaiming He in his paper Delving Deep into Rectifiers: Surpassing Human-Level Performance on ImageNet Classification and is calculated as a random number with Gaussian distribution with mean 0 and a standard deviation of sqrt(2/n), where n is the number of inputs to the node.
The training process is performed 100 times and consist of the following steps:
-
The forward pass is performed through each layer of the neural network using dot products to calculate the value of each neuron. Then, ReLU is applied to the output of the hidden layer and the value of the output neuron (the predicted apartment price) is obtained. This is done for both the training set and validation test.
-
The error of both datasets is calculated using the MAE error function.
-
The backpropagation process is performed to calculate the gradients for each layer of the neural network. It employes the derivative of the ReLU activation function to compute the gradients for the hidden layer and the derivative of the MAE error function to compute the gradients for the output layer.
-
The weights and biases are updated using the computed gradients and the learning rate.
-
Steps 1 to 4 are repeated until the validation error converges or the maximun number of iterations is reached.
Once the training process is completed, the validation and training errors for all iterations in each fold are stored to be plotted. Also, the average of the training errors is computed for each fold to obtain the final training error.
In this section, the scores, predictions and graphs obtained will be displayed for subsequent analysis.
The table below shows the results of the predicted prices alongside the real prices of the apartments for each fold.
| Fold | Predicted price | Ground truth |
|---|---|---|
| 1 | 61945 | 62000 |
| 1 | 104779 | 70000 |
| 1 | 52653 | 59900 |
| 1 | 65209 | 69000 |
| 1 | 100423 | 135000 |
| 1 | 76192 | 80000 |
| 1 | 45751 | 50000 |
| 1 | 50632 | 50000 |
| 1 | 53842 | 55900 |
| 1 | 109988 | 118000 |
| 2 | 77773 | 85000 |
| 2 | 66972 | 89000 |
| 2 | 69974 | 53000 |
| 2 | 69974 | 59000 |
| 2 | 93356 | 119000 |
| 2 | 95024 | 152000 |
| 2 | 36755 | 68000 |
| 2 | 79474 | 74000 |
| 2 | 70335 | 64000 |
| 2 | 71398 | 60000 |
| 3 | 94728 | 84900 |
| 3 | 127837 | 130000 |
| 3 | 84347 | 46000 |
| 3 | 73304 | 67000 |
| 3 | 62023 | 52000 |
| 3 | 63409 | 88900 |
| 3 | 88116 | 73000 |
| 3 | 40831 | 59000 |
| 3 | 27206 | 28000 |
| 3 | 76555 | 80000 |
| 4 | 70034 | 68000 |
| 4 | 71324 | 45000 |
| 4 | 162306 | 112000 |
| 4 | 57273 | 69900 |
| 4 | 95107 | 54000 |
| 4 | 186248 | 110000 |
| 4 | 67480 | 89000 |
| 4 | 108984 | 180000 |
| 4 | 81133 | 80000 |
| 4 | 75237 | 70000 |
| 5 | 45858 | 45000 |
| 5 | 85843 | 85000 |
| 5 | 71953 | 90000 |
| 5 | 92903 | 132000 |
| 5 | 57435 | 60000 |
| 5 | 86683 | 85000 |
| 5 | 75560 | 79000 |
| 5 | 148159 | 170000 |
| 5 | 86167 | 85000 |
| 5 | 96730 | 125000 |
The table below shows the results of the MAE score for both training and validation data of each fold and their average.
| Fold | MAE (training) | MAE (validation) |
|---|---|---|
| 1 | 18149.24 | 9906.33 |
| 2 | 15937.62 | 19363.67 |
| 3 | 17124.09 | 13005.82 |
| 4 | 12997.48 | 30731.95 |
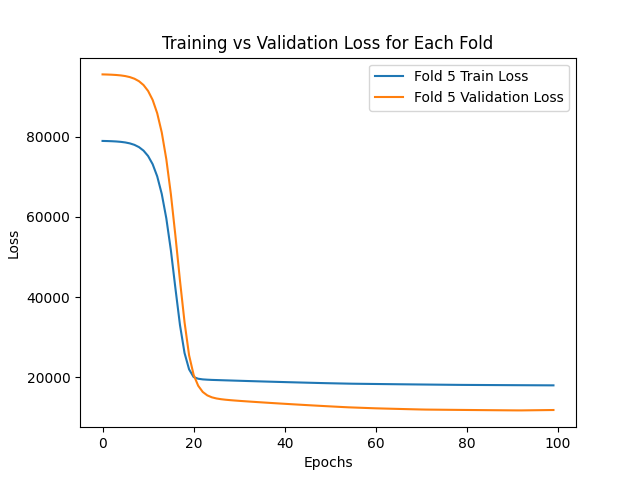
| 5 | 17992.17 | 11766.07 |
| Avg | 16440.12 | 16954.76 |
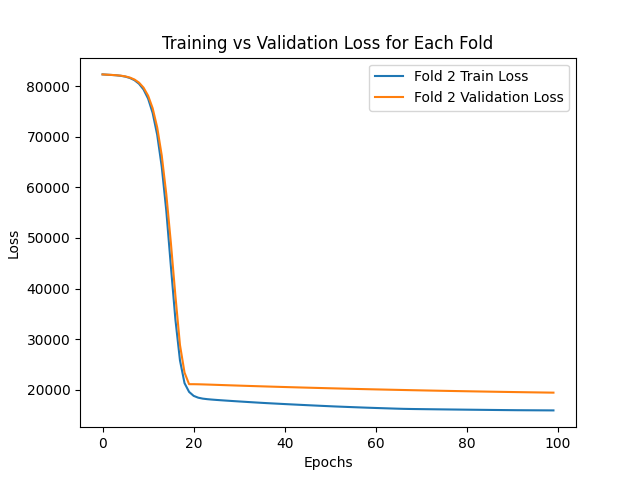
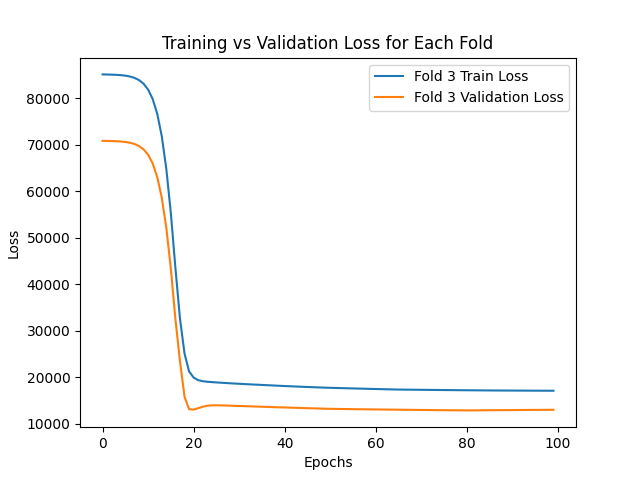
The graphs below show how both the training and validation errors converge during the training process for each fold of the validation set.
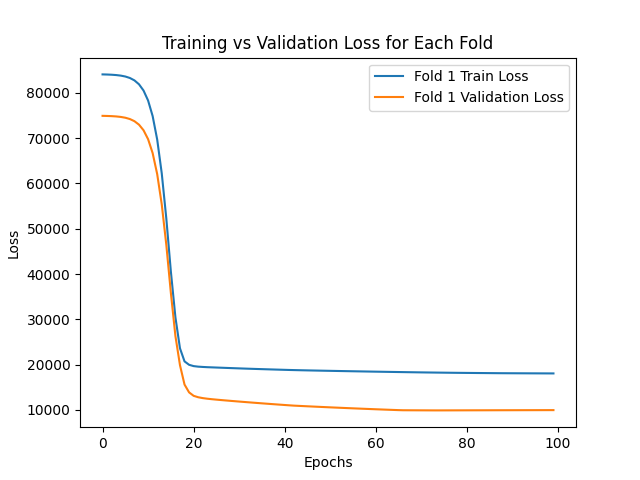
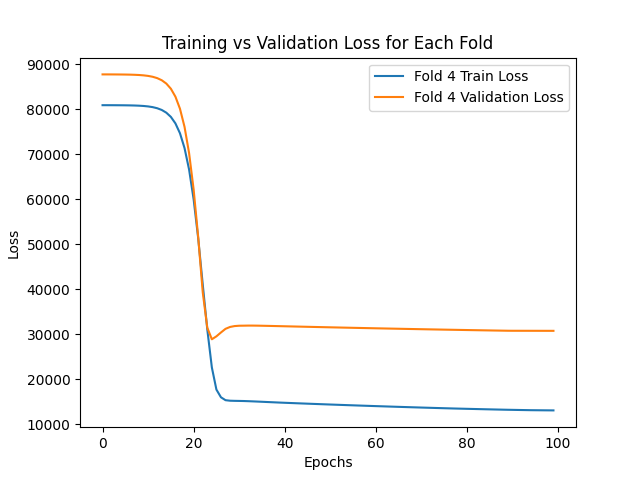
Based on the results obtained, it can be conclude that the implemented model is capable to predict the prices of an apartment with an average absolute error of AR$ 16440.12 for the training set and AR$ 16954.76 for the validation set.
Although the average absolute error for the validation set is higher than the training set, it can be noticed that the average absolute error for the validation set is smaller than the training set in the folds 1, 3 and 5. This might be due to the following reasons:
-
Since the validation data is smaller than the training data, it has less variation.
-
Since the validation data has a different distribution and it is smaller than the training data, it is easier to predict in those folds.
We could try to handle this by collecting additional data to expand both the validation and training datasets. Nevertheless, this should not represent an issue for the model's performance.
In folds 2 and 4, the average absolute error for the validation set is higher than the training set. This might be due to the following reasons:
-
The prices of the apartments do not always correspond to their features. For example, an apartment might have a higher or lower price regardless of whether it has many or few bedrooms and bathrooms. This may be due to the apartment is located in a luxury area or the owner is in a hurry to sell it.
-
The model does not have enough data. For example, the model has not seen an apartment with 5 bedrooms and 4 bathrooms during training. Therefore, it would not be able to predict accurately the apartment's price with these characteristics.
Especially in the fourth fold, it can be observed that the average absolute error for the validation set is extremely high. This may be due to the validation set in the fourth fold having very varied characteristics in comparison to the training set.
Choosing as an example the second prediction of the fourth fold:
| Fold | Predicted price | Actual price |
|---|---|---|
| 4 | 71324 | 45000 |
It has the following features:
| Surface | Rooms | Bathrooms | Bedrooms | Age | Garage | Actual price |
|---|---|---|---|---|---|---|
| 49 | 2 | 1 | 1 | 43 | 0 | 45000 |
It can be observed that the predicted price is much higher than the actual price. This can be explained by the fact that the model compared the price of the apartment with other similar apartments in the training set and predicted a similar price.
The nearest apartment data to that apartment is the following:
| Surface | Rooms | Bathrooms | Bedrooms | Age | Garage | Actual price |
|---|---|---|---|---|---|---|
| 49 | 2 | 1 | 1 | 13 | 0 | 80000 |
Although both apartments are very similar, the actual price between them varies by almost a 50%. This variation affects negatively the average absolute error in the validation set of the fourth fold. This analysis also applies to the other differences between the actual prices and the predicted prices, especially in the fourth fold.
One way to handle this problem is to gather further data for the training set and treat the outliers that do not match with their features in a special way.