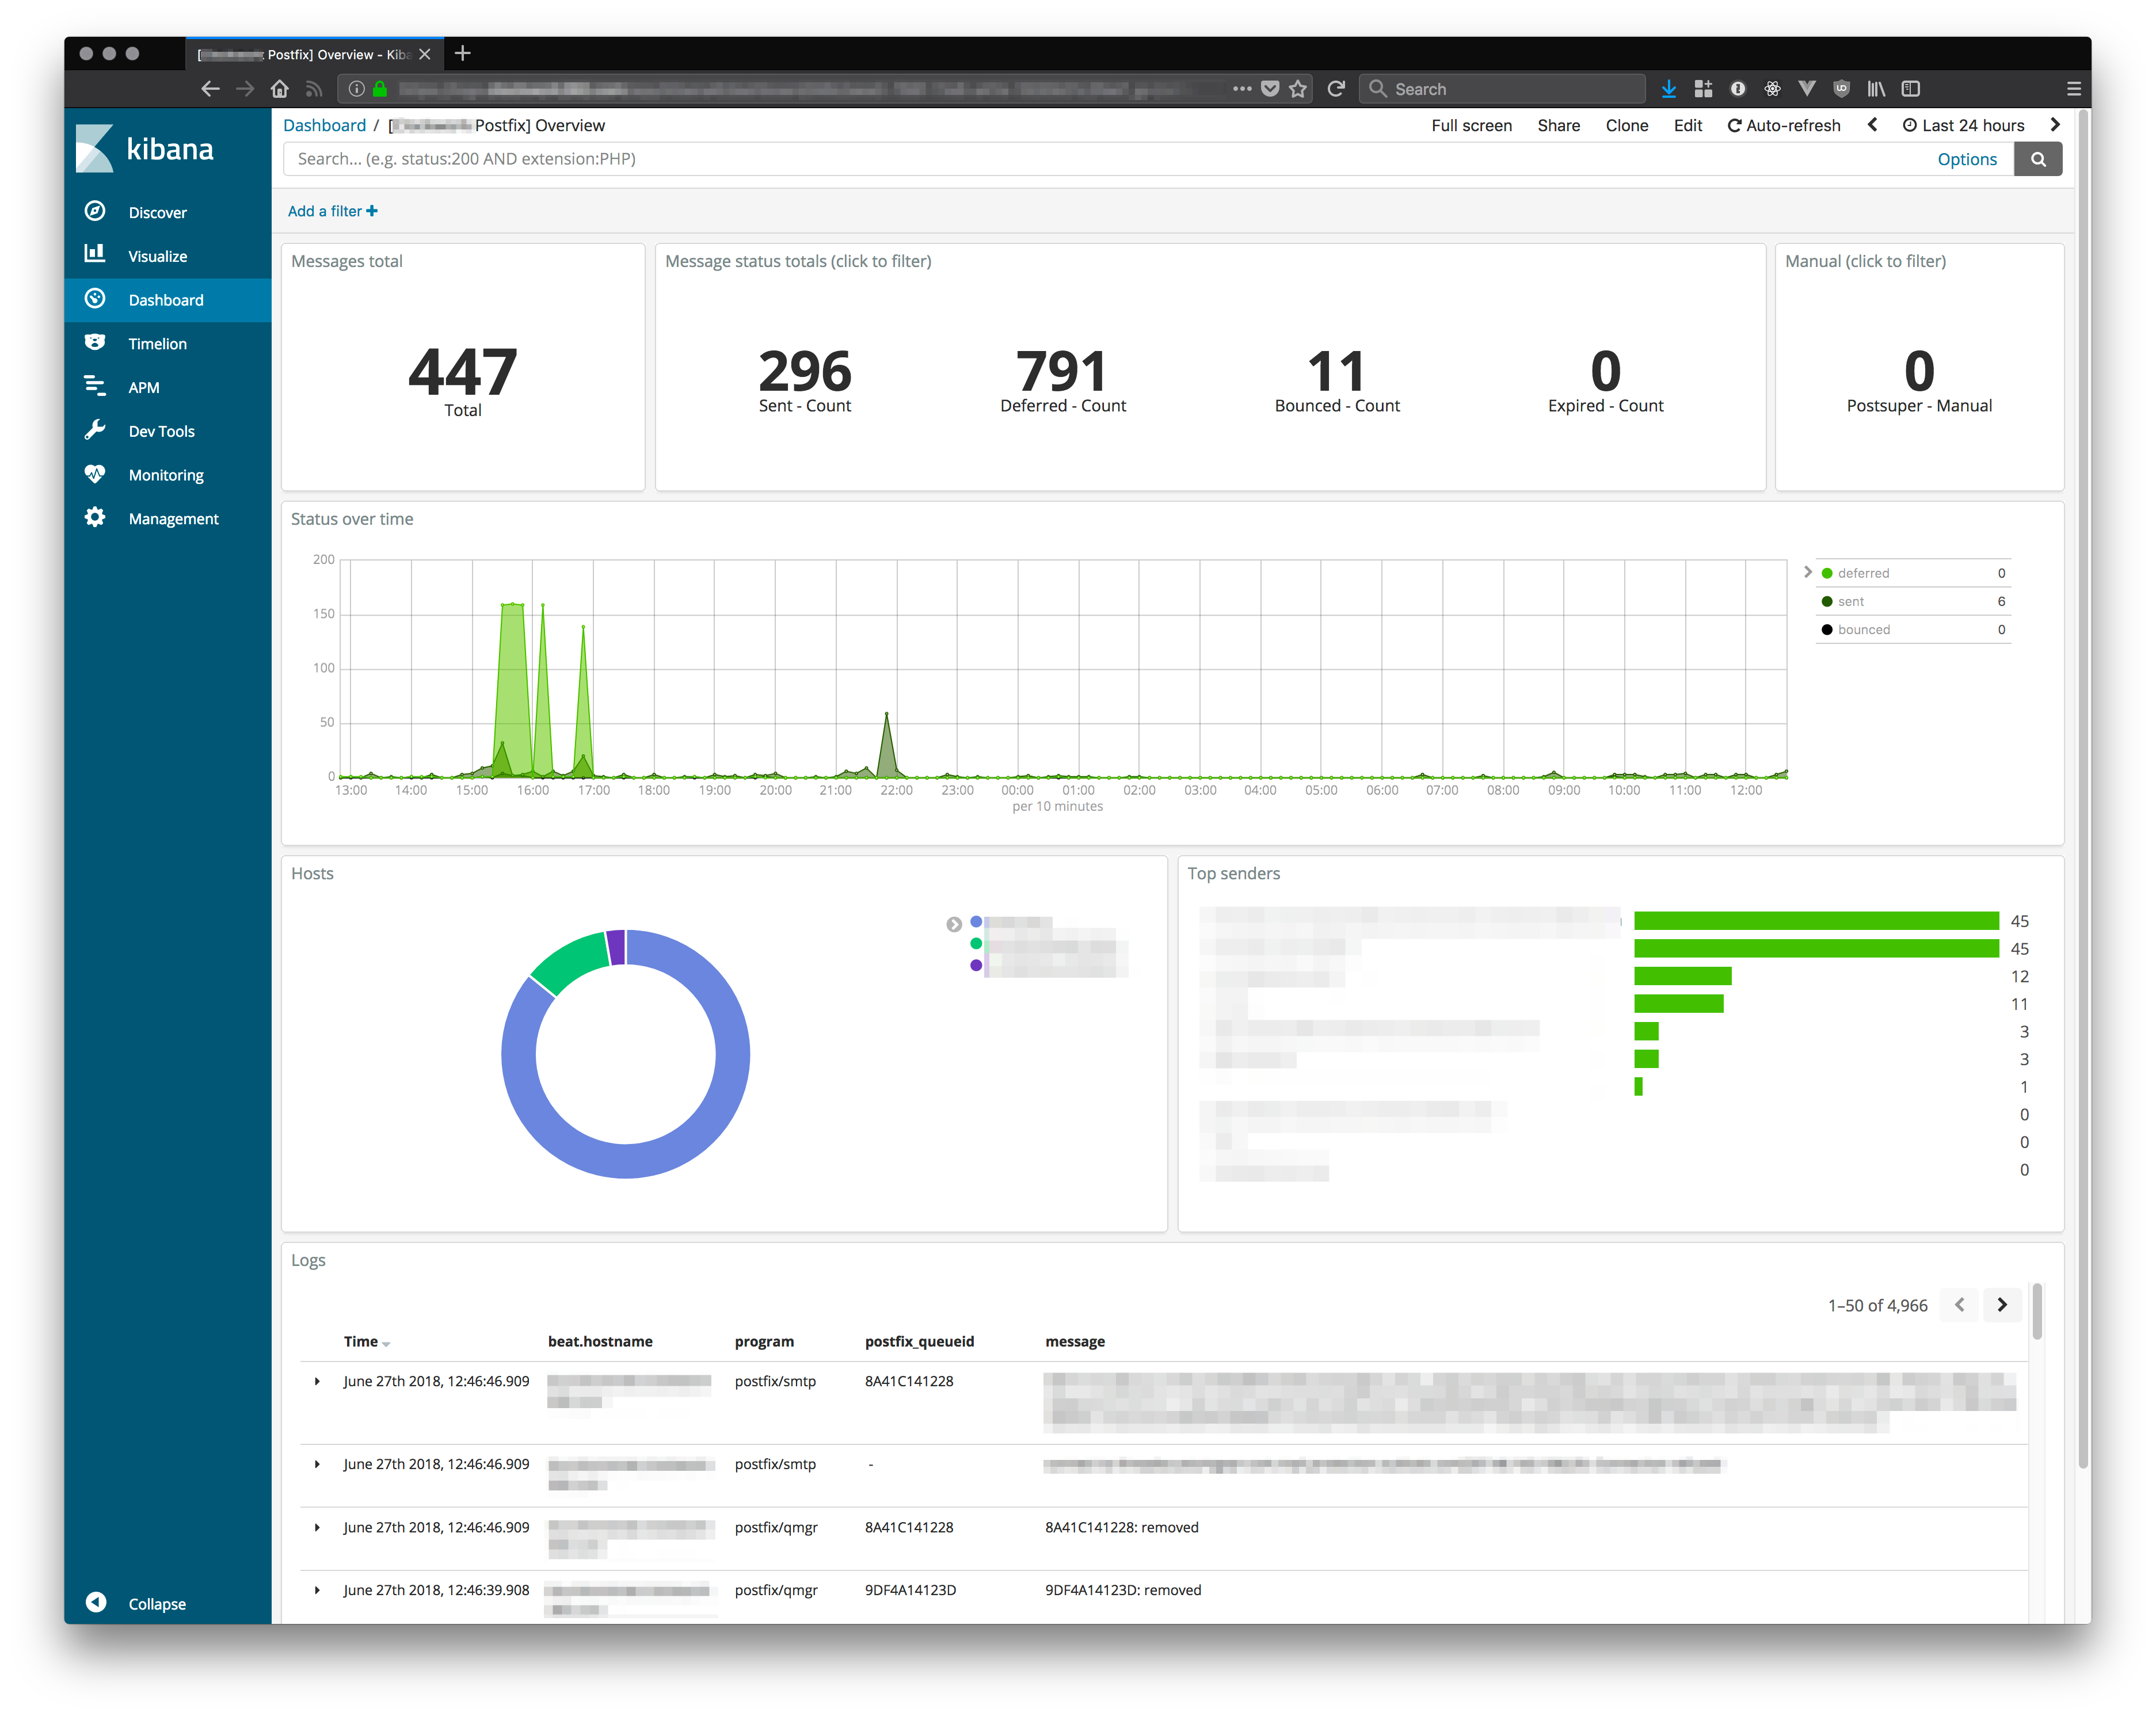
A set of Kibana files to automatically setup a Postfix dashboard based on data stored in Elastic Search using postfix-grok-patterns. Also includes Postfix log import setup information using Filebeat and Logstash.
Two import methods are supported: Kibana Management UI and Kibana Dashboard API. They both do the same thing, your choice is based on which you prefer or which one you have access to.
These imports should be run after setting up Logstash (and Filebeat) using whyscream's postfix-grok-patterns setup or our slightly modified version below.
Import using Management UI:
- Open your Kibana dashboard.
- Go to Management > Kibana > Saved Objects.
- Click Import.
- Select all
kibana/ui-*files:kibana/ui-dashboards.jsonkibana/ui-searches.jsonkibana/ui-visualizations.json
- Click Open
- View at Dashboards > [Filebeat Postfix] Overview.
Import using Dashboard API:
- Copy
kibana/api-combined.jsonto your Kibana server. - Run
curl -XPOST localhost:5601/api/kibana/dashboards/import -H 'kbn-xsrf:true' -H 'Content-type:application/json' -d @api-combined.json - View at Dashboards > [Filebeat Postfix] Overview.
While you can absolutely visit postfix-grok-patterns and get going I recommend using the following adjustments to keep your grok patterns isolated. The biggest change we're going to make is that we will use Filebeat for log shipping and we'll include a "postfix" field check for our grok patterns.
Create patterns directory (if not present):
cd /etc/logstash
mkdir patterns.d
Create patterns.d/postfix.grok:
- Grab https://github.com/whyscream/postfix-grok-patterns/blob/master/postfix.grok
- Put it at
patterns.d/postfix.grok
Create conf.d/48-beats-postfix-prepare.conf (or whatever you want to name it):
filter {
  if [postfix] {
    grok {
      match => { "message" => "%{SYSLOGTIMESTAMP} %{SYSLOGHOST} %{DATA:program}(?:\[%{POSINT}\])?: %{GREEDYDATA:message}" }
      overwrite => "message"
    }
  }
}
Note: this is basically what's suggested from whyscream's repo, with our own postfix (field) check that's set as part of filebeat's shipper.
Create conf.d/49-beats-postfix.conf:
- Grab https://github.com/whyscream/postfix-grok-patterns/blob/master/50-filter-postfix.conf
- Put it at
conf.d/49-beats-postfix.conf(or whatever you want to name it)
Restart logstash:
systemctl restart logstashThe easiest way to ship our Postfix logs is using Filebeat. We're going to create a custom input with a "postfix" field that we use in our Logstash pipelines.
Create new configs directory:
cd /etc/filebeat/
mkdir configs.d
Create configs.d/postfix.yml:
- type: log
  paths:
    - /var/log/mail.log*
  exclude_files: [".gz$"]
  fields:
    postfix: true
  fields_under_root: true
Edit filebeat.yml, add this (near modules):
#======================= Filebeat (additional) configs ========================

filebeat.config.inputs:

  # Change to true to enable, false to disable
  enabled: true

  # Glob pattern for configuration loading
  path: ${path.config}/configs.d/*.yml
Restart filebeat:
systemctl restart filebeatMIT Licensed
All we're doing here is setting up Kibana visuals. The real work for most of this comes from whyscream's postfix-grok-patterns. We just wrapped grok with a field check and setup Filebeat.