- Project Overview
- Installation
- Project Details
- Project Motivation
- Results
- Licensing, Authors, and Acknowledgements
Real-world data rarely comes clean. Using Python and its libraries, you will gather data from a variety of sources and in a variety of formats, assess its quality and tidiness, then clean it. This is called data wrangling. You will document your wrangling efforts in a Jupyter Notebook, plus showcase them through analyses and visualizations using Python (and its libraries) and/or SQL.
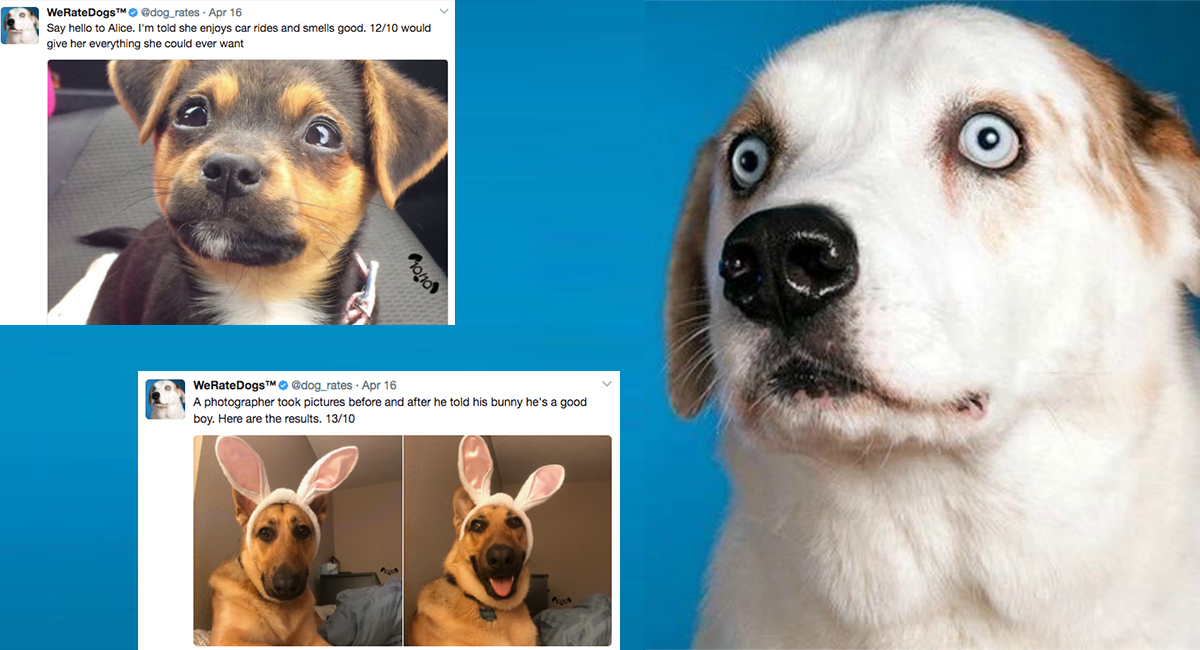
The dataset that you will be wrangling (and analyzing and visualizing) is the tweet archive of Twitter user @dog_rates, also known as WeRateDogs. WeRateDogs is a Twitter account that rates people's dogs with a humorous comment about the dog. These ratings almost always have a denominator of 10. The numerators, though? Almost always greater than 10. 11/10, 12/10, 13/10, etc. Why? Because "they're good dogs Brent." WeRateDogs has over 4 million followers and has received international media coverage.
WeRateDogs downloaded their Twitter archive and sent it to Udacity via email exclusively for you to use in this project. This archive contains basic tweet data (tweet ID, timestamp, text, etc.) for all 5000+ of their tweets as they stood on August 1, 2017. More on this soon.
The entirety of this project can be completed inside the Udacity classroom on the Project Workspace: Complete and Submit Project page using the Jupyter Notebook provided there. (Note: This Project Workspace may not be available in all versions of this project, in which case you should follow the directions below.)
If you want to work outside of the Udacity classroom, the following software requirements apply:
- You need to be able to work in a Jupyter Notebook on your computer. Please revisit our Jupyter Notebook and Anaconda tutorials earlier in the Nanodegree program for installation instructions.
- The following packages (libraries) need to be installed. You can install these packages via conda or pip. Please revisit our Anaconda tutorial earlier in the Nanodegree program for package installation instructions.
- pandas
- NumPy
- requests
- tweepy
- json
- You need to be able to create written documents that contain images and you need to be able to export these documents as PDF files. This task can be done in a Jupyter Notebook, but you might prefer to use a word processor like Google Docs, which is free, or Microsoft Word.
- A text editor, like Sublime, which is free, will be useful but is not required.
Your tasks in this project are as follows:
- Data wrangling, which consists of:
- Gathering data (downloadable file in the Resources tab in the left most panel of your classroom and linked in step 1 below).
- Assessing data
- Cleaning data
- Storing, analyzing, and visualizing your wrangled data
- Reporting on 1) your data wrangling efforts and 2) your data analyses and visualizations
Gather each of the three pieces of data as described below in a Jupyter Notebook titled wrangle_act.ipynb:
- The WeRateDogs Twitter archive. I am giving this file to you, so imagine it as a file on hand. Download this file manually by clicking the following link: twitter_archive_enhanced.csv
- The tweet image predictions, i.e., what breed of dog (or other object, animal, etc.) is present in each tweet according to a neural network. This file (image_predictions.tsv) is hosted on Udacity's servers and should be downloaded programmatically using the Requests library and the following URL: https://d17h27t6h515a5.cloudfront.net/topher/2017/August/599fd2ad_image-predictions/image-predictions.tsv
- Each tweet's retweet count and favorite ("like") count at minimum, and any additional data you find interesting. Using the tweet IDs in the WeRateDogs Twitter archive, query the Twitter API for each tweet's JSON data using Python's Tweepy library and store each tweet's entire set of JSON data in a file called tweet_json.txt file. Each tweet's JSON data should be written to its own line. Then read this .txt file line by line into a pandas DataFrame with (at minimum) tweet ID, retweet count, and favorite count. Note: do not include your Twitter API keys, secrets, and tokens in your project submission.
After gathering each of the above pieces of data, assess them visually and programmatically for quality and tidiness issues. Detect and document at least eight (8) quality issues and two (2) tidiness issues in your wrangle_act.ipynb Jupyter Notebook. To meet specifications, the issues that satisfy the Project Motivation (see the Key Points header on the previous page) must be assessed.
Clean each of the issues you documented while assessing. Perform this cleaning in wrangle_act.ipynb as well. The result should be a high quality and tidy master pandas DataFrame (or DataFrames, if appropriate). Again, the issues that satisfy the Project Motivation must be cleaned.
Store the clean DataFrame(s) in a CSV file with the main one named twitter_archive_master.csv. If additional files exist because multiple tables are required for tidiness, name these files appropriately. Additionally, you may store the cleaned data in a SQLite database (which is to be submitted as well if you do).
Analyze and visualize your wrangled data in your wrangle_act.ipynb Jupyter Notebook. At least three (3) insights and one (1) visualization must be produced.
Create a 300-600 word written report called wrangle_report.pdf or wrangle_report.html that briefly describes your wrangling efforts. This is to be framed as an internal document.
Create a 250-word-minimum written report called act_report.pdf or act_report.html that communicates the insights and displays the visualization(s) produced from your wrangled data.
- Ensure you meet specifications for all items in the Project Rubric. Your project "meets specifications" only if it meets specifications for all of the criteria.
- Ensure you have not included your API keys, secrets, and tokens in your project files.
- If you completed your project in the Project Workspace, ensure the following files are present in your workspace, then click "Submit Project" in the bottom righthand corner of the Project Workspace page:
wrangle_act.ipynb: code for gathering, assessing, cleaning, analyzing, and visualizing datawrangle_report.pdforwrangle_report.html: documentation for data wrangling steps: gather, assess, and cleanact_report.pdforact_report.html: documentation of analysis and insights into final datatwitter_archive_enhanced.csv: file as givenimage_predictions.tsv: file downloaded programmaticallytweet_json.txt: file constructed via APItwitter_archive_master.csv: combined and cleaned data- any additional files (e.g. files for additional pieces of gathered data or a database file for your stored clean data)
This is an Udacity Nanodegree project.I was interested in using Tweet Data to better understand:
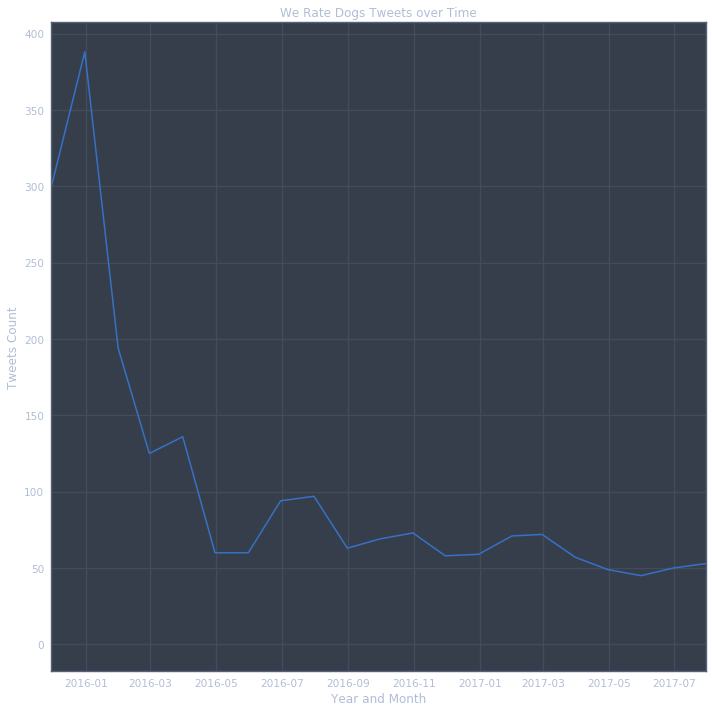
- What is the total number of tweets over time to see whether that number increases, or decreases, over time.
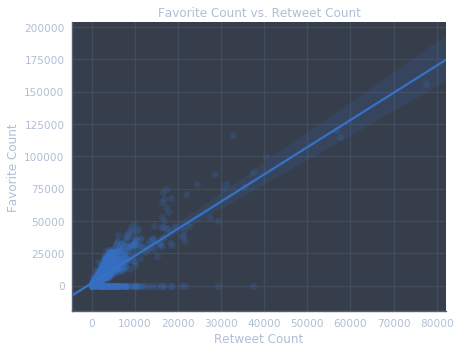
- what is the retweet counts, and favorite counts comparison over time.
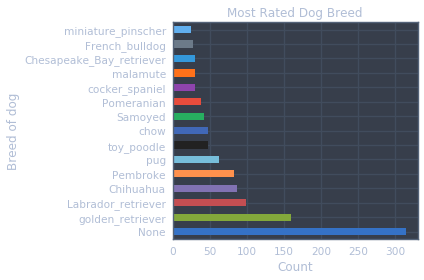
- What is the most popular dog breed.
- What is the most popular dog names.
- Over time tweets decreased sharply, with spikes in activity during the early of 2016(Jan), 2016(Mar), and generally decreasing from there.
- Favorite counts are correlated with retweet counts - this is a positive correlation.
- The most popular dog breed is a golden retriever, with a labrador retriever coming in as the second most popular breed.
- The three most popular dog names are:
- Lucy - 11
- Charlie - 11
- Oliver - 10 and so on
- Visualizations

Must give credit to Udacity to providing this data. You can find the Licensing for the data and other descriptive information at here