Udacity Predictive Analytics for Business
Project VI: Combining Predictive Techniques
Table of Contents
- Project Overview
- Task - I: Store Format
- Task - II: New Stores
- Task - III: Forecasting
- Results
- Licensing, Authors, and Acknowledgements
Project Overview
Capstone Project Overview
The capstone project has three main tasks, each of which requires you to use skills you developed during the Nanodegree program. Once you complete all three tasks, please submit the project as a PDF.
Tips
- Split up your Alteryx workflows: You will be using multiple data sources and complex tools, which can slow down the workflow runtime. Splitting up the workflows makes the process more manageable.
- Map out your work: Before you dive into your analysis, think about the steps and plan ahead. This will reduce the amount of unnecessary work.
- Use visualizations: Include visualizations to help explain your decisions and communicate your findings. Remember what you learned about making them look great!
Task - I: Store Format
Task 1: Store Format for Existing Stores
Your company currently has 85 grocery stores and is planning to open 10 new stores at the beginning of the year. Currently, all stores use the same store format for selling their products. Up until now, the company has treated all stores similarly, shipping the same amount of product to each store. This is beginning to cause problems as stores are suffering from product surpluses in some product categories and shortages in others. You've been asked to provide analytical support to make decisions about store formats and inventory planning.

Task 1: Determining Store Format
To remedy the product surplus and shortages, the company wants to introduce different store formats. Each store format will have a different product selection in order to better match local demand. The actual building sizes will not change, just the product selection and internal layouts. The terms "formats" and "segments" will be used interchangeably throughout this project. You’ve been asked to:
- Determine the optimal number of store formats based on sales data.
- Sum sales data by StoreID and Year
- Use percentage sales per category per store for clustering (category sales as a percentage of total store sales).
- Use only 2015 sales data.
- Use a K-means clustering model.
- Segment the 85 current stores into the different store formats.
- Use the StoreSalesData.csv and StoreInformation.csv files.
Note:
PCA is not used in this project.
Task 1 Submission
- What is the optimal number of store formats? How did you arrive at that number?
- How many stores fall into each store format?
- Based on the results of the clustering model, what is one way that the clusters differ from one another?
- Please provide a map created in Tableau that shows the location of the existing stores, uses color to show cluster, and size to show total sales. Make sure to include a legend! Feel free to simply copy and paste the map into the submission template.
Task - II: New Stores
Task 2: Store Format for New Stores
The grocery store chain has 10 new stores opening up at the beginning of the year. The company wants to determine which store format each of the new stores should have. However, we don’t have sales data for these new stores yet, so we’ll have to determine the format using each of the new store’s demographic data.

Task 2: Determine the Store Format for New Stores
You’ve been asked to:
- Develop a model that predicts which segment a store falls into based on the demographic and socioeconomic characteristics of the population that resides in the area around each new store.
- Use a 20% validation sample with Random Seed = 3 when creating samples with which to compare the accuracy of the models. Make sure to compare a decision tree, forest, and boosted model.
- Use the model to predict the best store format for each of the 10 new stores.
- Use the StoreDemographicData.csv file, which contains the information for the area around each store.
- Note: In a real world scenario, you could use PCA to reduce the number of predictor variables. However, there is no need to do so in this project. You can leave all predictor variables in the model.
Task 2 Submission
- What methodology did you use to predict the best store format for the new stores? Why did you choose that methodology?
- What are the three most important variables that help explain the relationship between demographic indicators and store formats? Please include a visualization.
- What format do each of the 10 new stores fall into? Please provide a data table.
Task - III: Forecasting
Task 3: Forecasting
Fresh produce has a short life span, and due to increasing costs, the company wants to have an accurate monthly sales forecast.

Task 3: Forecasting Produce Sales
You’ve been asked to prepare a monthly forecast for produce sales for the full year of 2016 for both existing and new stores. To do so, follow the steps below.
Note: Use a 6 month holdout sample for the TS Compare tool (this is because we do not have that much data so using a 12 month holdout would remove too much of the data)
Step 1: To forecast produce sales for existing stores you should aggregate produce sales across all stores by month and create a forecast.
Step 2: To forecast produce sales for new stores:
- Forecast produce sales (not total sales) for the average store (rather than the aggregate) for each segment.
- Multiply the average store produce sales forecast by the number of new stores in that segment.
- For example, if the forecasted average store produce sales for segment 1 for March is 10,000, and there are 4 new stores in segment 1, the forecast for the new stores in segment 1 would be 40,000.
- Sum the new stores produce sales forecasts for each of the segments to get the forecast for all new stores.
Step 3: Sum the forecasts of the existing and new stores together for the total produce sales forecast.
Task 3 Submission
- What type of ETS or ARIMA model did you use for each forecast? Use ETS(a,m,n) or ARIMA(ar, i, ma) notation. How did you come to that decision?
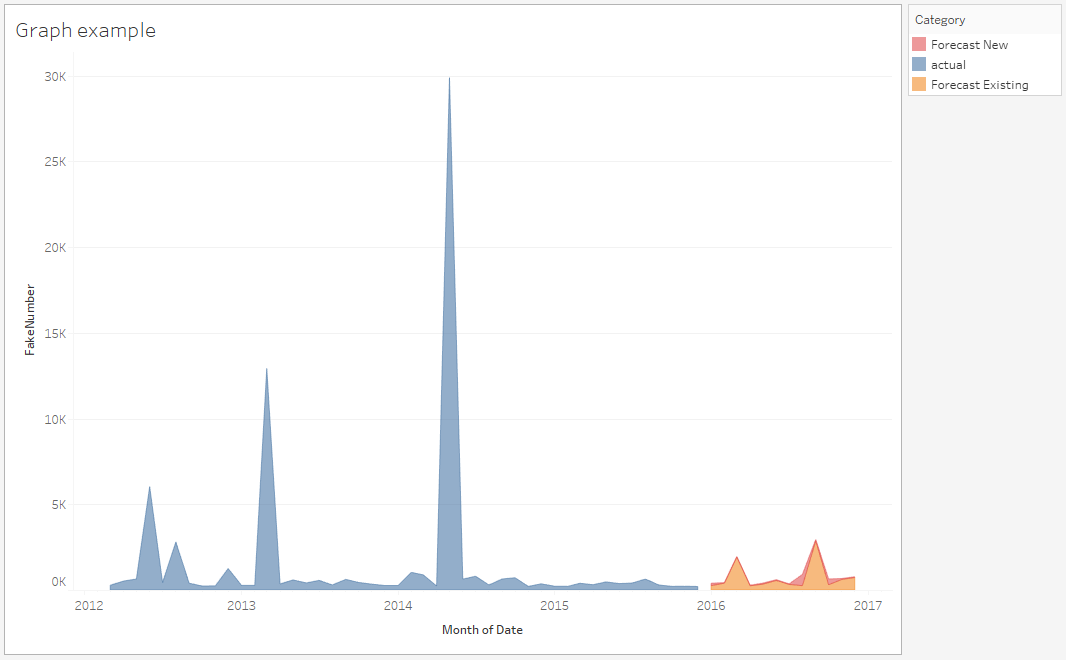
- Please provide a table of your forecasts for existing and new stores. Also, provide visualization of your forecasts that includes historical data, existing stores forecasts, and new stores forecasts.
This is the table we are expecting to see filled out in this Task

This is an example of the type of graph we are expecting to see, this does not reflect the actual numbers you will get in your analysis.
Here is an example sheet (with fake data) of how to put your data together so that you can use it in Tableau: https://docs.google.com/spreadsheets/d/1tkPpRstix73Bx_k4iDk-e5SovqrV3KiILLVGVgypBKw/edit?usp=sharing
You need a date column, a sales column, and a type column. You can stack the sales data for all three types of stores on top of each other (Existing, Forecast New, Forecast Existing). Once brought into Tableau you can use date and sum sales in your rows and columns and then you can color by type.
Results:
All the results are in the Report.pdf File.
Licensing, Authors, Acknowledgements
Must give credit to Udacity to providing this data. You can find the Licensing for the data and other descriptive information at Udacity Page.