The Global Terrorism Database (GTD) is an open-source database including information on terrorist events around the world from 1970 through 2017 (with annual updates planned for the future). Unlike many other event databases, the GTD includes systematic data on domestic as well as international terrorist incidents that have occurred during this time period and now includes more than 180,000 cases.
Copyright © 2009-2018 University of Maryland National Consortium for the Study of Terrorism and Responses to Terrorism A Center of Excellence of the U.S. Department of Homeland Security University of Maryland, College Park, MD 20740, USA 301.405.6600
We have Used R for sanitization of the data.
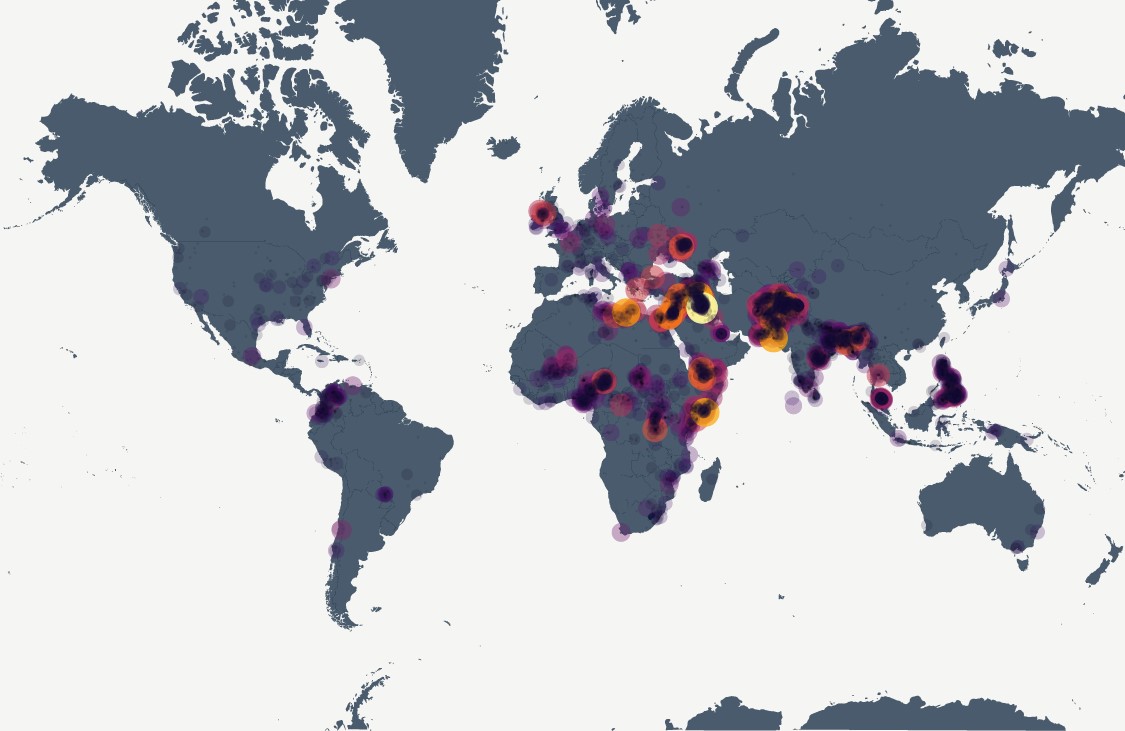
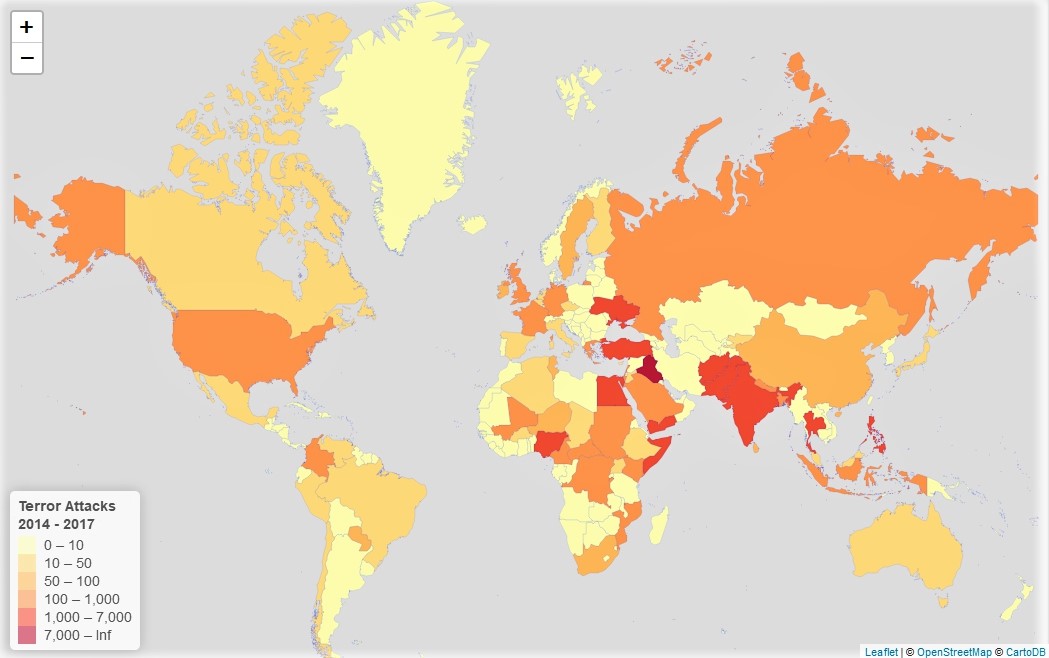
In this Visualization Project we have used data between 2014-2017
We have used Bubble Map Chart for this visualization
We have used Choropleth Map Chart for this visualization
Abhishek Roy. Would love to here from you! -> Get In Touch.
GNU General Public License v3.0