Program: Master in Mathematics Economics and Statistics (MMES) - African School of Economics
Course: Political Economy 2021/2022
write a research proposal by working with spatial conflict data using QGIS :
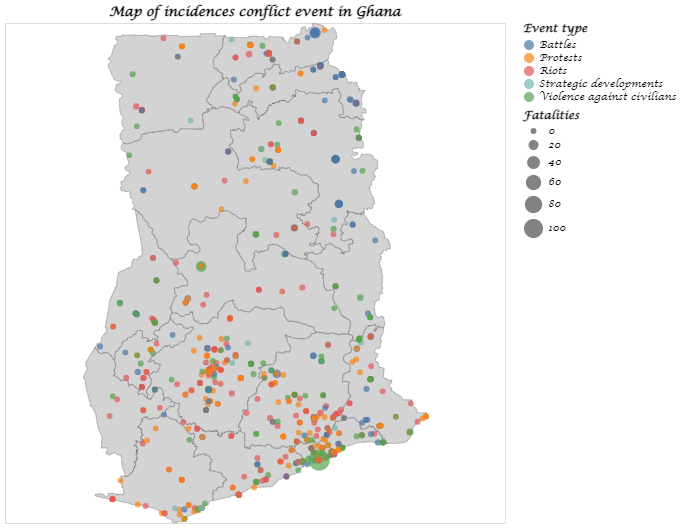
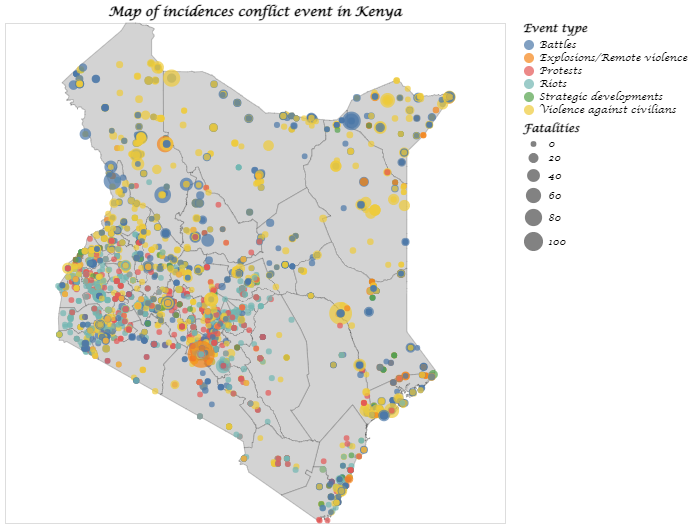
- Download the data and create a map of incidences in the conflict data set;
- Create a summary statistics using the conflict data;
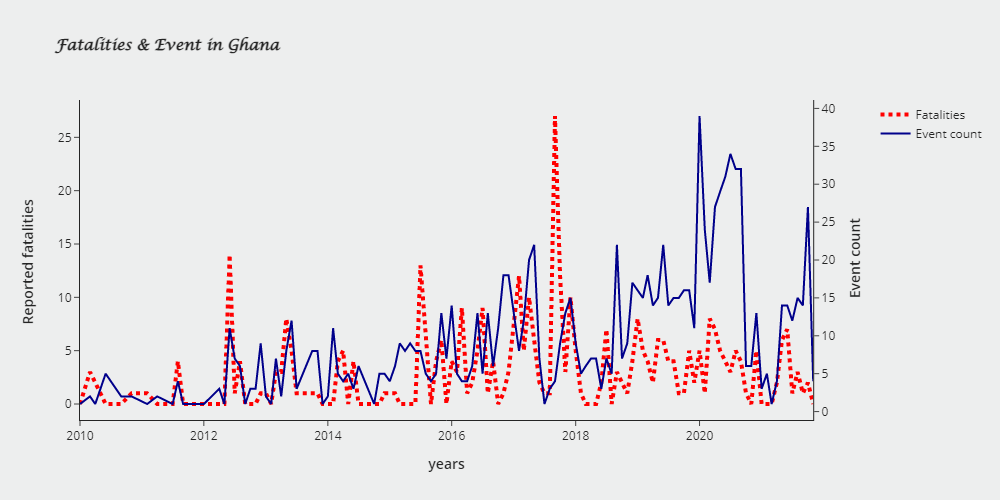
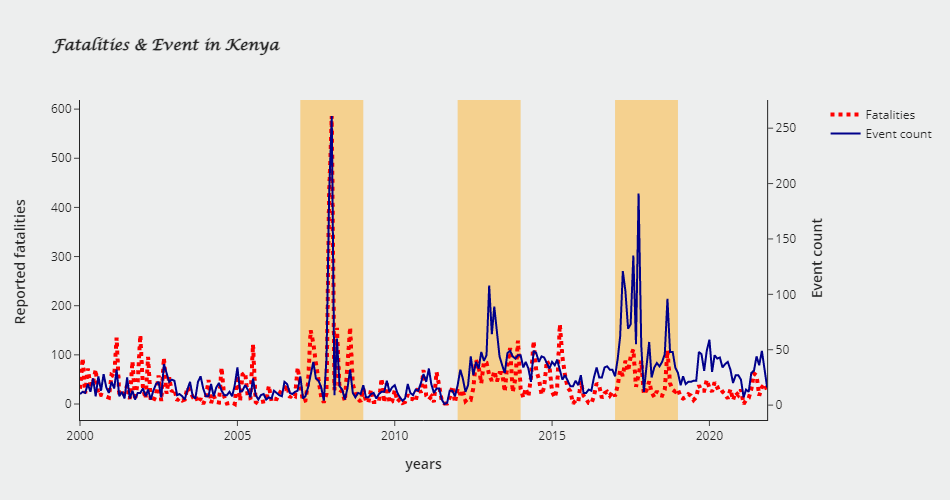
- Discover a patterns, write a brief background of the situation in the country of chose based on the summary statistics;
- Think about a research question that we would like to test;
- Extract numeric data (cropland, nighttime lights,and distance to the capital) from raster data using QGIS
- Describe an identification strategy (How you plan to test your research question). Write down your regression equation.
- Presents and interprets the regression results.
- Critique the results
To facilitate this objective, we used The Armed Conflict Location & Event Data Project (ACLED), which is a disaggregated data collection, analysis, and crisis mapping project. ACLED is a registered non-profit organization with 501(c)(3) status in the United States. This is a large dataset that provides an opportunity to use Python for data cleansing, exploratory data analysis, visualizations.
ACLED codes the dates, actors, locations, fatalities, and types of all reported political violence and demonstration events around the world in real time. The data covers the time period between 1997 through present day. The attributes consist of numeric, categorical, character, and time series values.
I work on Ghana and Kenya as countries to study. This is the final submission of the project for Ghana and Kenya. Here I share my notebook who help me answers the five first point of the project with some update on the visualization. The complete source is available on . The source data for the project is included. But, you can download from the The Armed Conflict Location & Event Data Project the update one.


