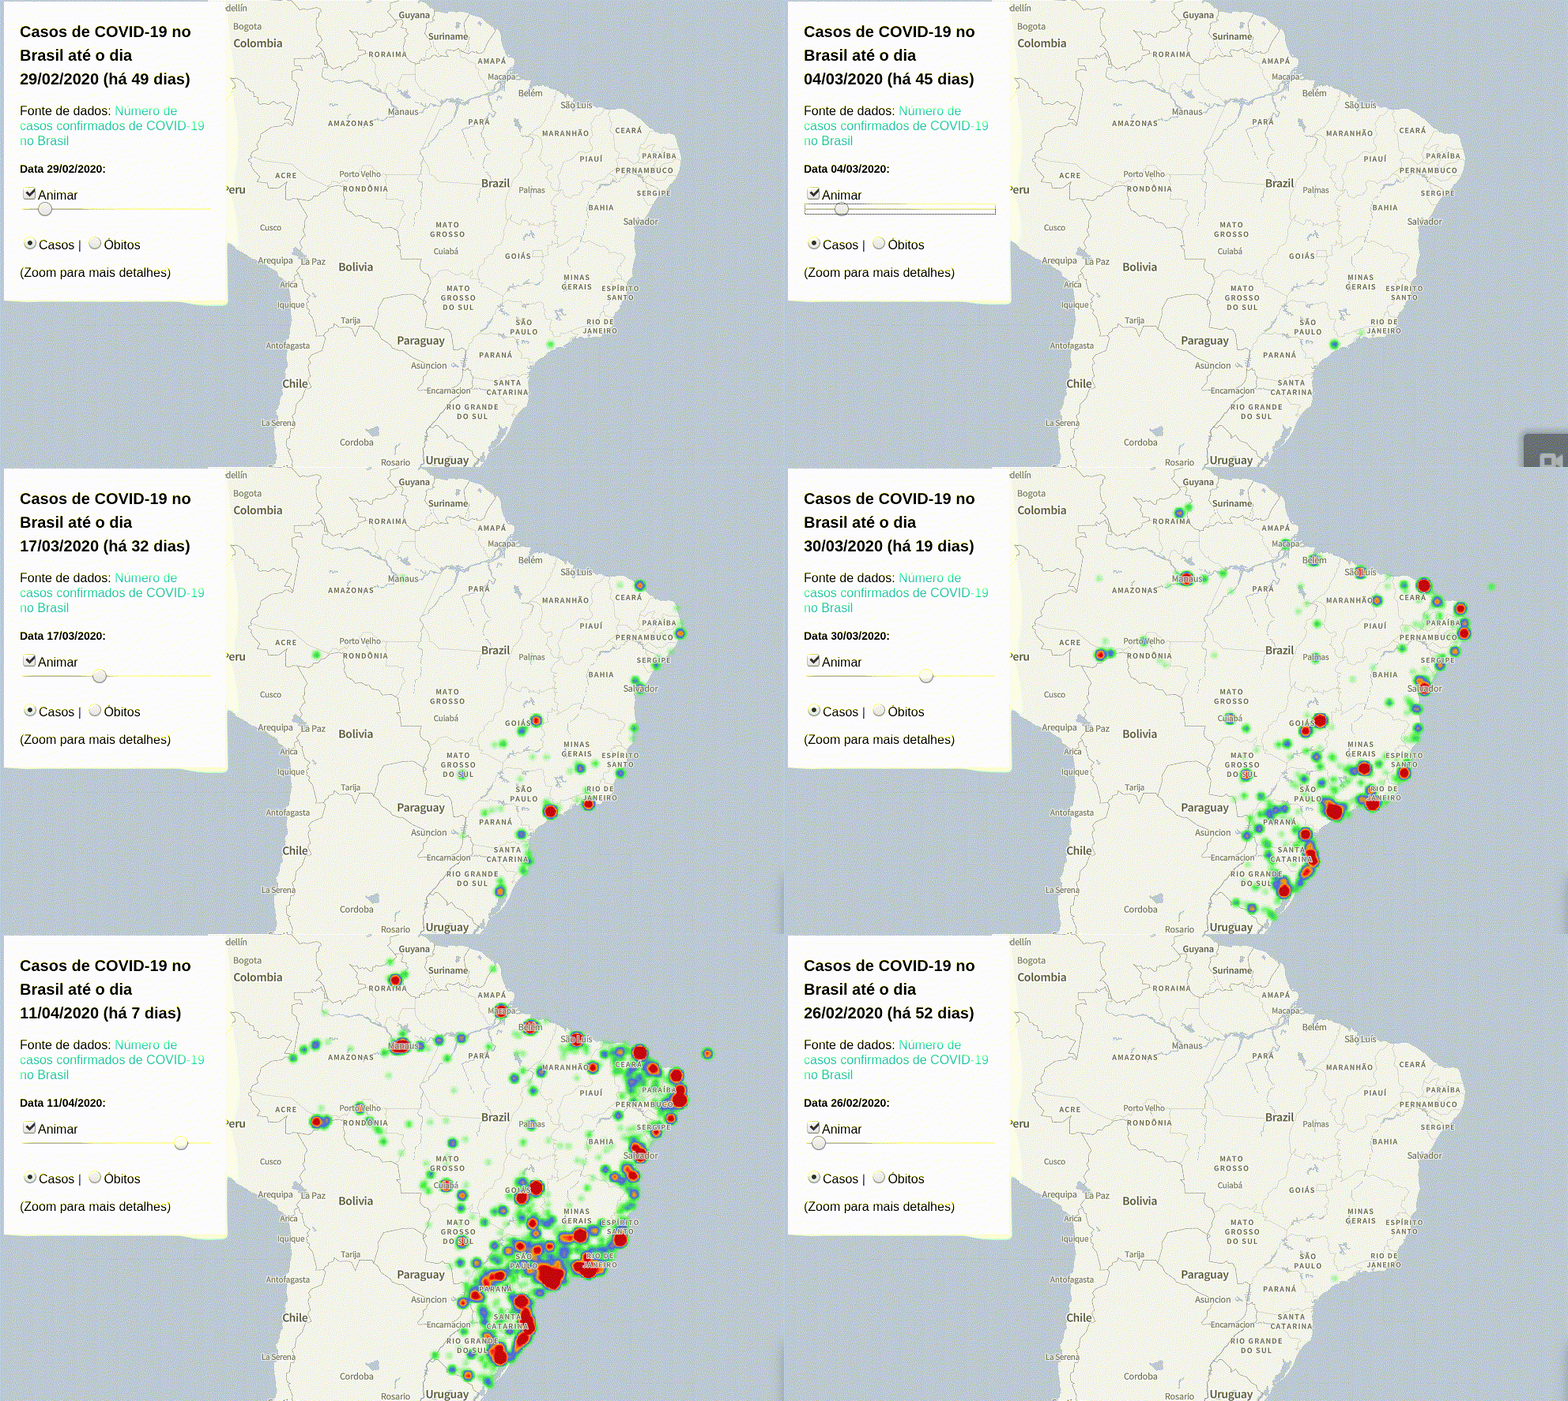
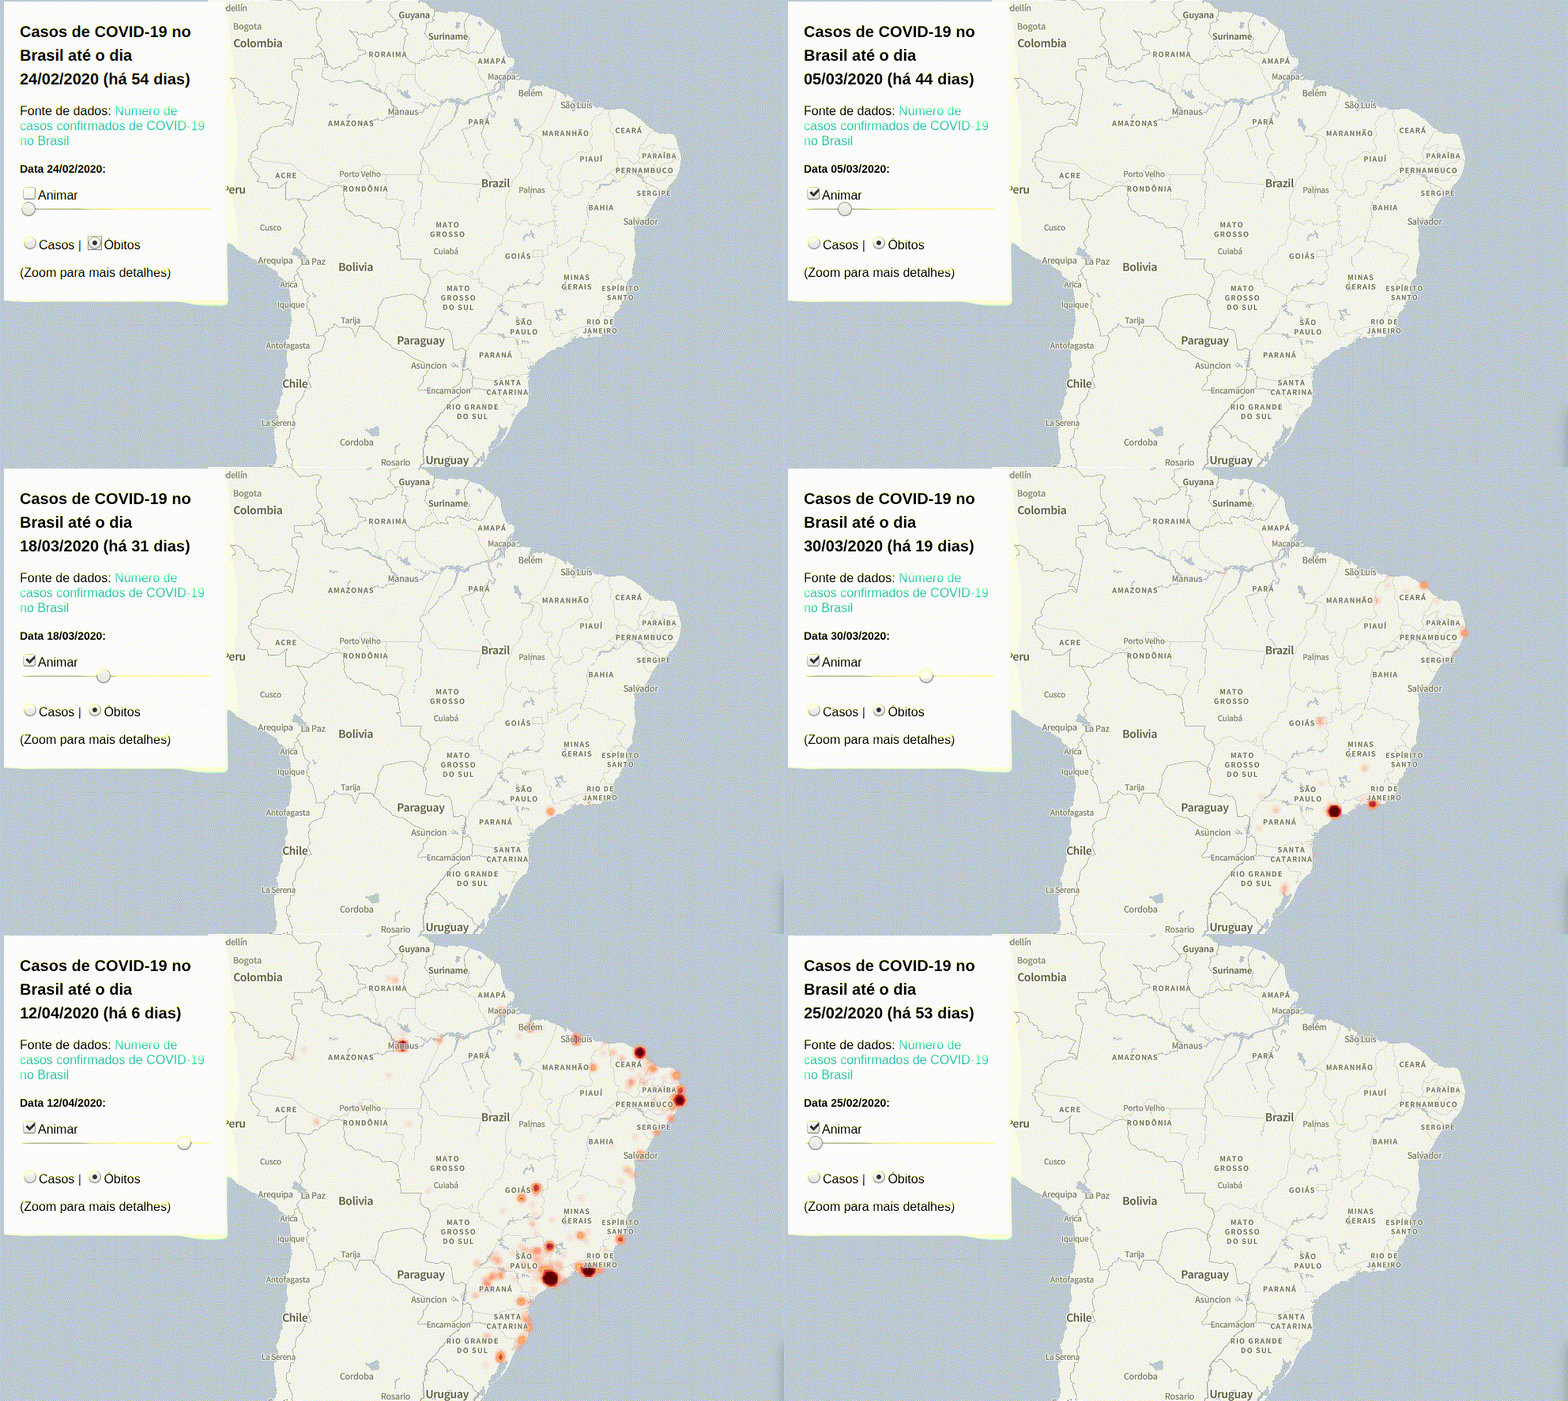
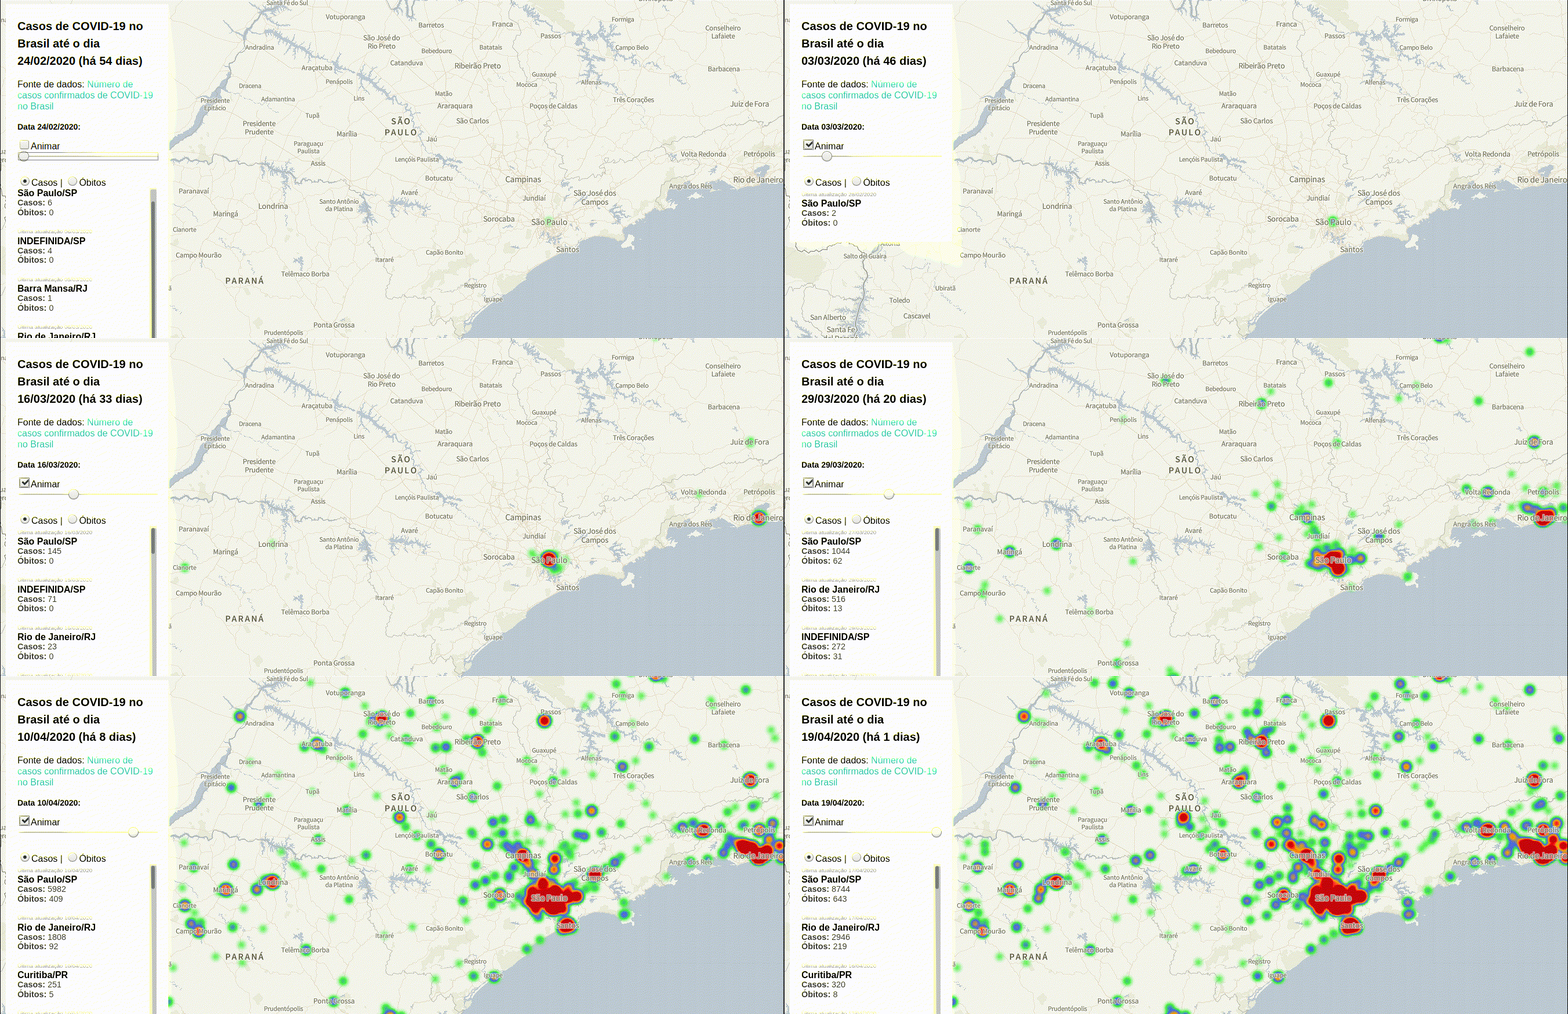
As new tools emerged and the amount of data to be rendered started crashing the page eventually, I stopped adding more data on the back-end. So this website may crash and the data isn't updated.
Using data from github.com/wcota/covid19br this project intends to visually show data about the COVID-19 in Brazil.
🌐 Website: https://alrestevam.github.io/covid19-br-vis-front/
Note: this is a personal project and I'm not a specialist either in data visualization or in disease spreading, so please take it with a grain of salt.
This front-end was developed using React.js and MapBox.
- Clone this repository.
- Be sure to have Node.js installed and yarn or npm (I'm using yarn for the examples).
- Enter the cloned repo.
cd covid19-br-vis-front- Change the file name
.env.sampleto.env, then open the file and complete the variablesREACT_APP_MAPBOX_ACCESS_TOKENis a token for using the map, you can get one at mapbox.REACT_APP_BACKEND_URLis the backend's url without the forward slash "/" at the end
- Run:
yarn # to install the repositories
yarn start # to start the development server
# the development server will be available at`localhost:3000`Currently this project's front-end is being hosted with gh-pages.
For making a new build and deploying it to github pages, run:
yarn deploy

