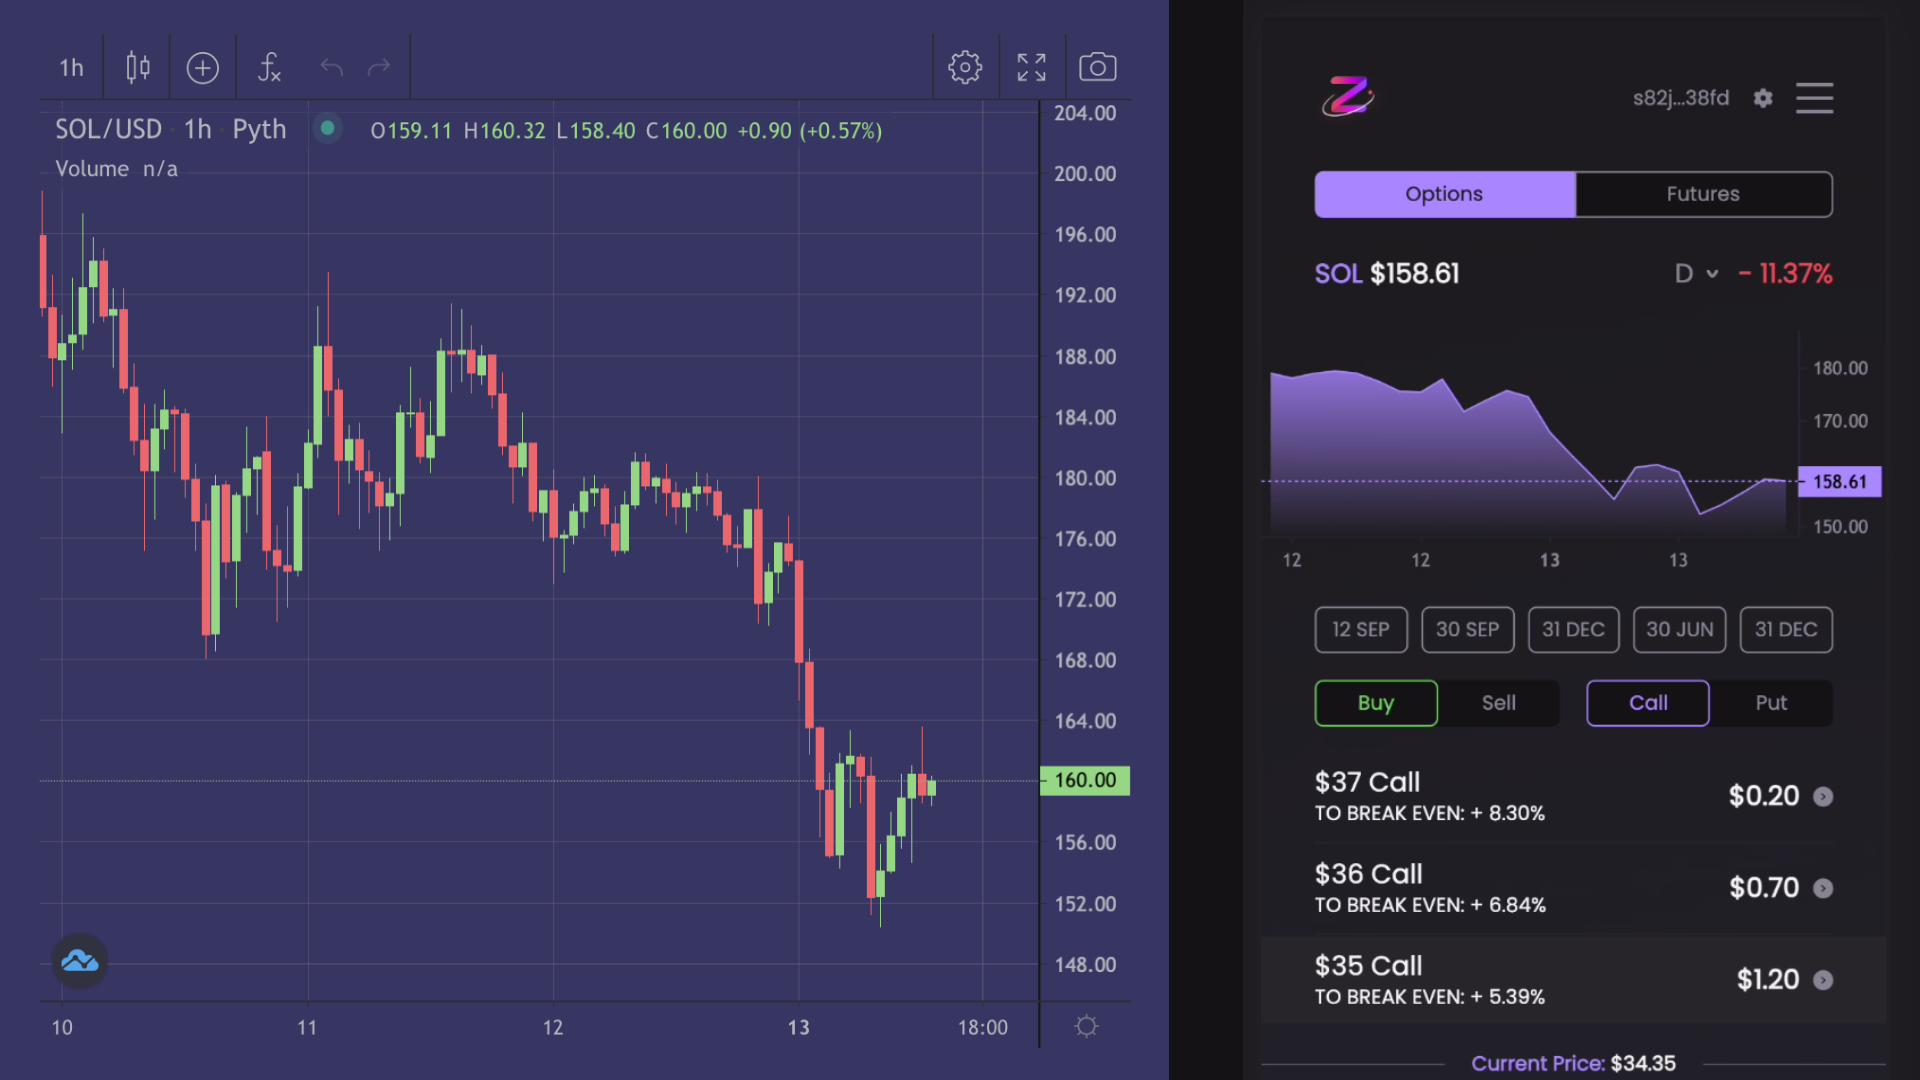
Collects and aggregates trades from Pyth Network for display in a TradingView chart. This is powering the charts on trade.zeta.markets. Feel free to improve and extend for the benefit for the larger Solana ecosystem.
Note: This does not include a functioning trading view to inspect the data.
Check the mango markets gui code for a reference how to use this API to display a TradingView.
-
pricefeeds: should be added to the dictionaries in src/index.ts -
All other configuration should be handled via environment variables. So far the following variables exist:
REDISCLOUD_URL: redis connection url (redis://<username>:<password>@<hostname>:<port>)
REDIS_MAX_CONN: maximum number of concurrent connections used by the redis pool
RPC_ENDPOINT_URL: solana rpc connection url
INTERVAL: time in seconds to wait between event queue polls
You can set these via a .env file in the root directory.
For the sake of optimisations in data fetching and aggregation, I've used the Redis Timeseries module. Therefore when setting up your Redis DB, you must add the Timeseries module for it to work.
To run on a docker container:
docker build -t zeta-pyth-history:latest .
docker run --rm --env-file=.env zeta-pyth-history
Many thanks to the Mango Markets team (mango.markets) whose original repo Serum History served as the foundation for this code.
👋 Reach out to the respective teams on Discord:
