Microsoft Sentinel
Implement Microsoft Sentinel
Duration: 30 minutes
Introduction: In this exercise, you will learn how to implement Microsoft Sentinel, a cloud-native Security Information and Event Management (SIEM) solution provided by Microsoft. You will perform various tasks, including on-boarding Microsoft Sentinel, connecting Azure Activity to Sentinel, creating rules, playbooks, and custom alerts, and reviewing associated actions.
Task 1: On-board Microsoft Sentinel
-
Sign in to the Azure portal
https://portal.azure.comusing an account that has the Owner or Contributor role in the Azure subscription. -
In the Azure portal, search for "Microsoft Sentinel" in the Search resources, services, and docs text box.
-
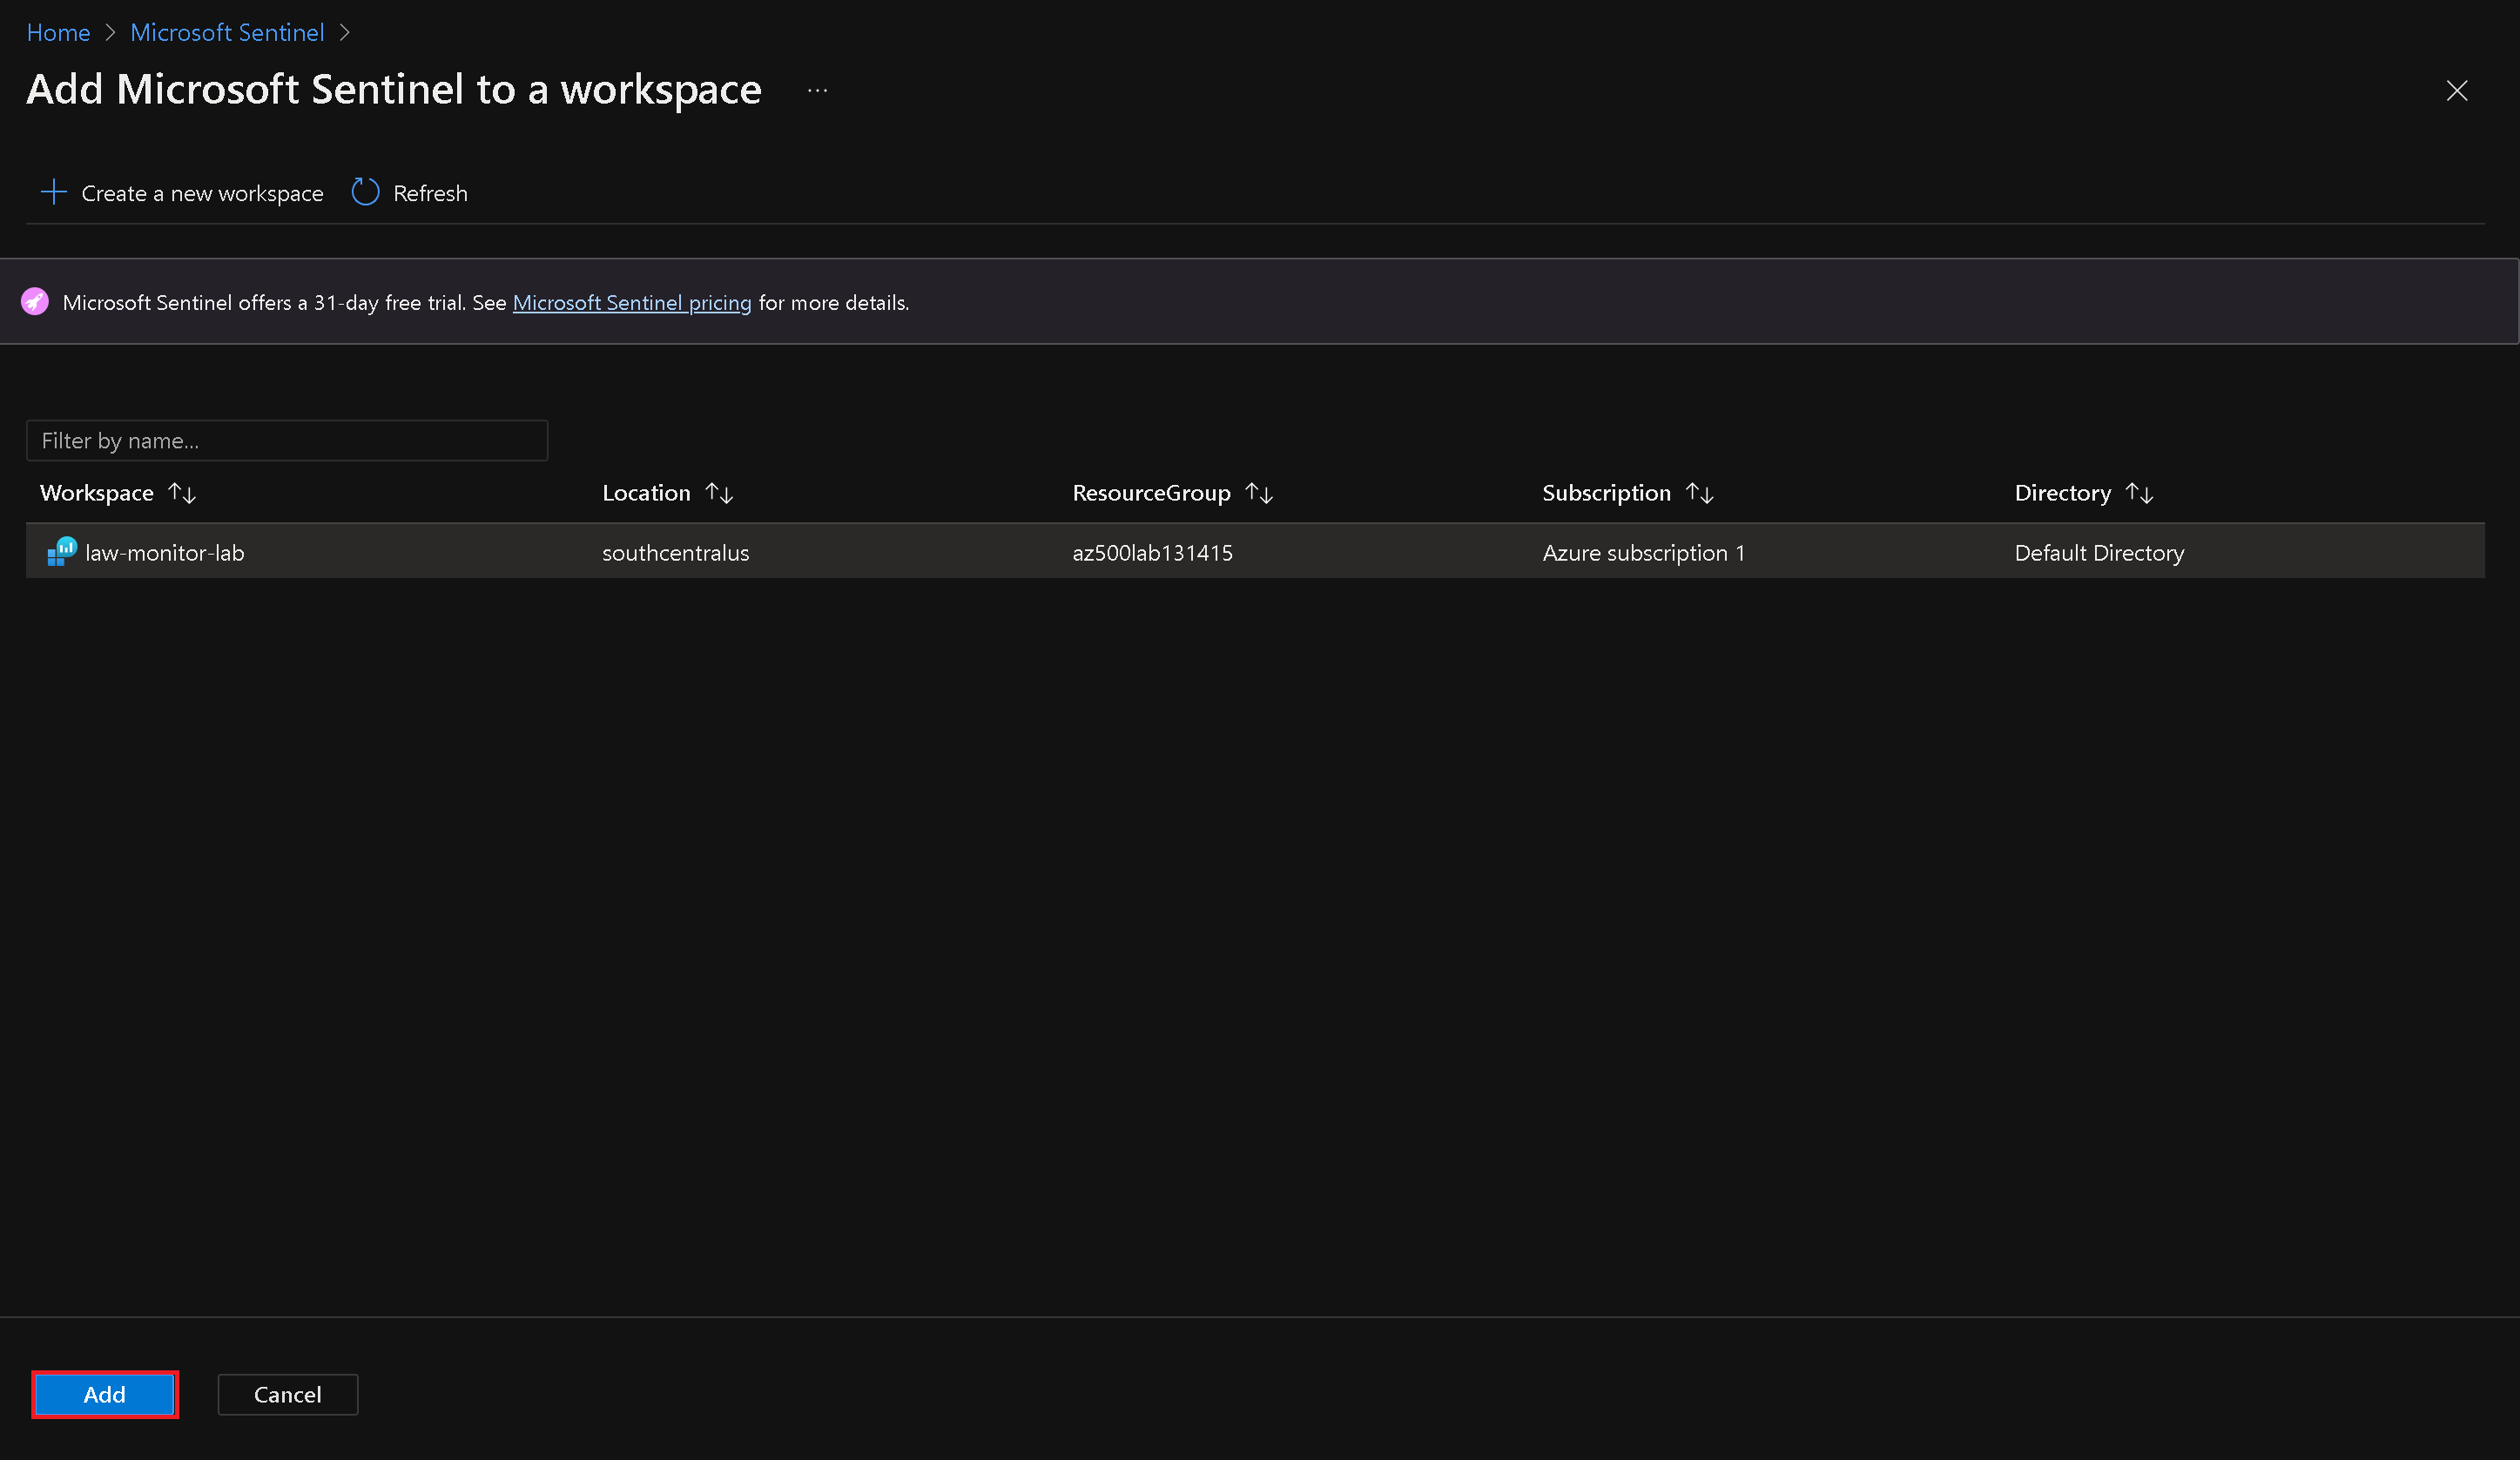
On the Microsoft Sentinel blade, click "+ Create" to start the on-boarding process.
-
On the "Add Microsoft Sentinel to a workspace" blade, select the Log Analytics workspace you created in the Azure Monitor lab and click "Add".
Task 2: Connect Azure Activity to Sentinel
-
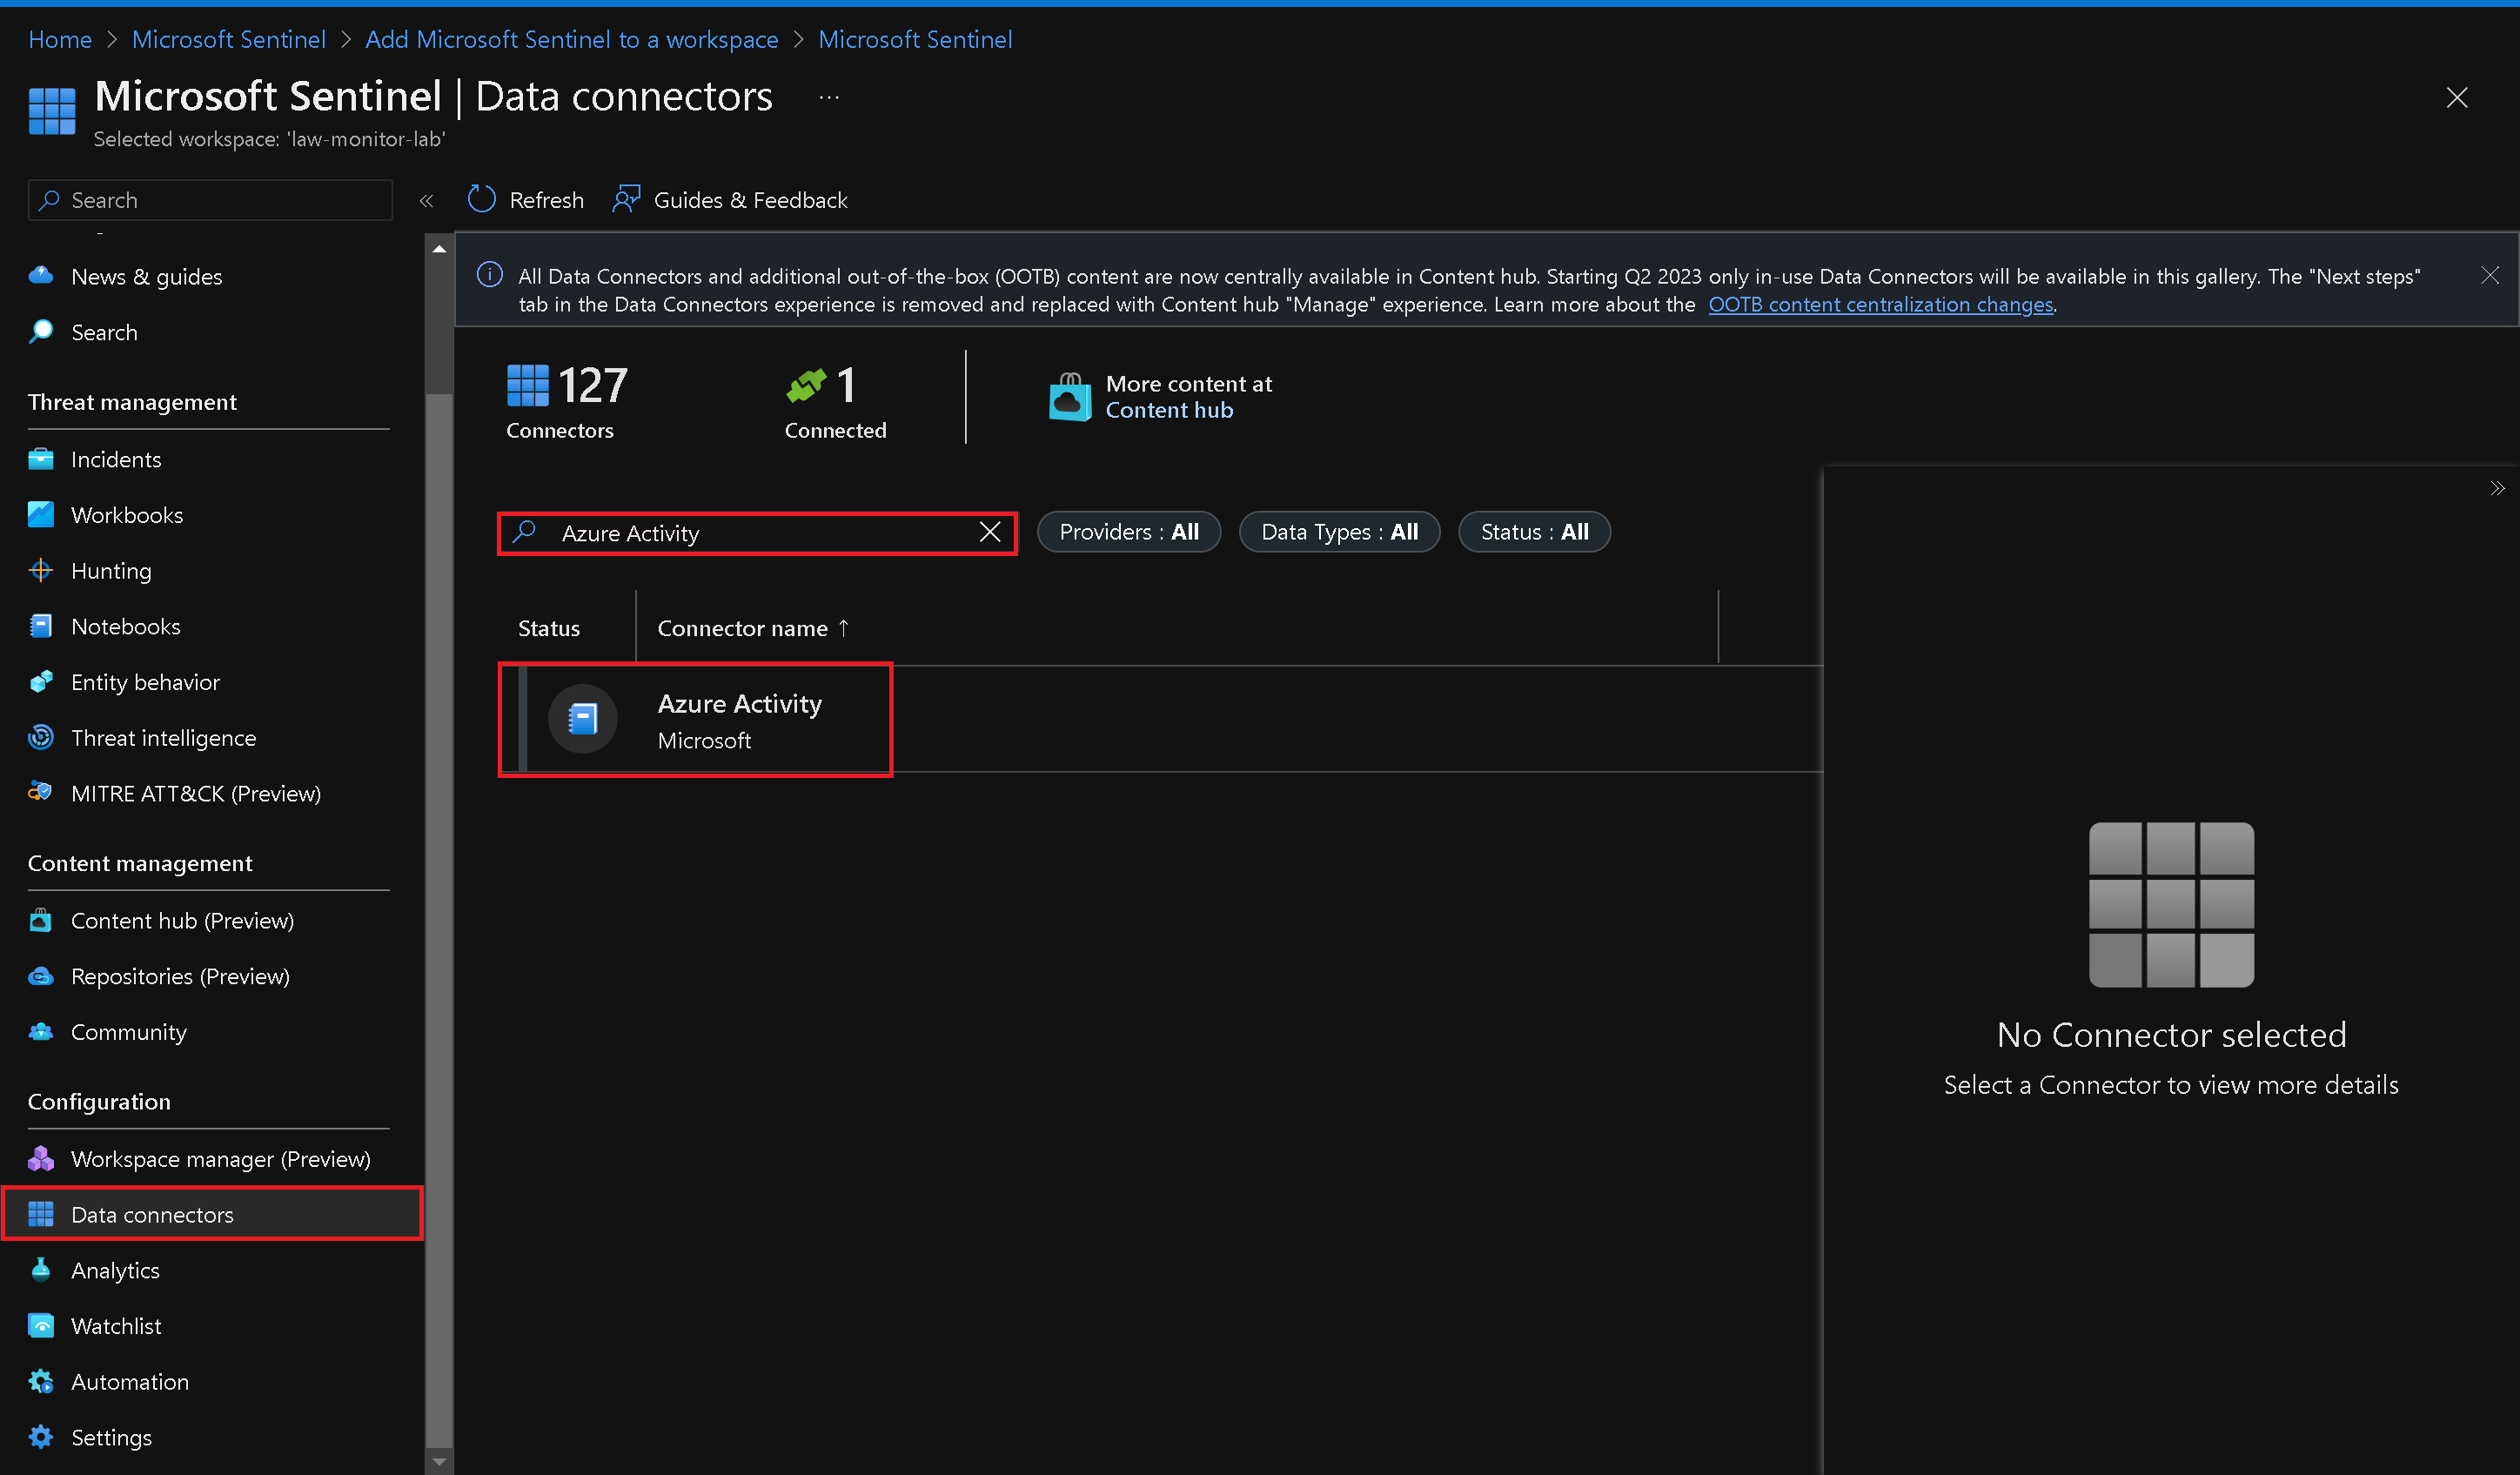
On the Microsoft Sentinel blade, go to the Configuration section and click "Data connectors".
-
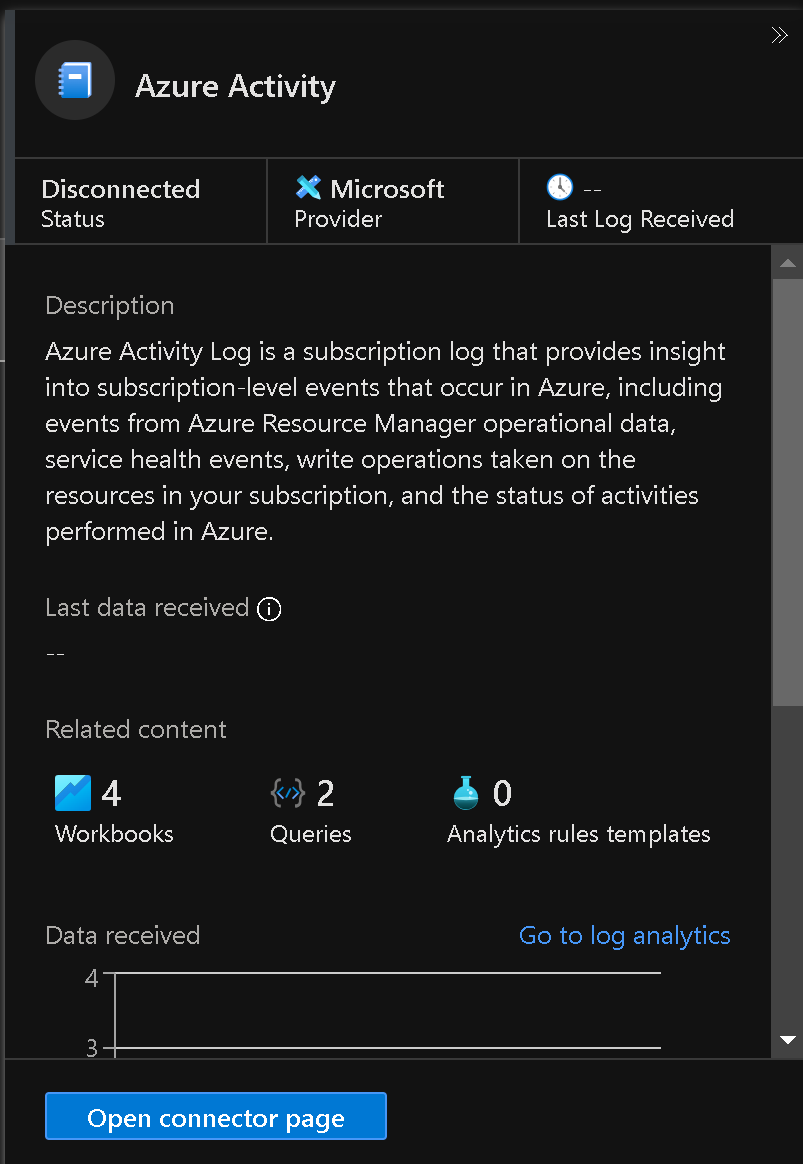
On the Data connectors blade, search for "Azure" and select the Azure Activity data connector.
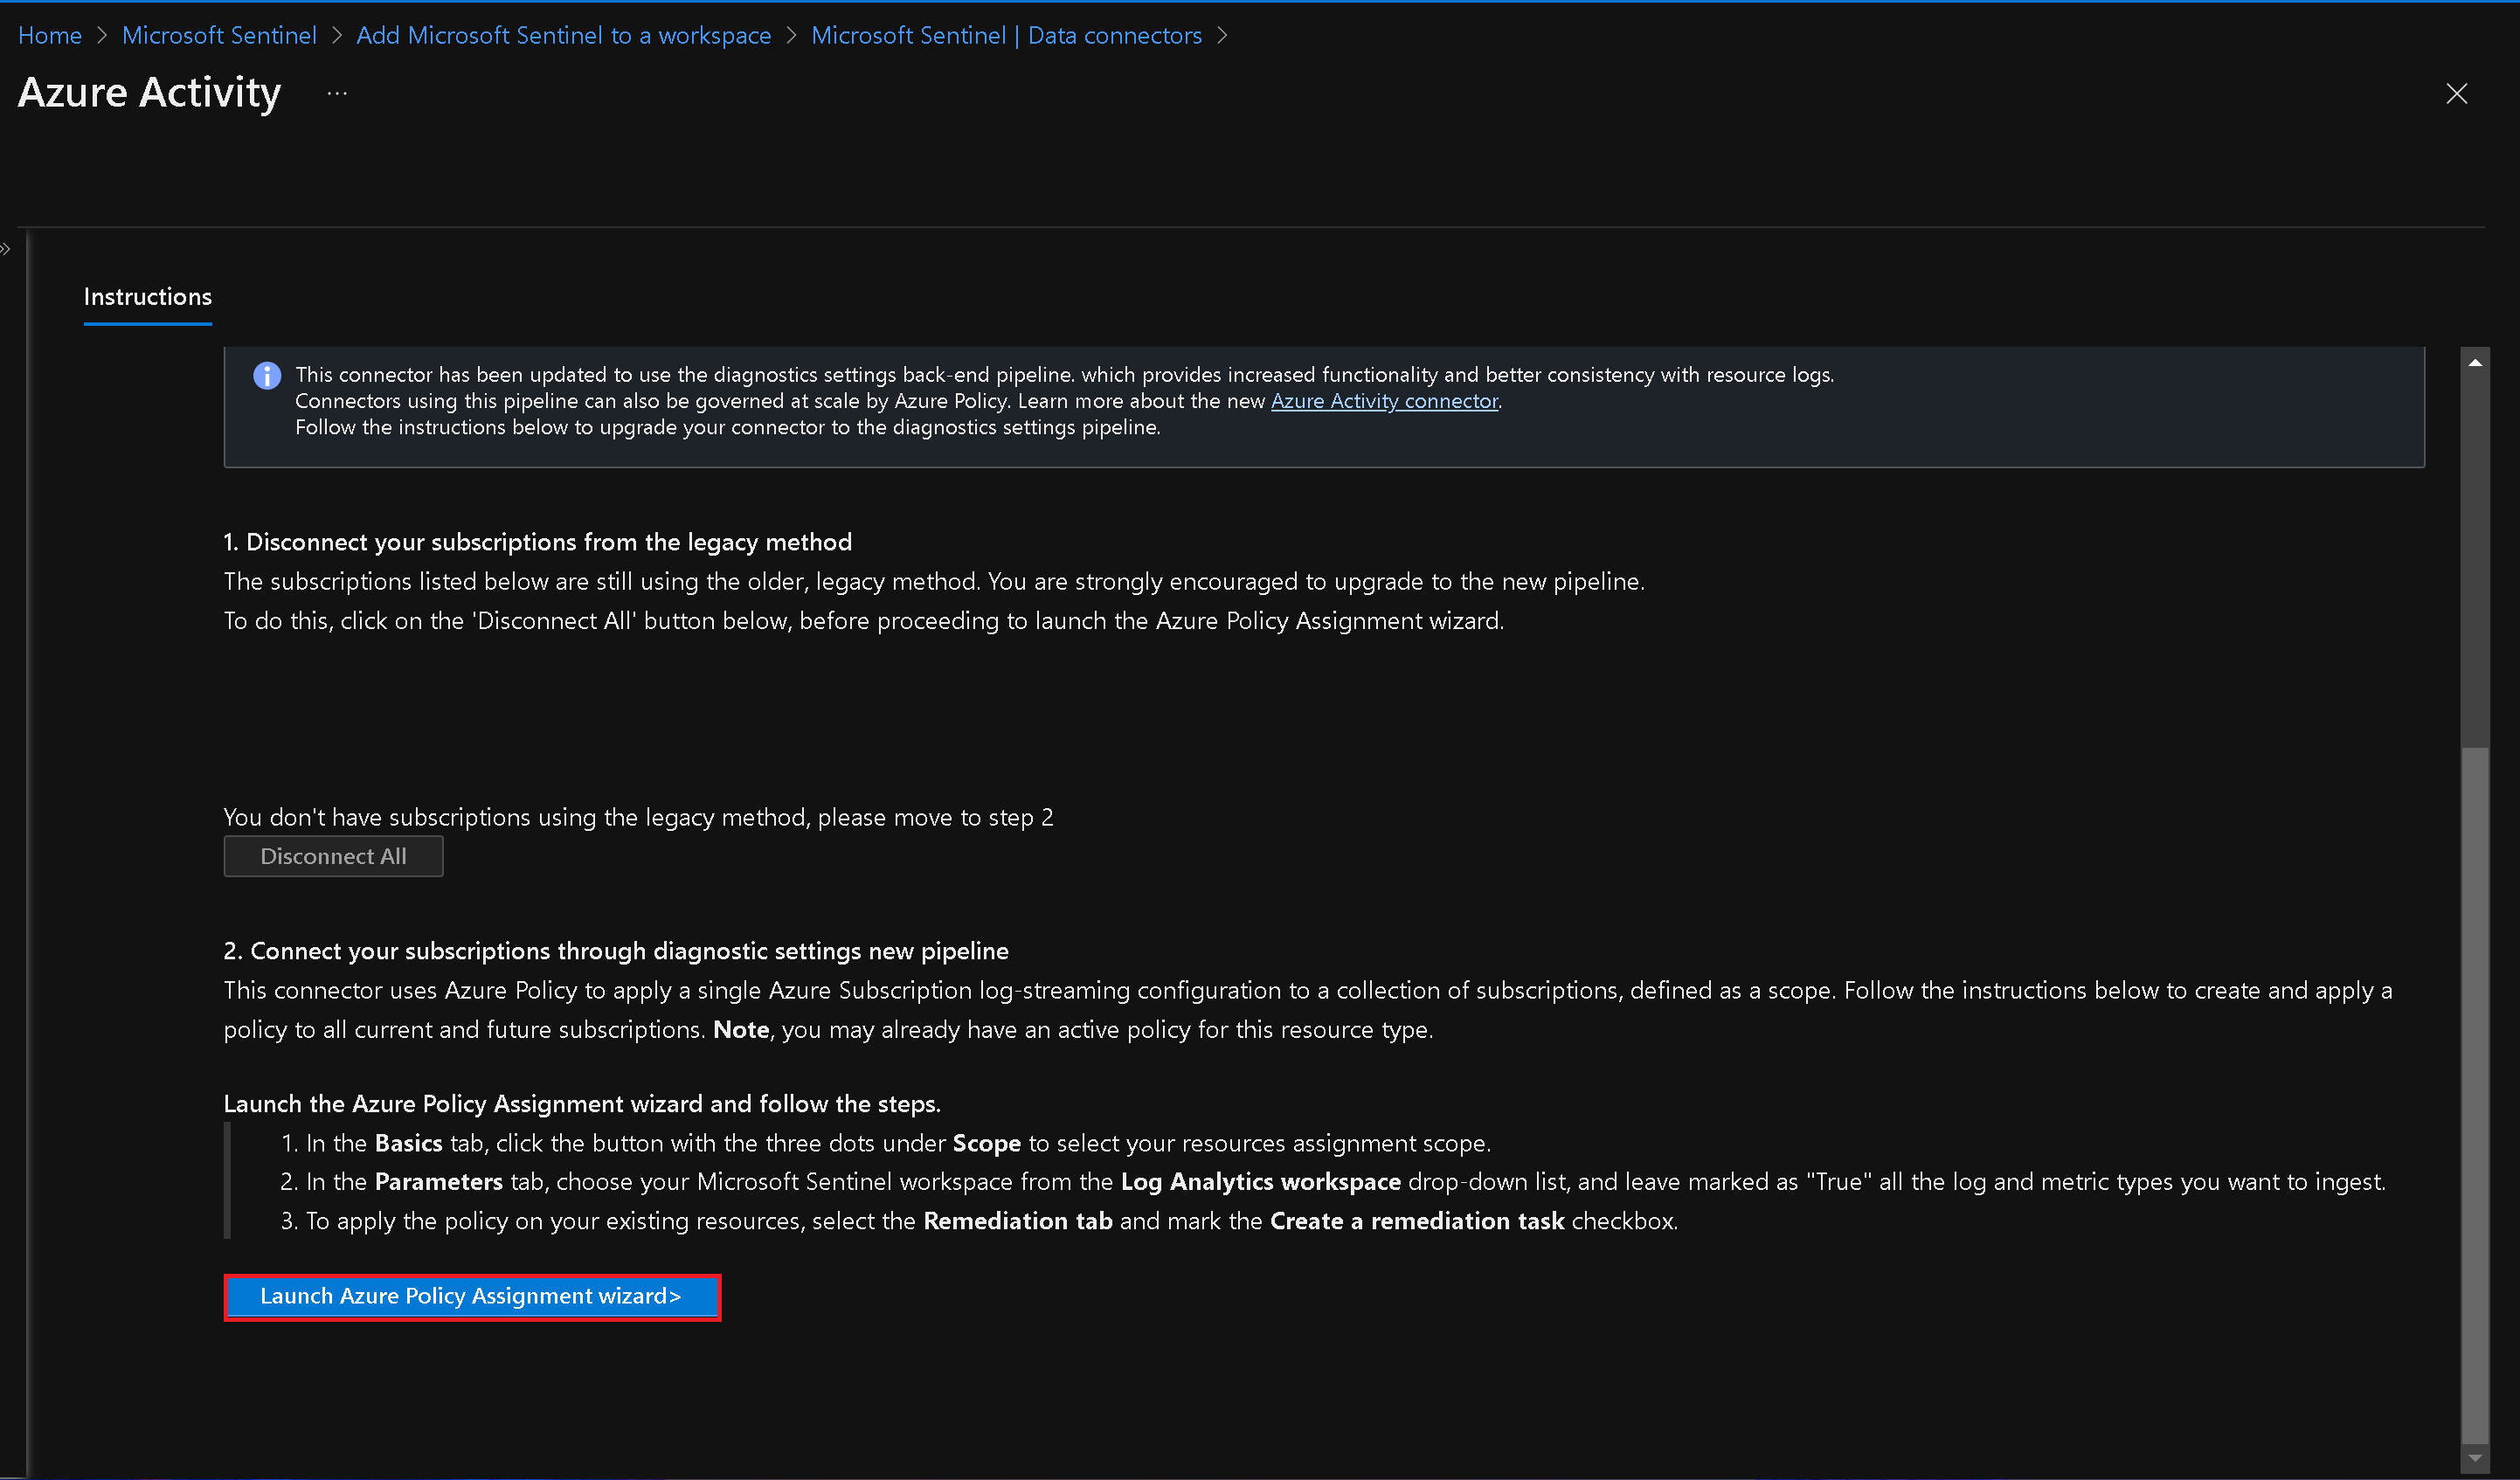
- On the Azure Activity blade, follow the instructions to configure the connector. This includes connecting your subscriptions through diagnostic settings using the Azure Policy Assignment wizard.
Launch Policy Assignment Wizard
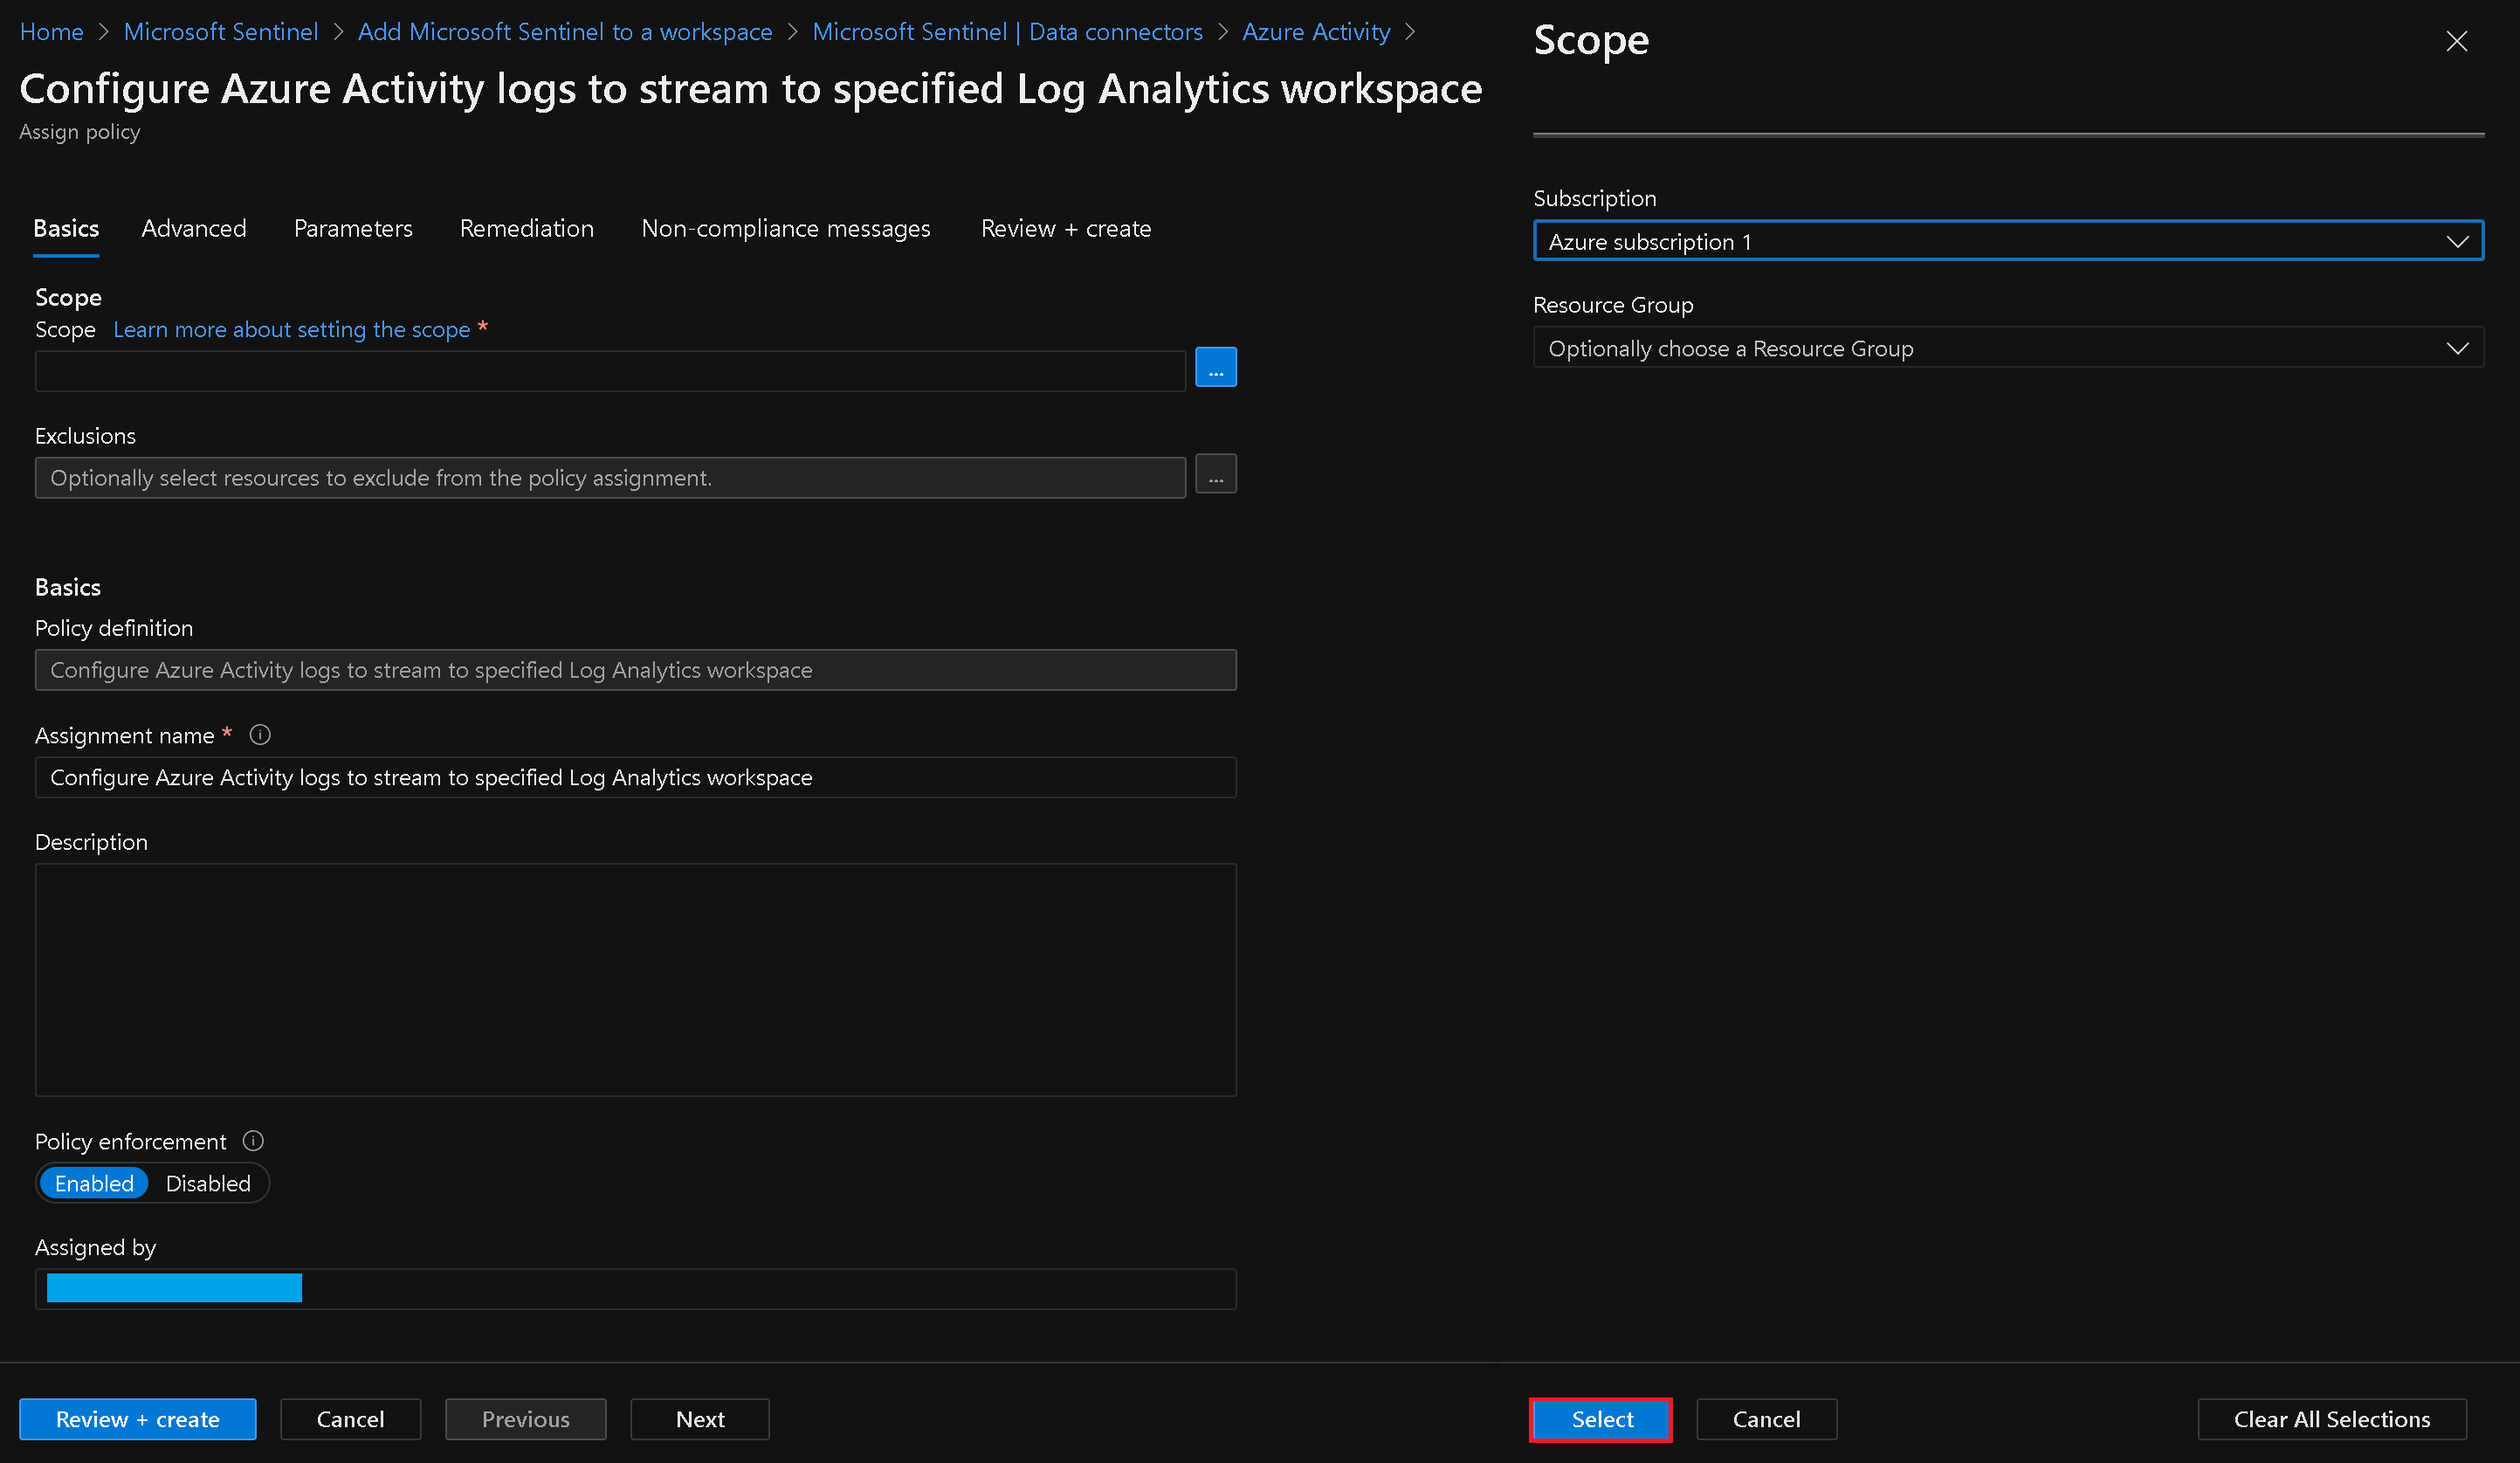
Note: Do not choose a Resource Group
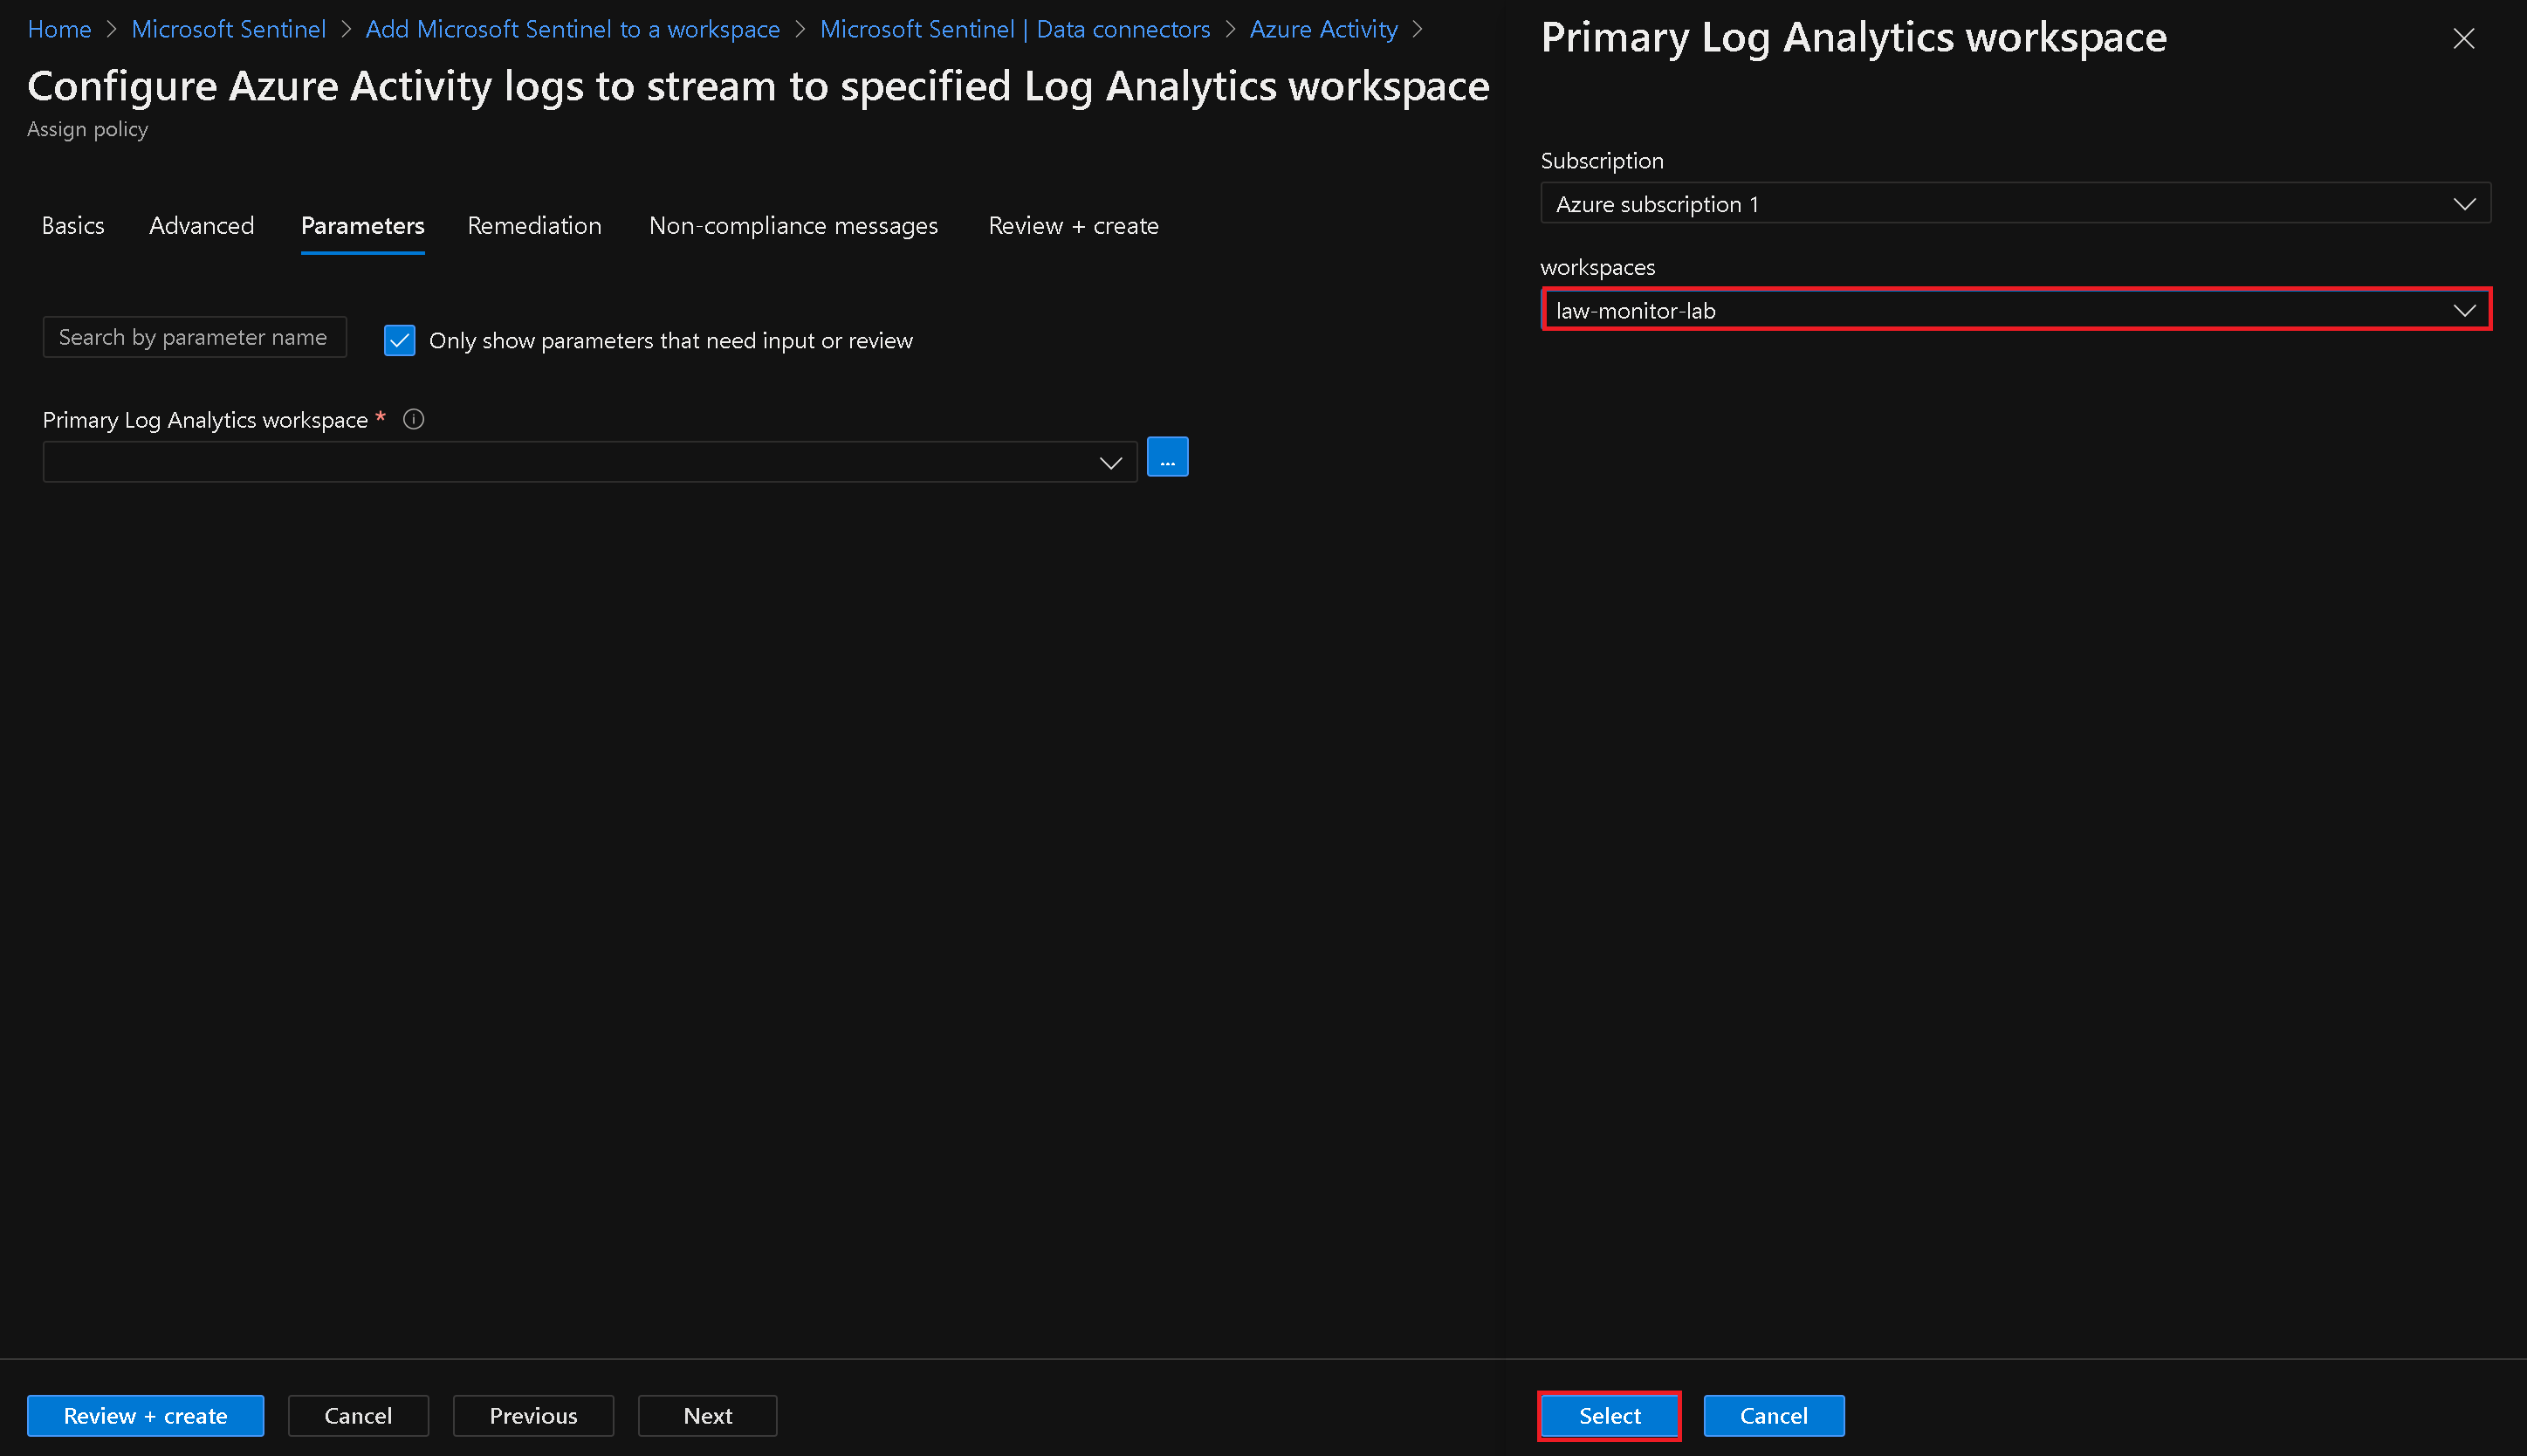
Select Workspace for Azure Activity Policy
Create a Remediation Task
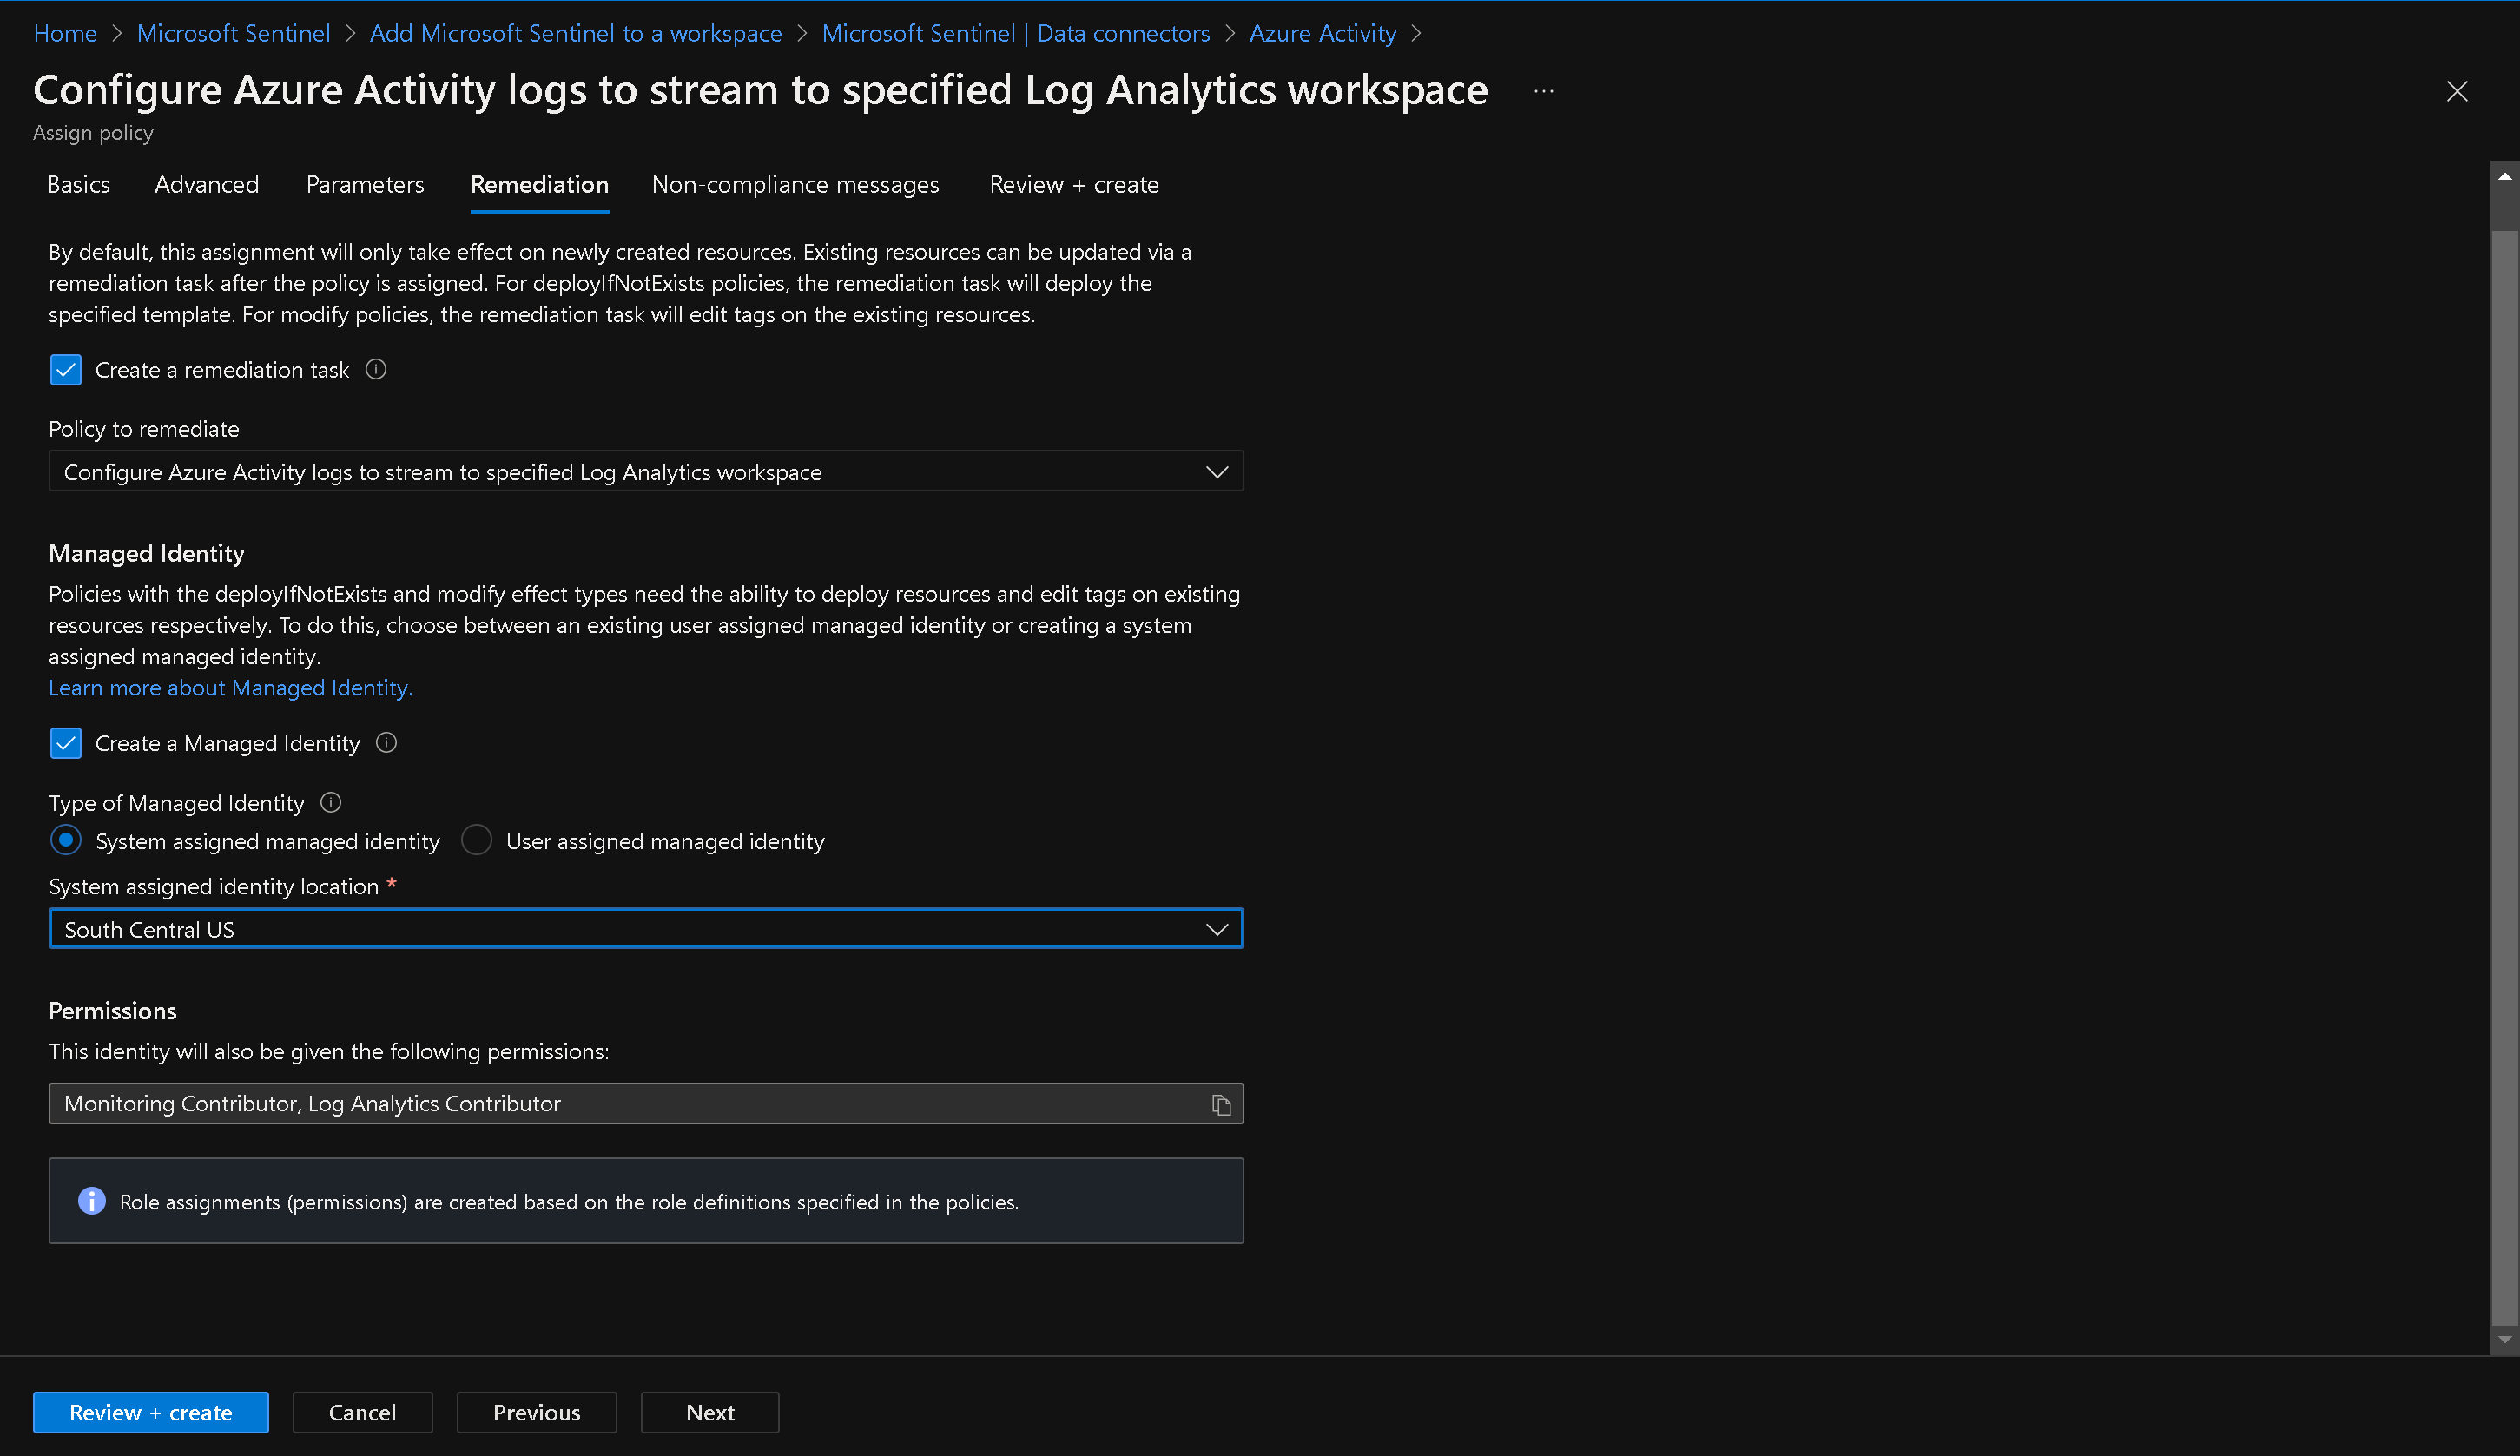
Click the Next button at the bottom of the Remediation tab to proceed to the Non-compliance message tab. Enter a Non-compliance message if you wish (this is optional) and click the Review + Create button at the bottom of the Non-compliance message tab.
Click the Create button. You should observe three succeeded status messages: Creating policy assignment succeeded, Role Assignments creation succeeded, and Remediation task creation succeeded.
- Review and confirm the successful configuration of the Azure Activity data connector.
Note: You can check the Notifications, bell icon to verify the three successful tasks.
Note: It may take over 15 minutes before the Status shows “Connected” and the graph displays Data received.
Task 3: Create a rule that uses the Azure Activity data connector
-
On the Microsoft Sentinel Configuration blade, click "Analytics".
-
On the Analytics blade, switch to the "Rule templates" tab.
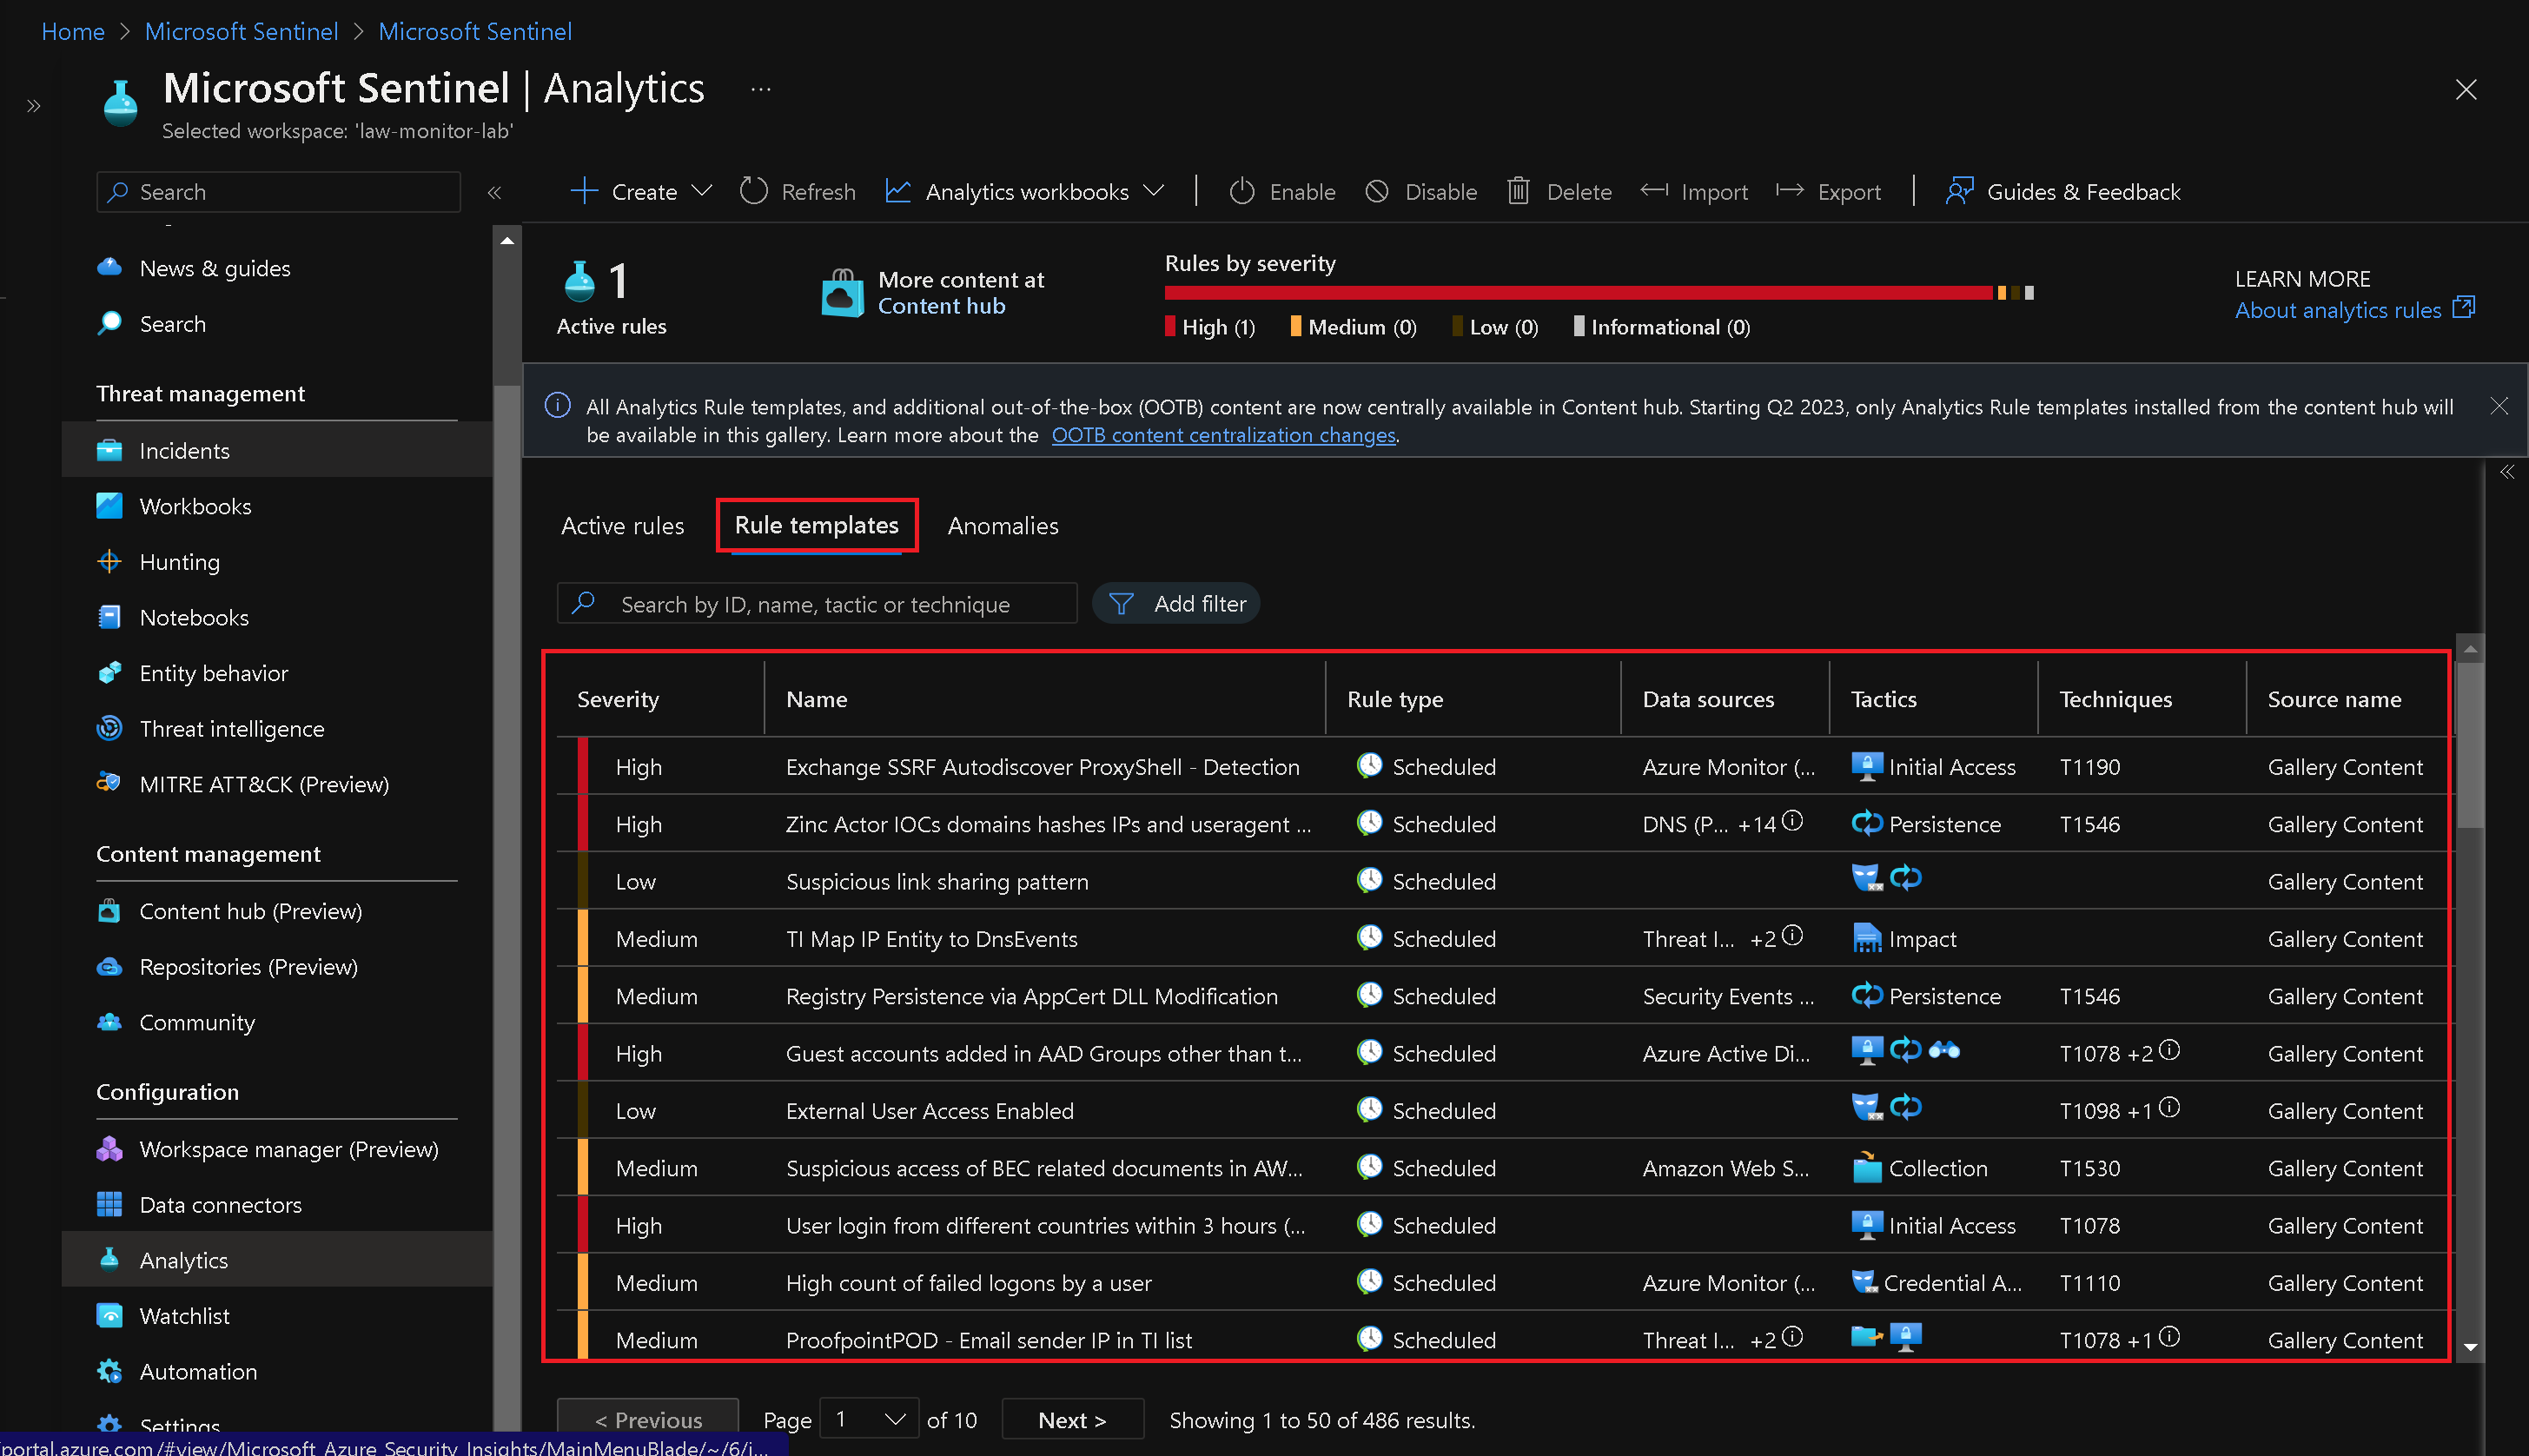
Note: Review the types of rules you can create. Each rule is associated with a specific Data Source.
-
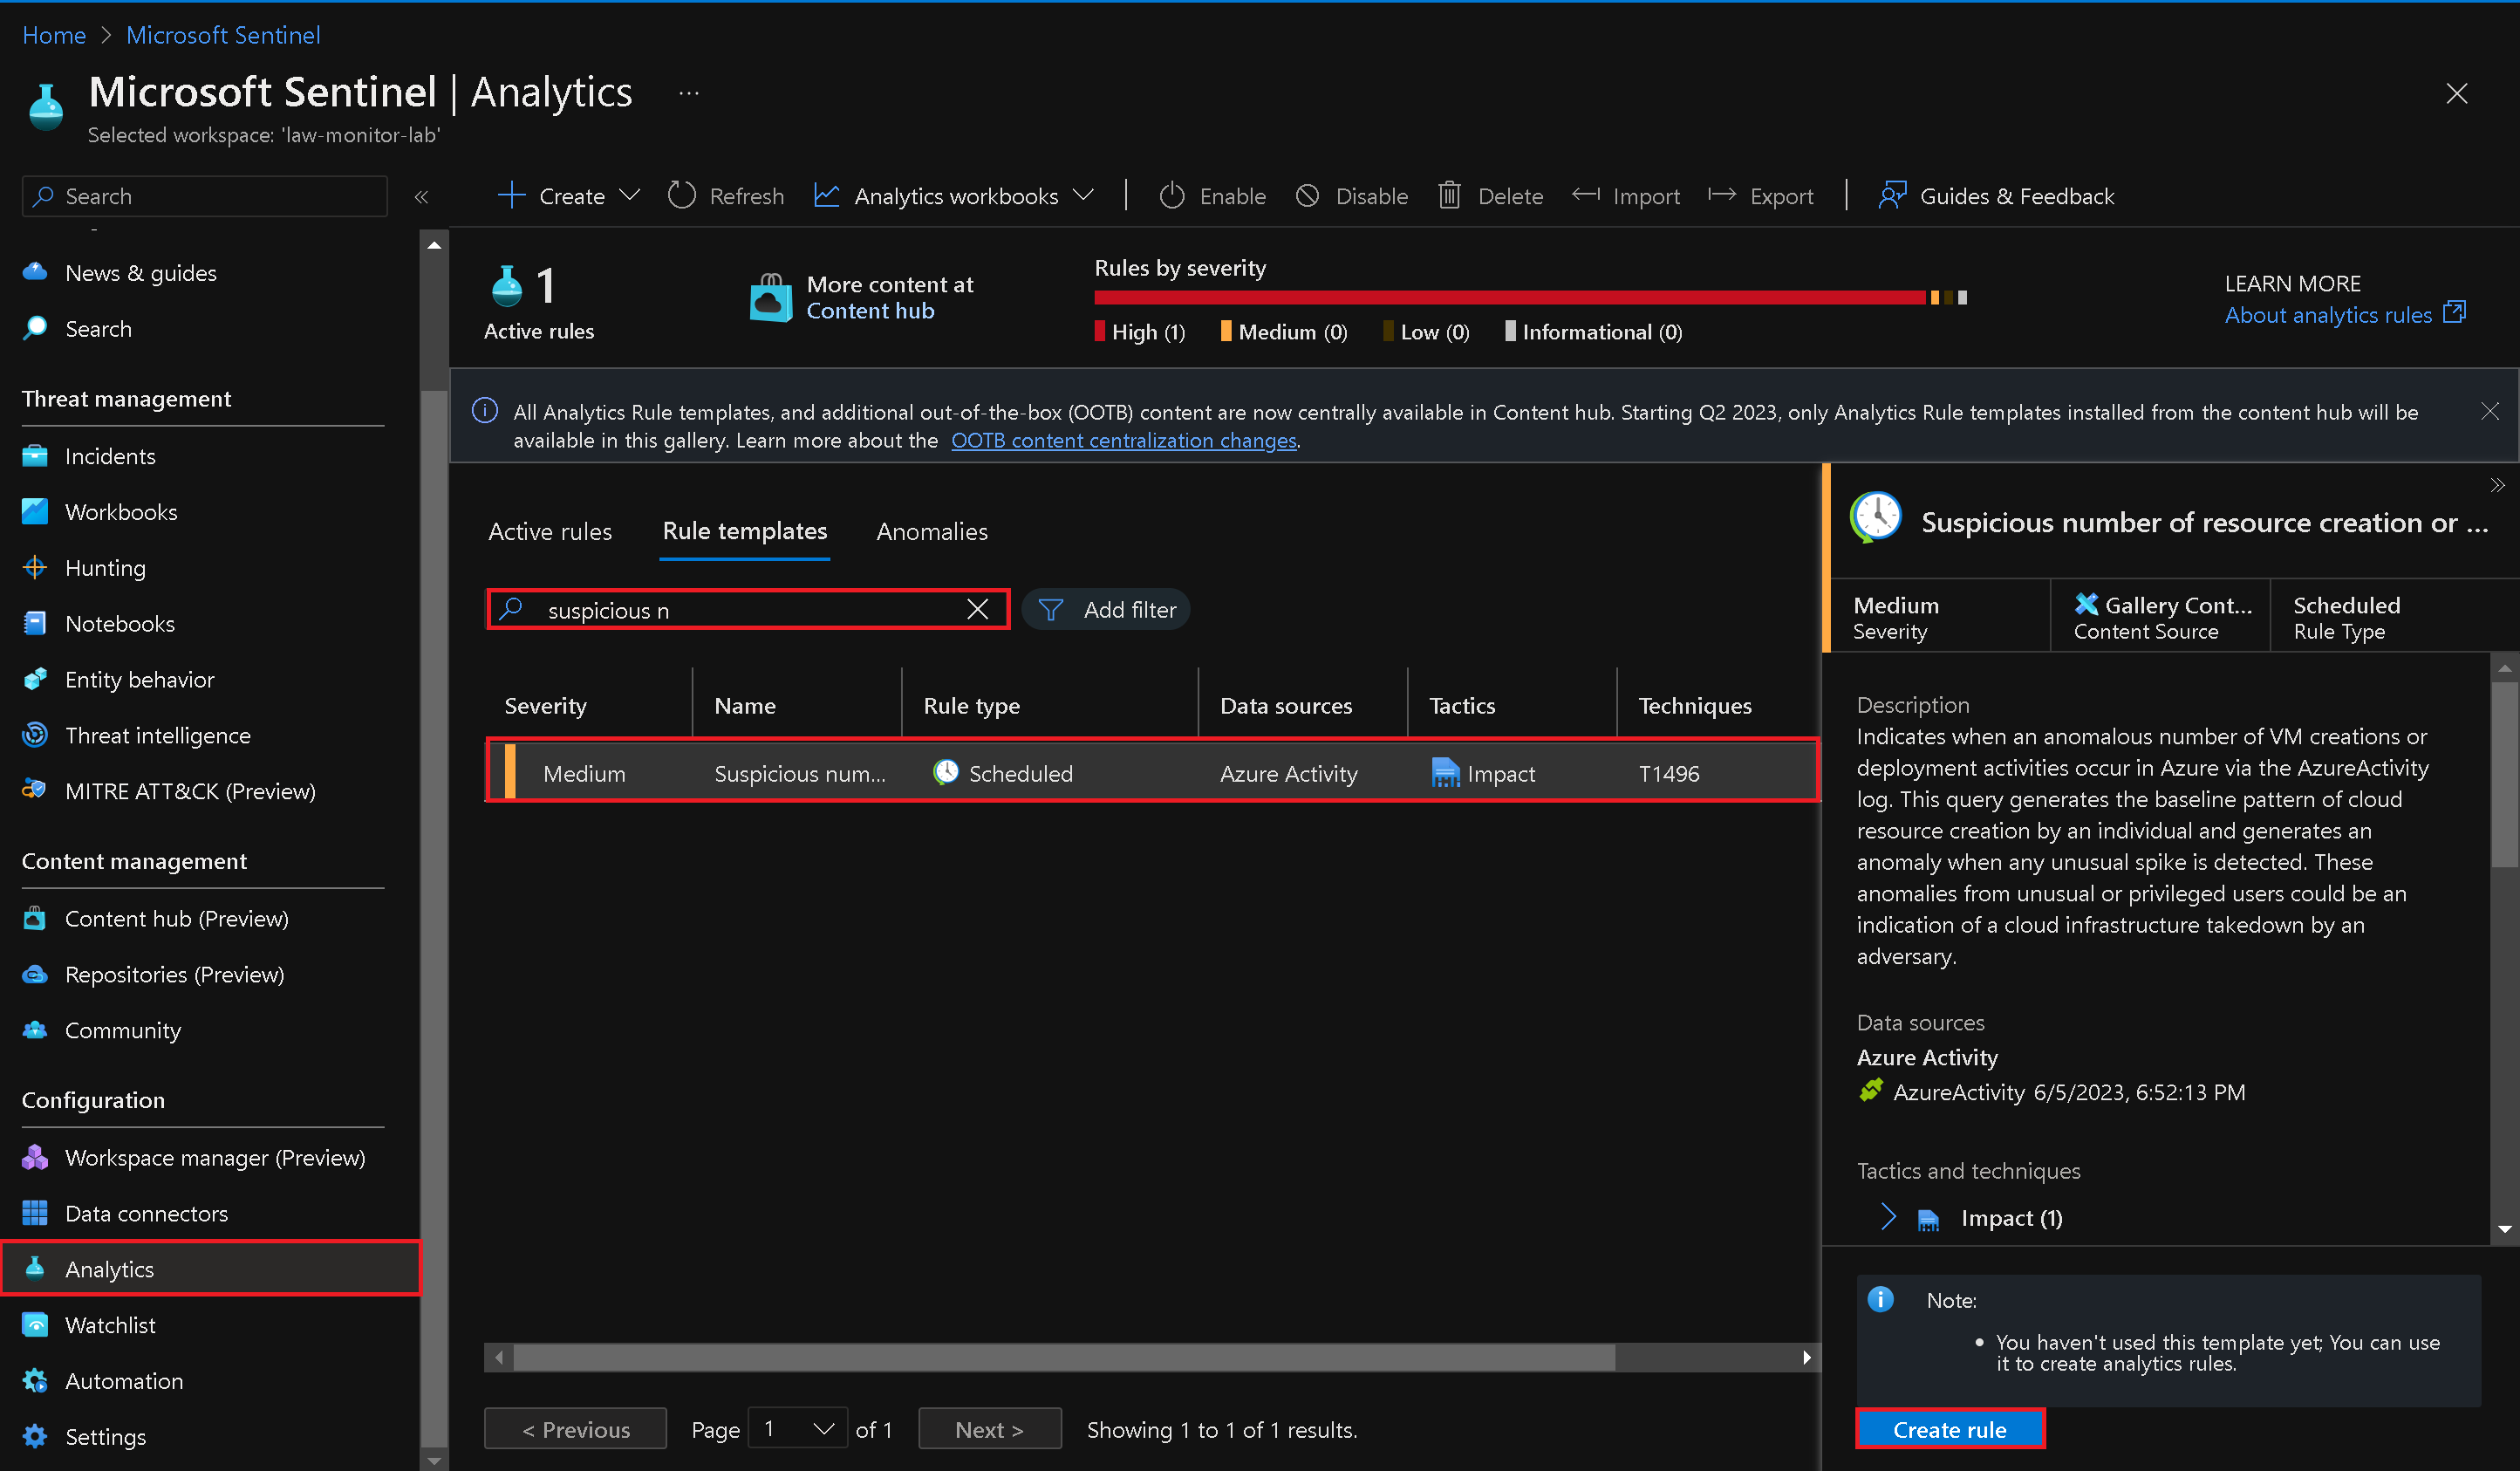
Search for "Suspicious" and select the rule template associated with the Azure Activity data source for suspicious resource creation or deployment.
-
Click "Create rule" to start creating the rule from the template.
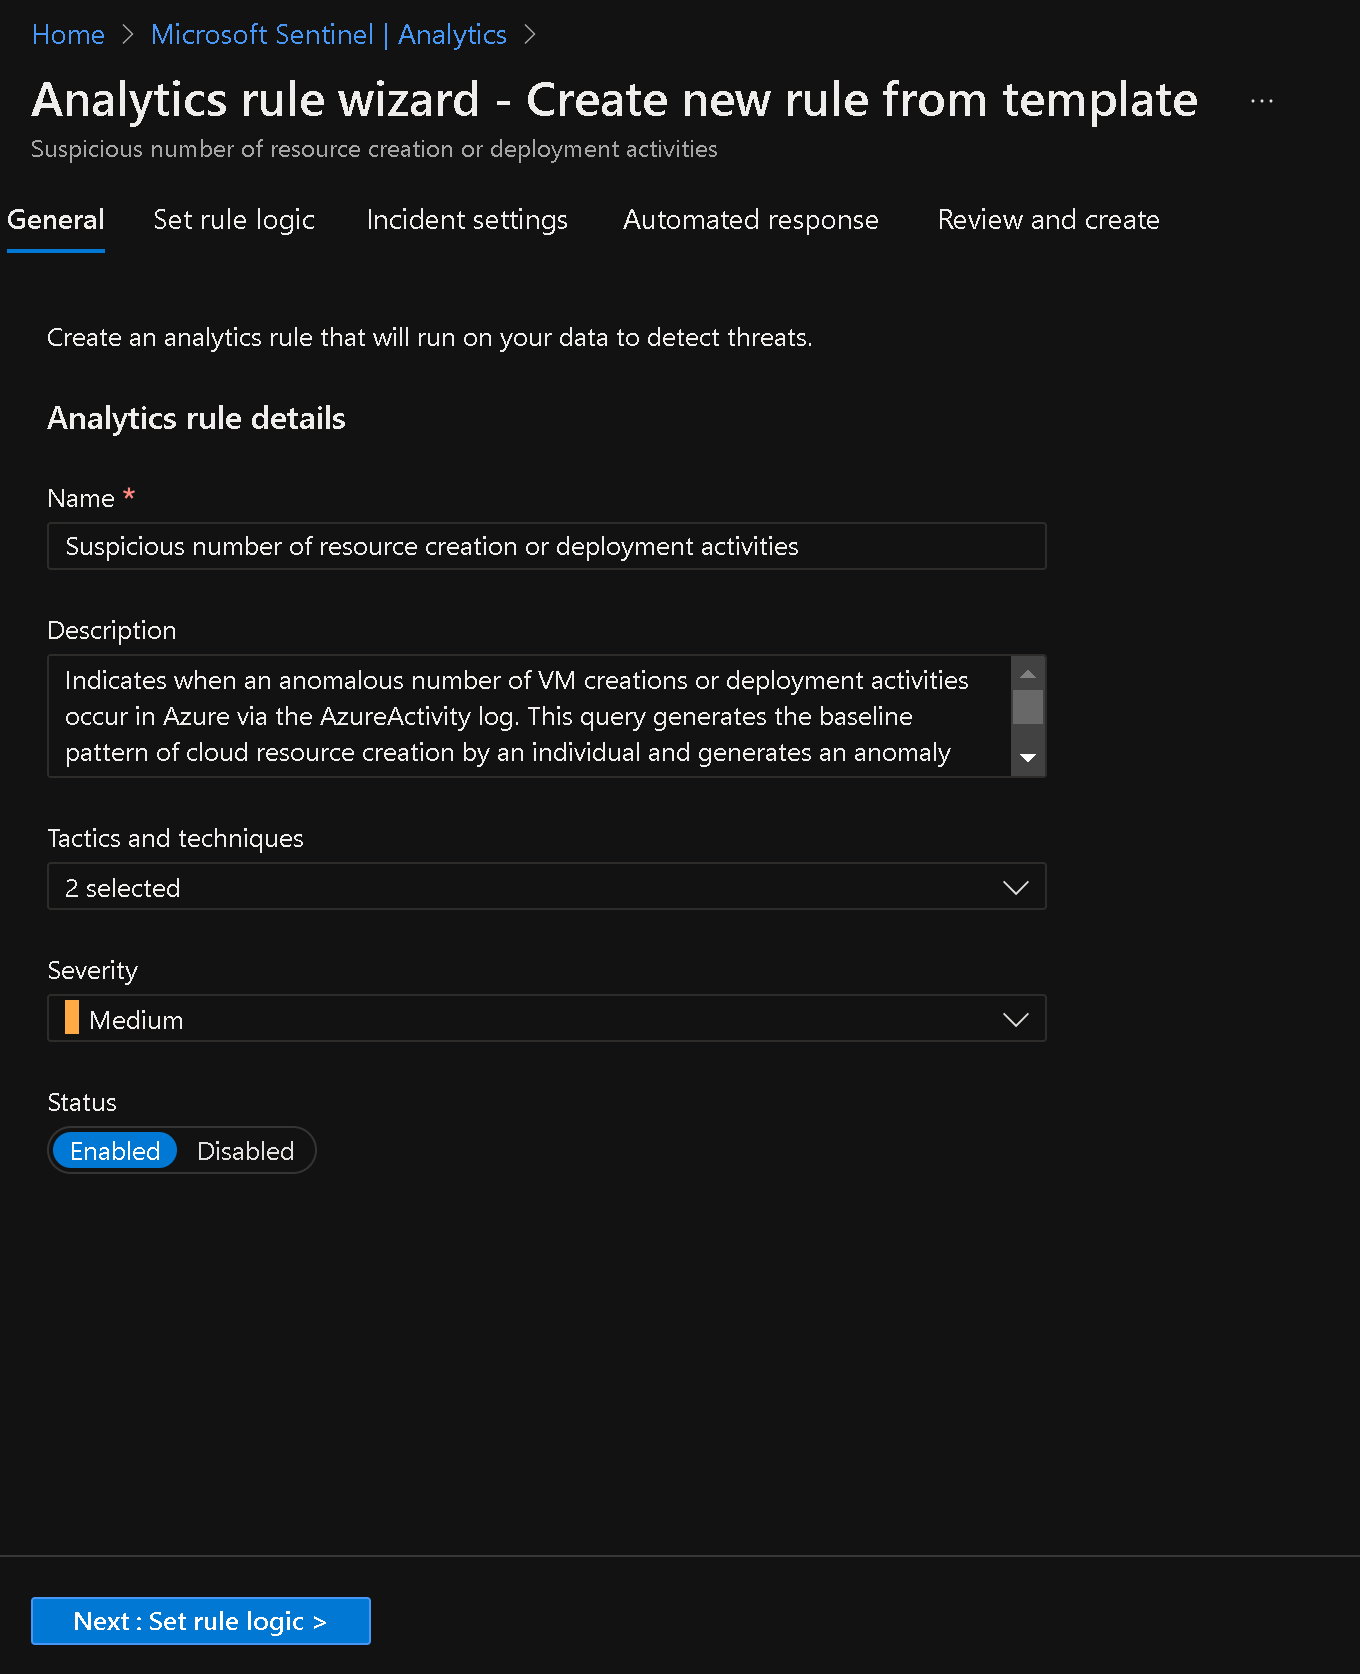
- Configure the rule settings on the General, Set rule logic, Incident settings, and Automated response tabs as per the default settings.
Rule Logic Defaults
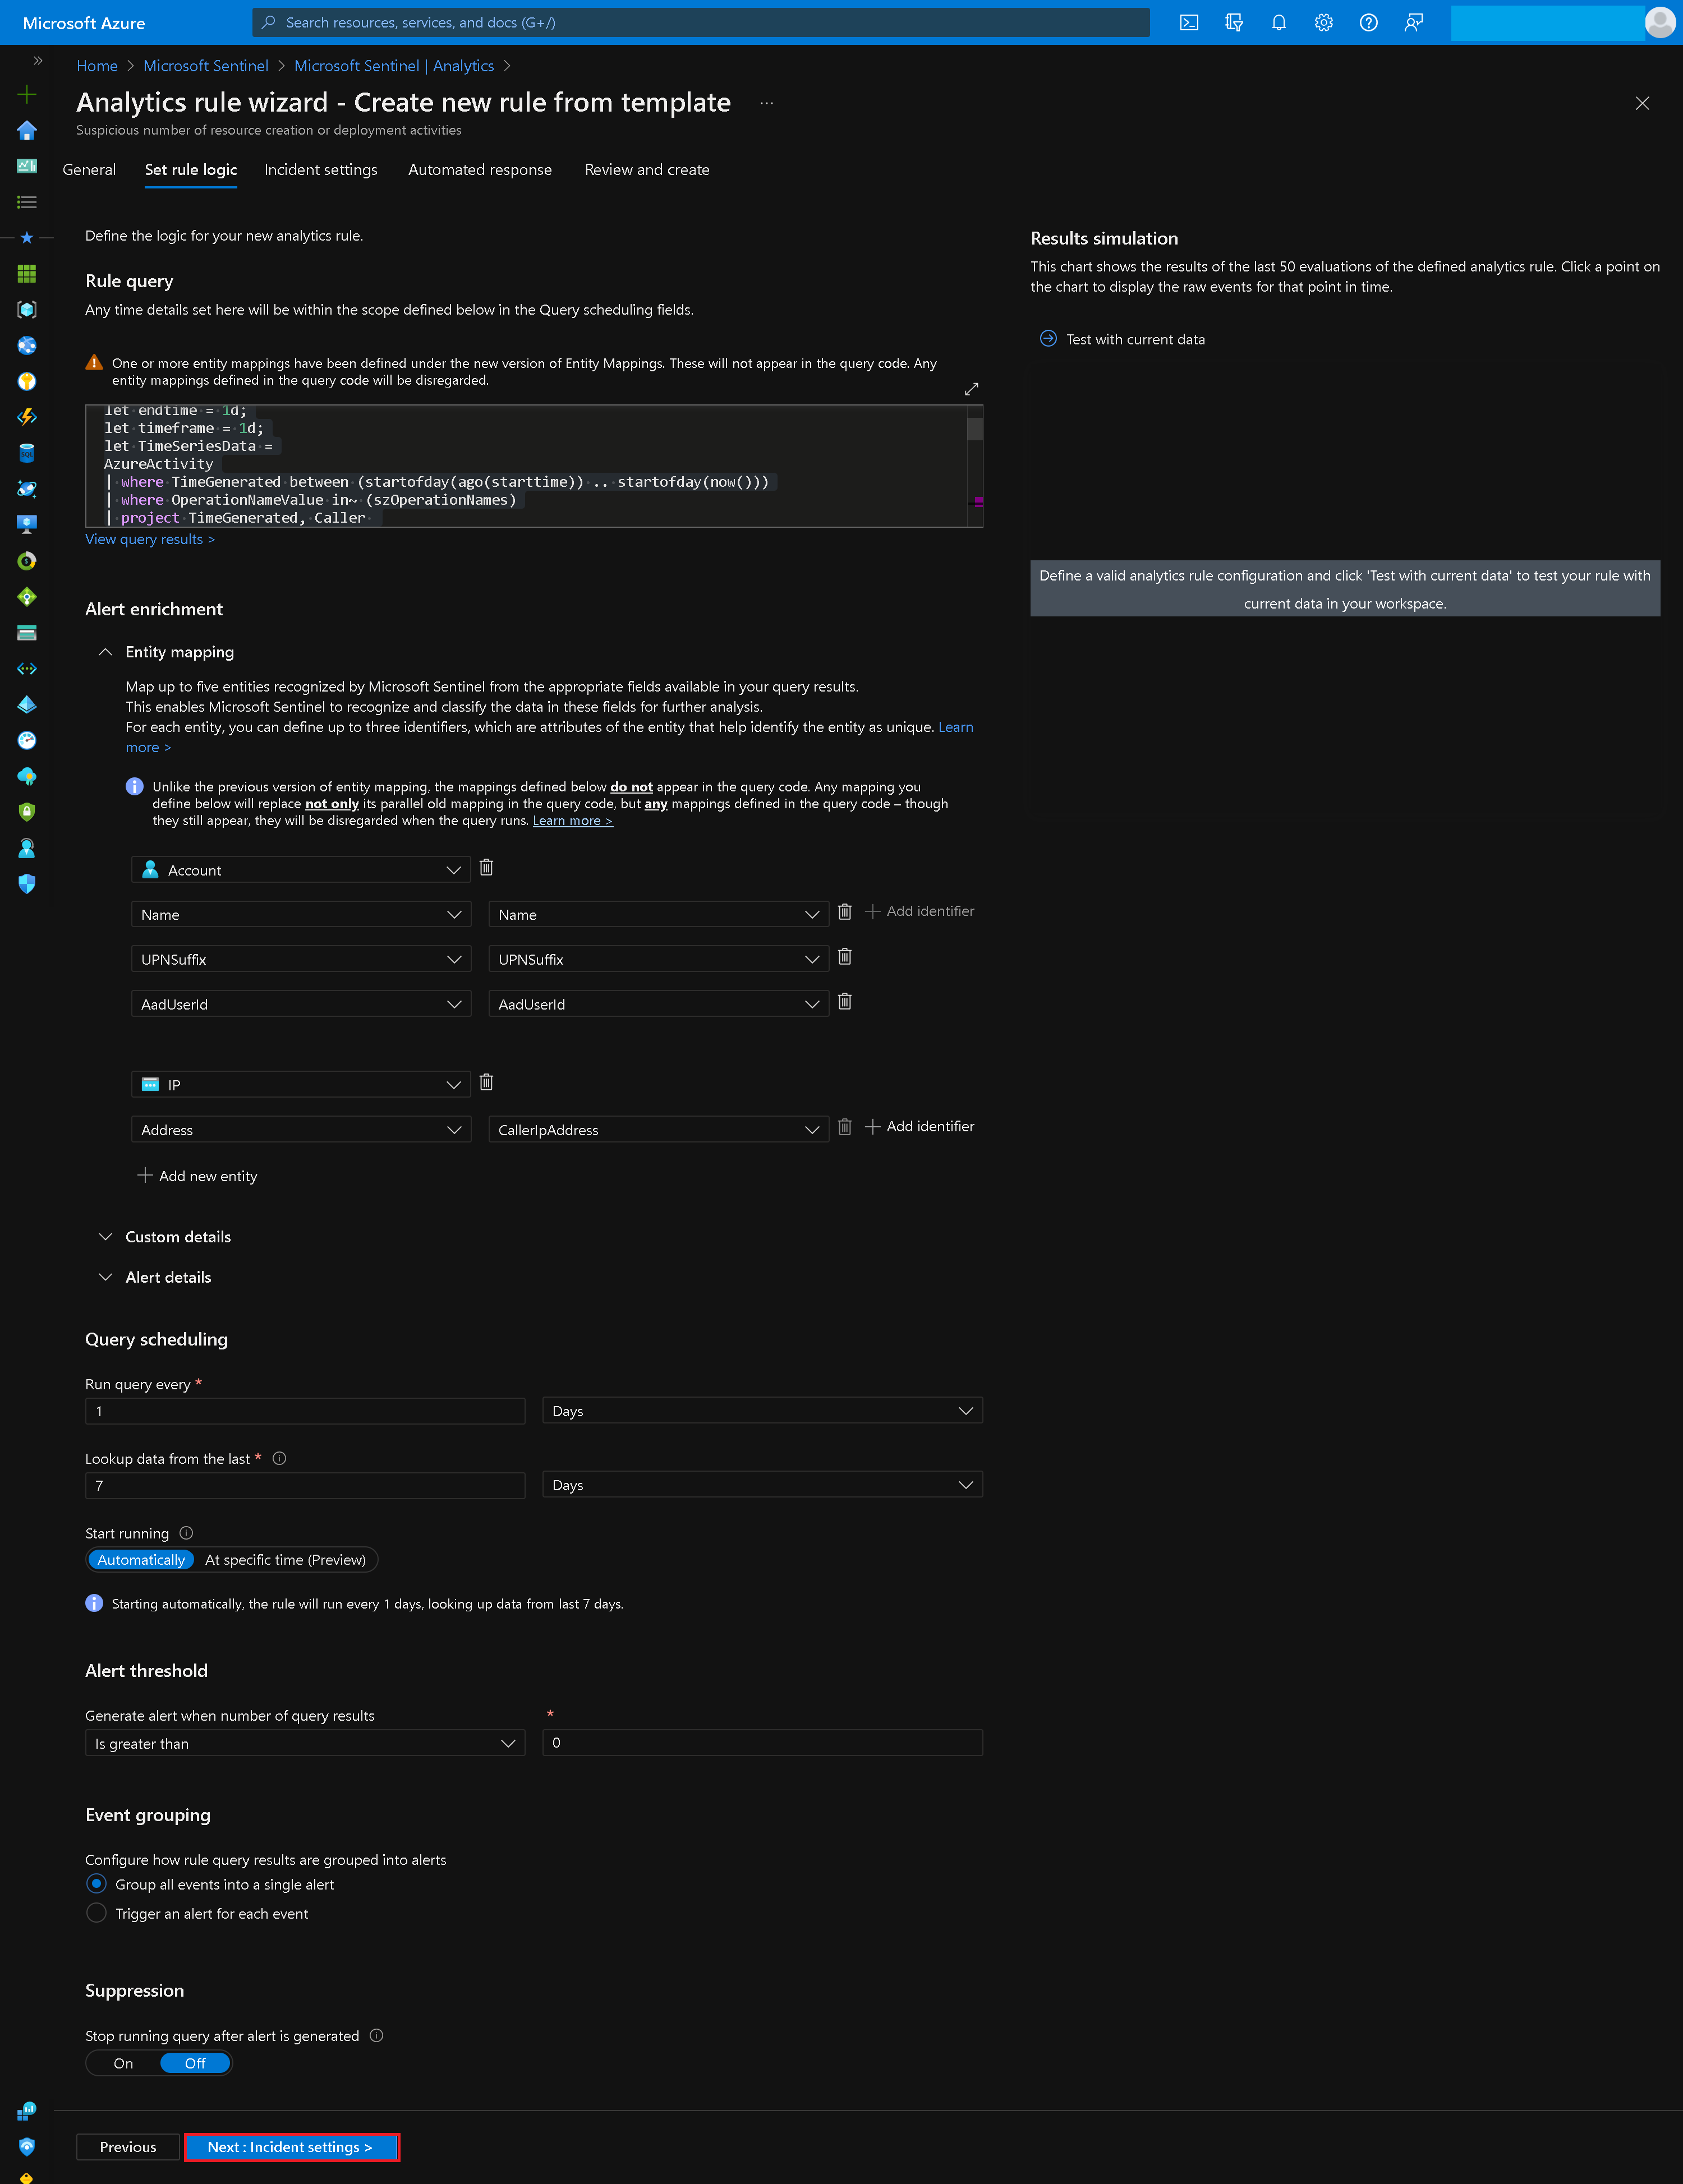
Set Logic Rule in Template
let szOperationNames = dynamic(["microsoft.compute/virtualMachines/write", "microsoft.resources/deployments/write"]);
let starttime = 7d;
let endtime = 1d;
let timeframe = 1d;
let TimeSeriesData =
AzureActivity
| where TimeGenerated between (startofday(ago(starttime)) .. startofday(now()))
| where OperationNameValue in~ (szOperationNames)
| project TimeGenerated, Caller
| make-series Total = count() on TimeGenerated from startofday(ago(starttime)) to startofday(now()) step timeframe by Caller;
TimeSeriesData
| extend (anomalies, score, baseline) = series_decompose_anomalies(Total, 3, -1, 'linefit')
| mv-expand Total to typeof(double), TimeGenerated to typeof(datetime), anomalies to typeof(double), score to typeof(double), baseline to typeof(long)
| where TimeGenerated >= startofday(ago(endtime))
| where anomalies > 0 and baseline > 0
| project Caller, TimeGenerated, Total, baseline, anomalies, score
| join (AzureActivity
| where TimeGenerated > startofday(ago(endtime))
| where OperationNameValue in~ (szOperationNames)
| summarize make_set(OperationNameValue,100), make_set(_ResourceId,100), make_set(CallerIpAddress,100) by bin(TimeGenerated, timeframe), Caller
) on TimeGenerated, Caller
| mv-expand CallerIpAddress=set_CallerIpAddress
| project-away Caller1
| extend Name = iif(Caller has '@',tostring(split(Caller,'@',0)[0]),"")
| extend UPNSuffix = iif(Caller has '@',tostring(split(Caller,'@',1)[0]),"")
| extend AadUserId = iif(Caller !has '@',Caller,"")- Review the rule configuration and click "Create" to activate the rule.
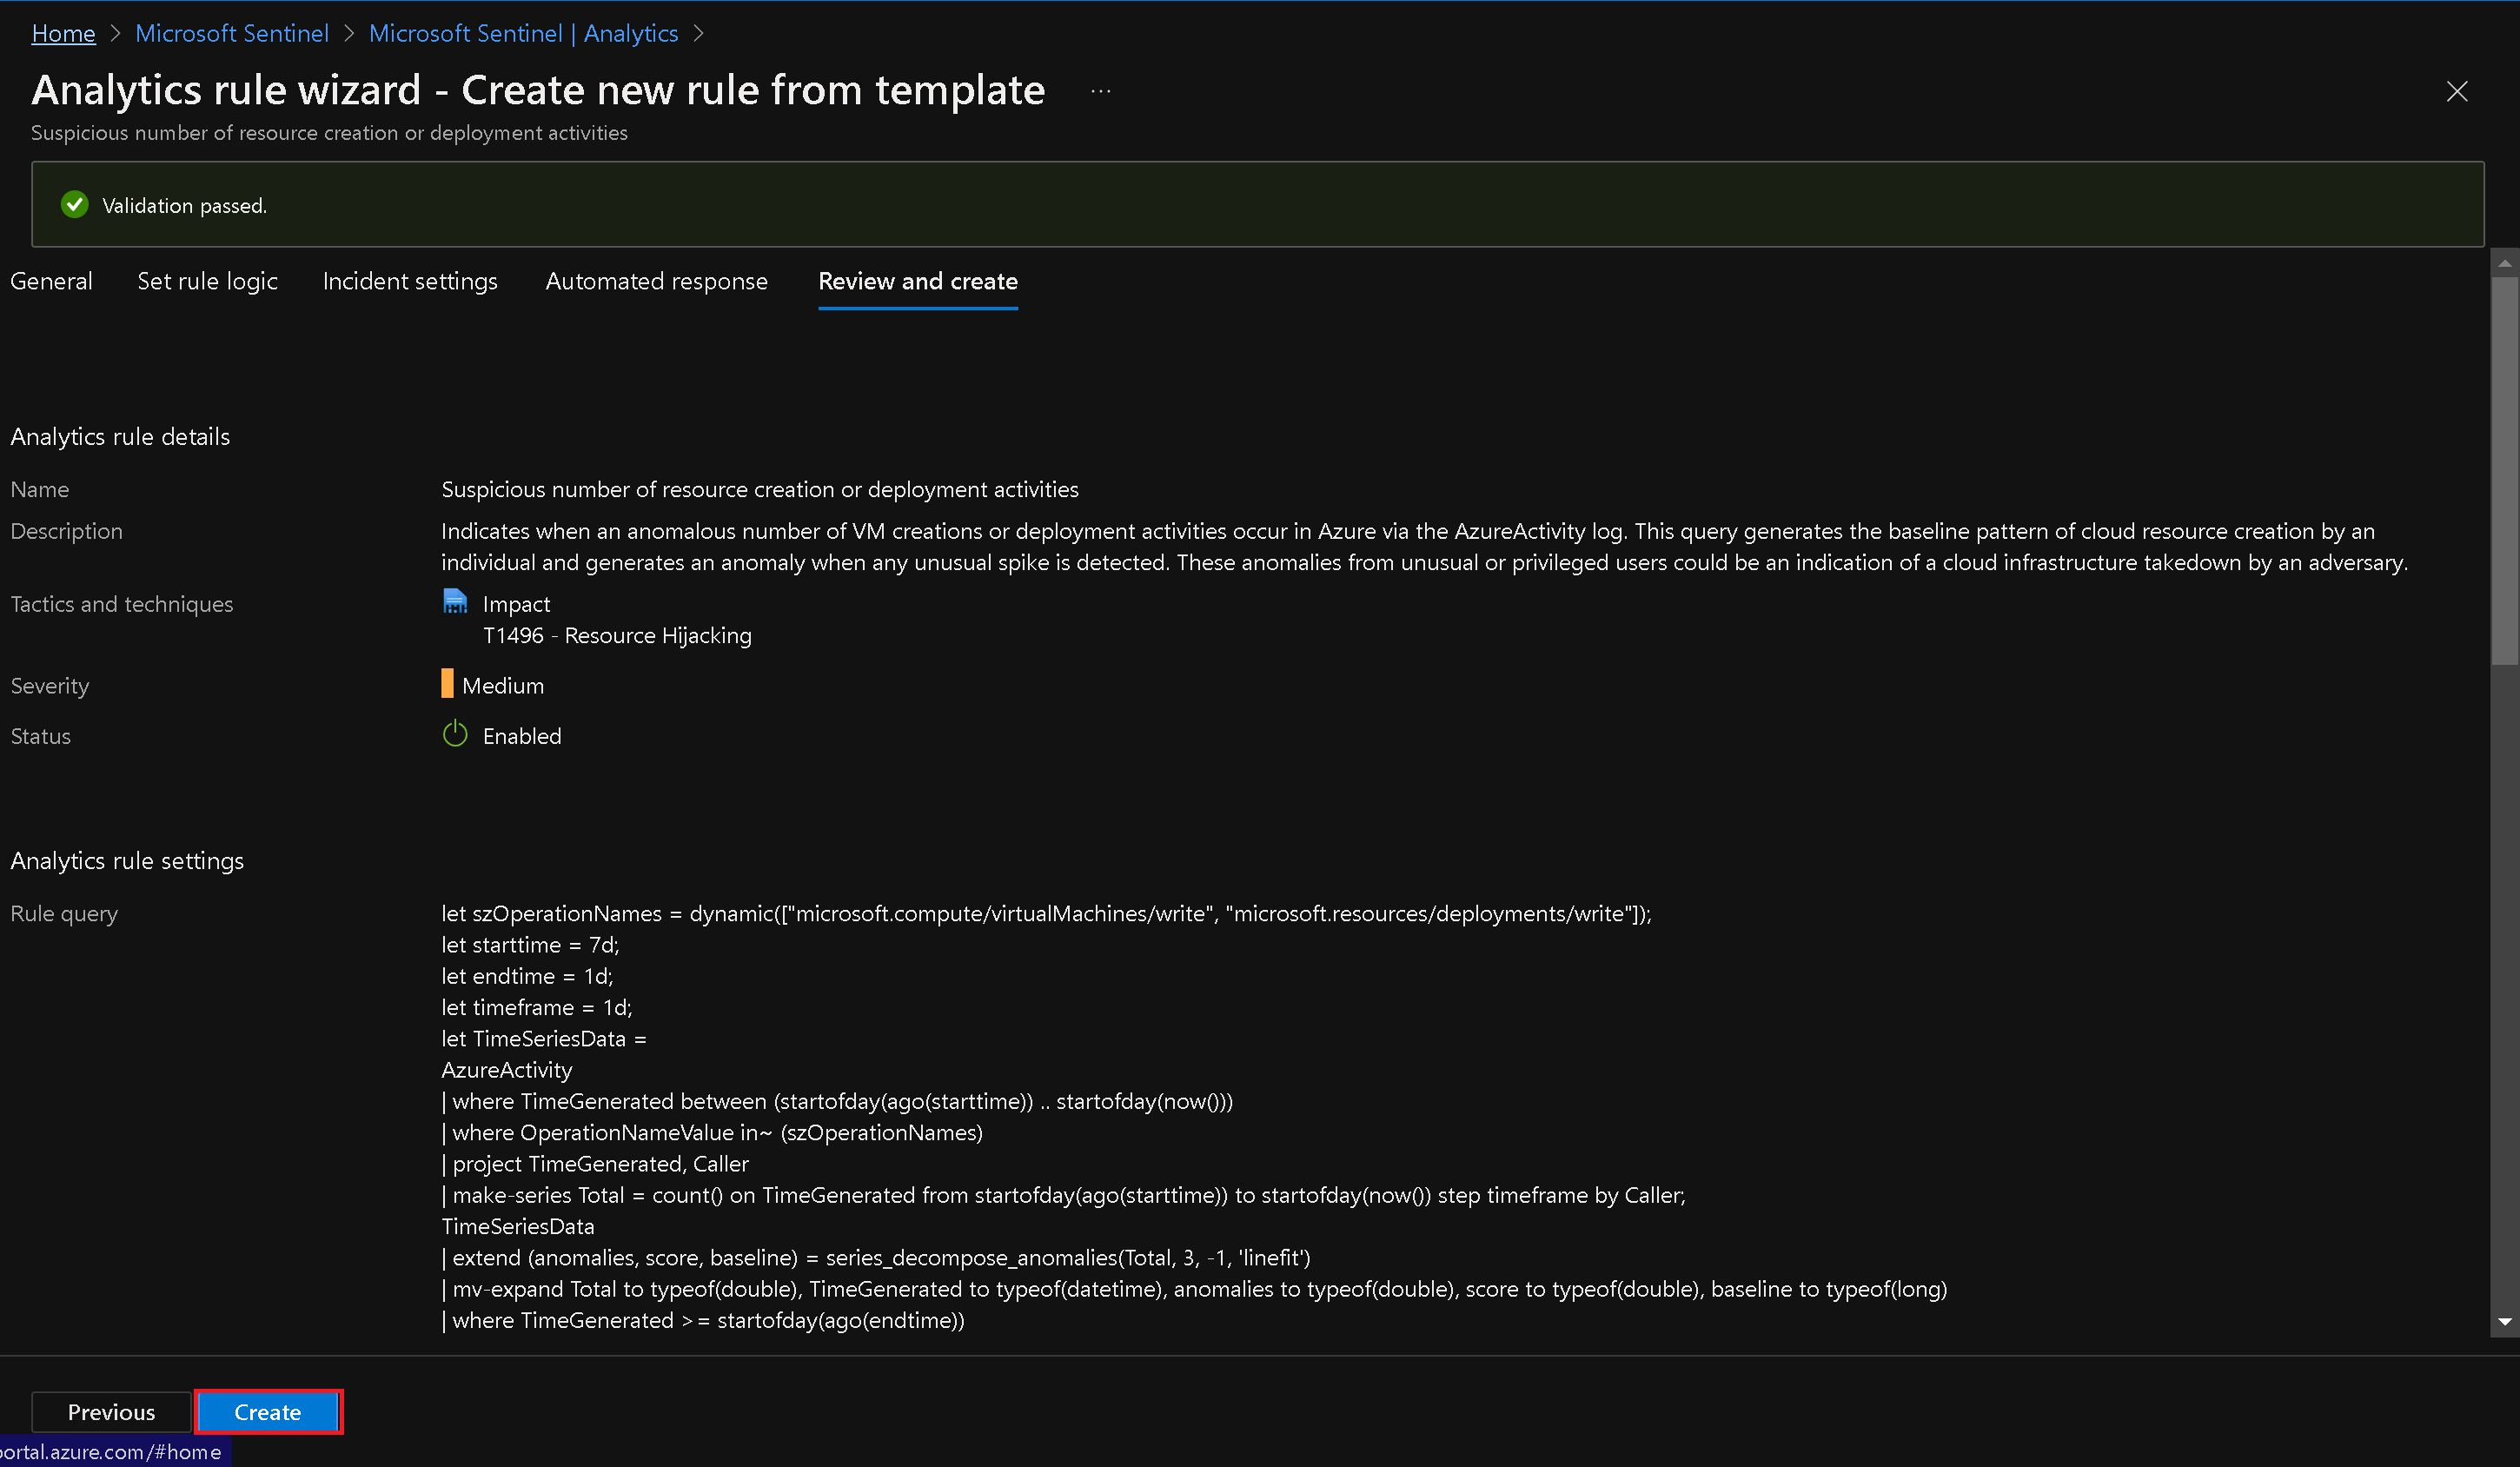
Note: You now have an active rule.
Task 4: Create a playbook
-
In the Azure portal, search for "Deploy a custom template" in the Search resources, services, and docs text box.
-
On the Custom deployment blade, choose the option to build your own template in the editor.
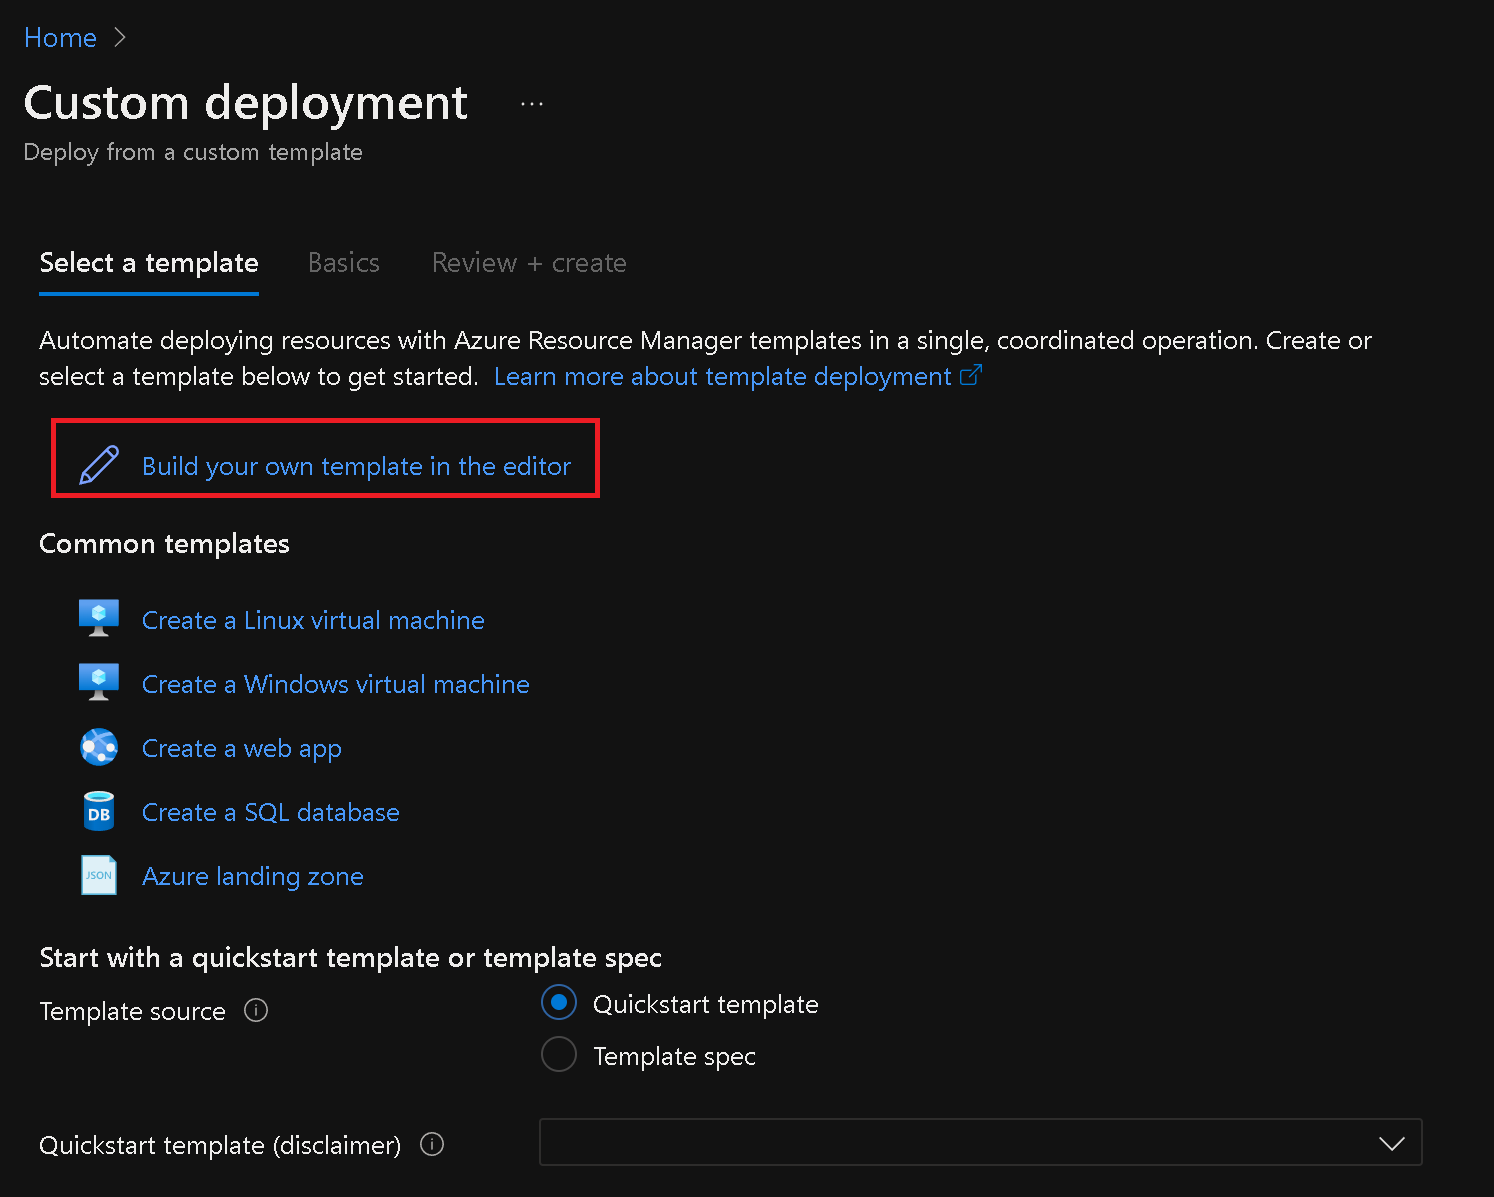
- Load the provided template file "changeincidentseverity.json" here.
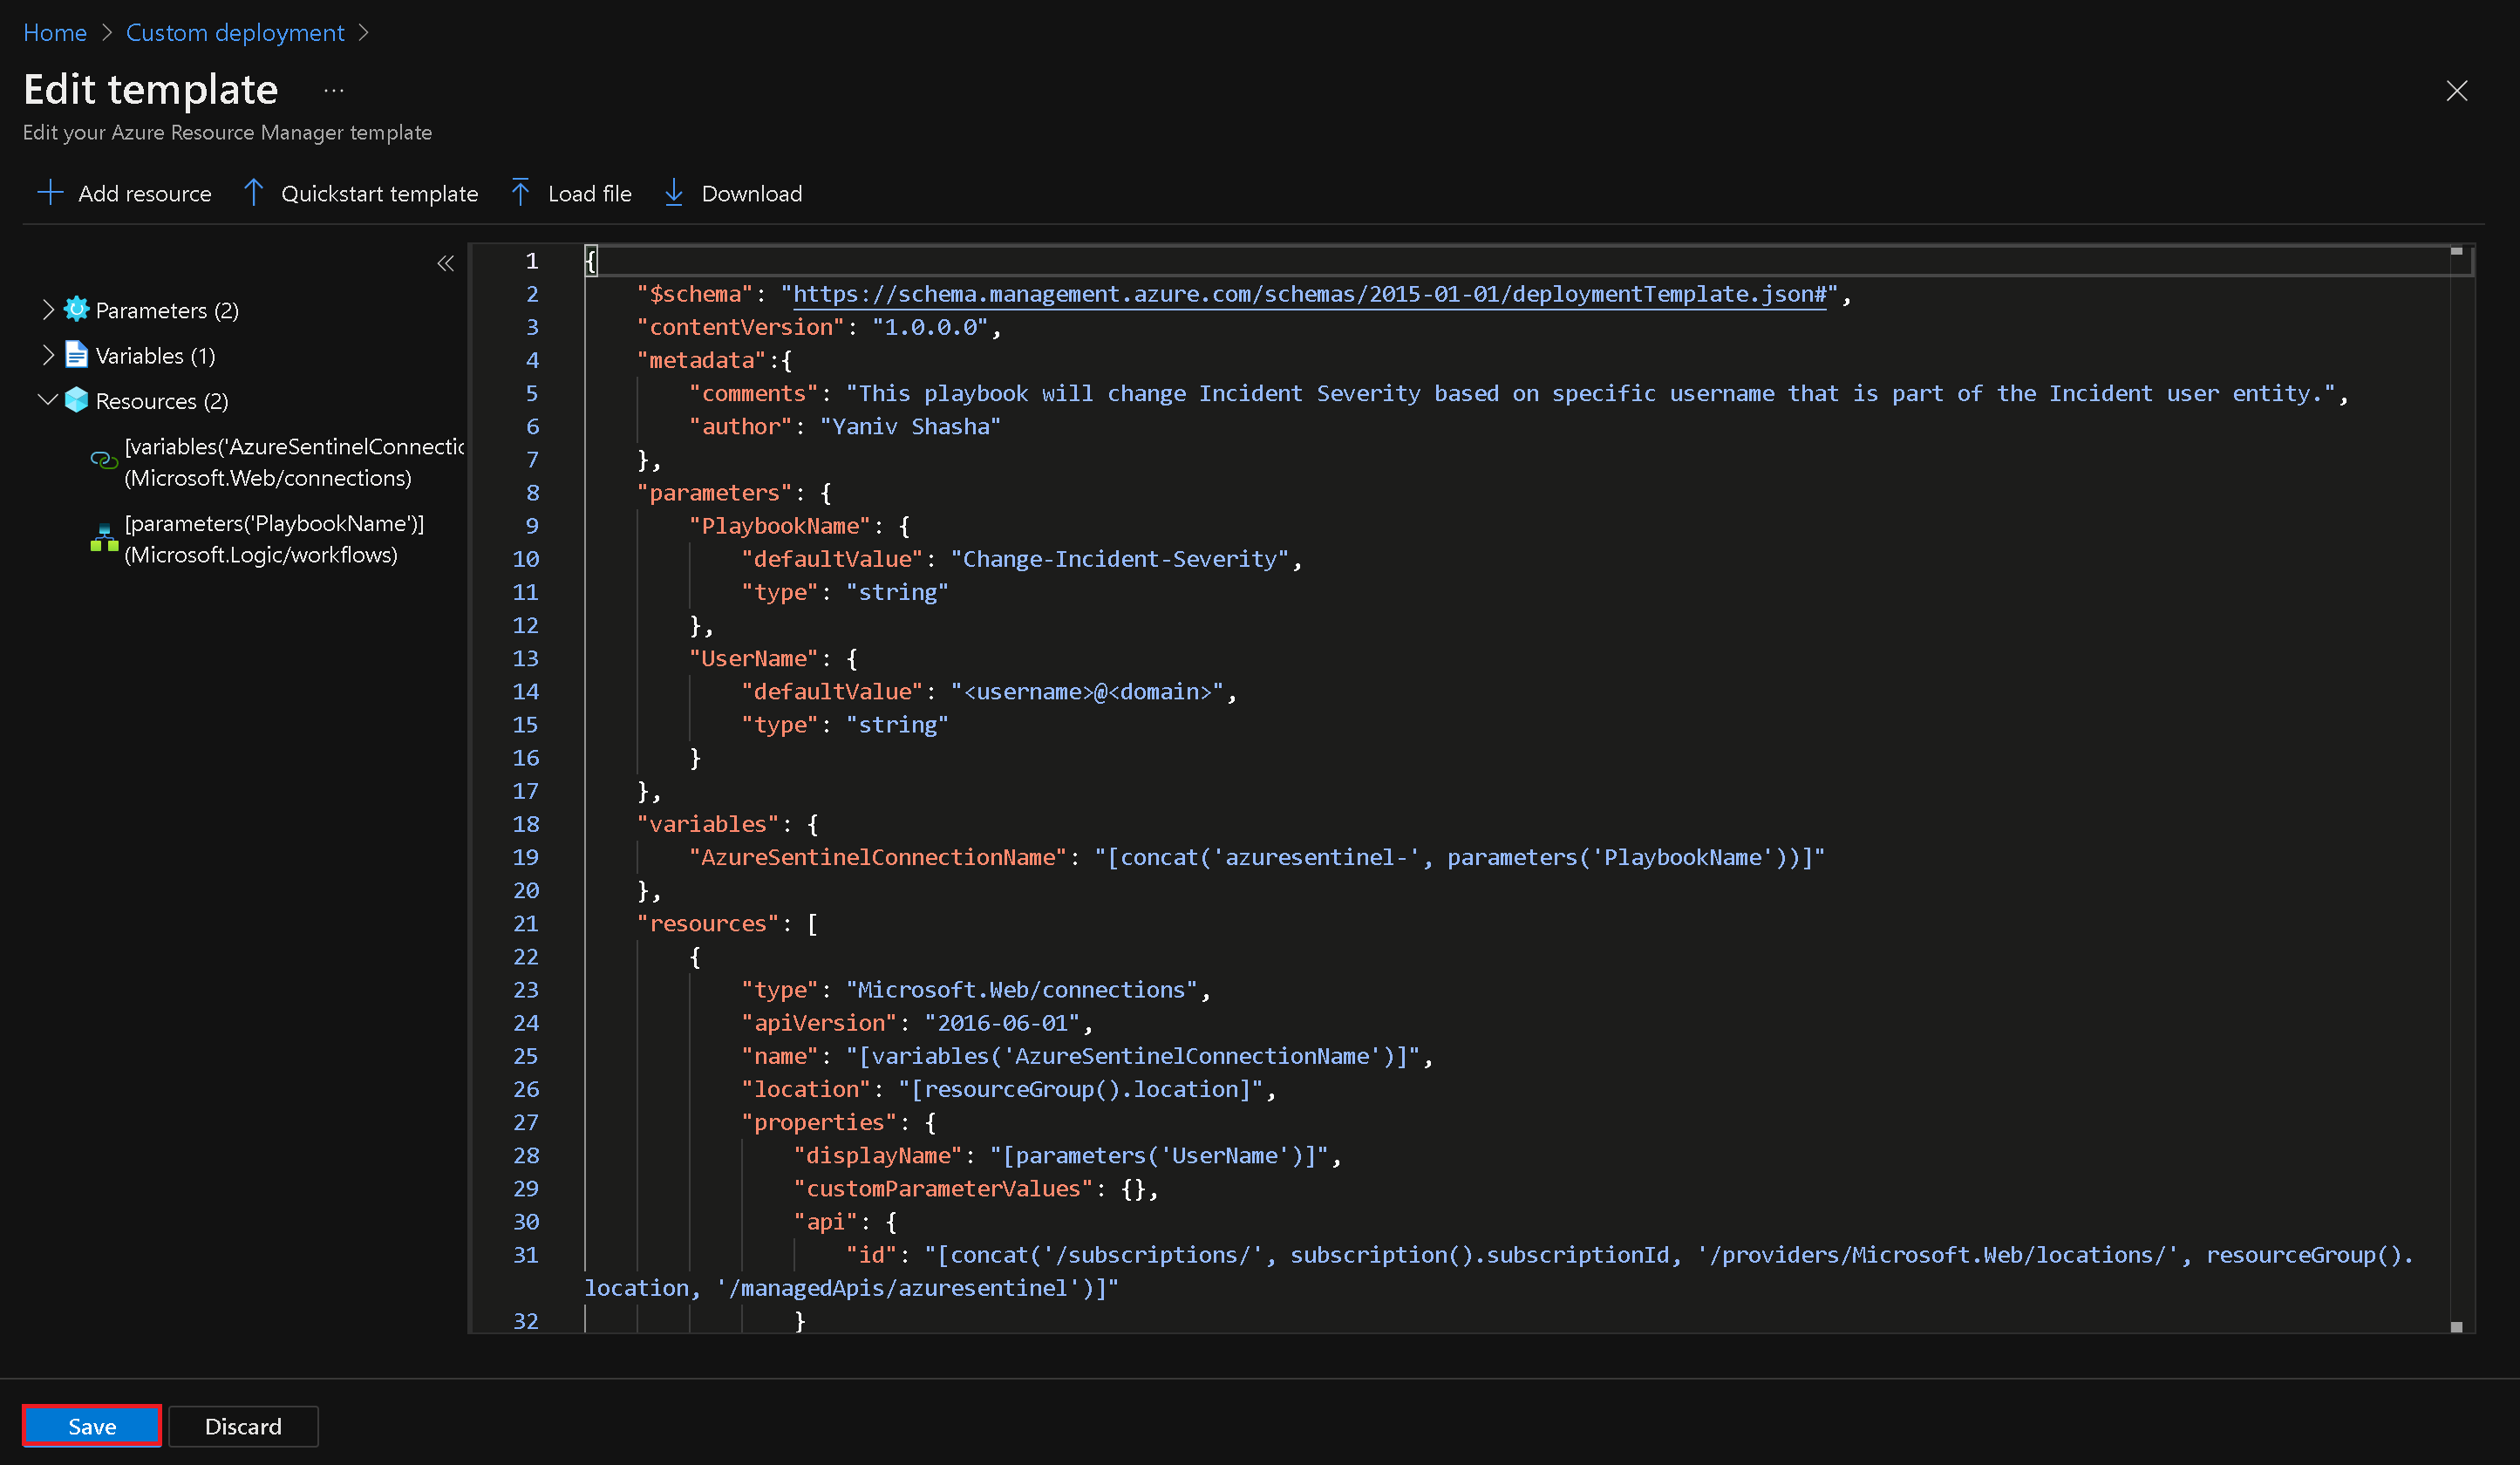
-
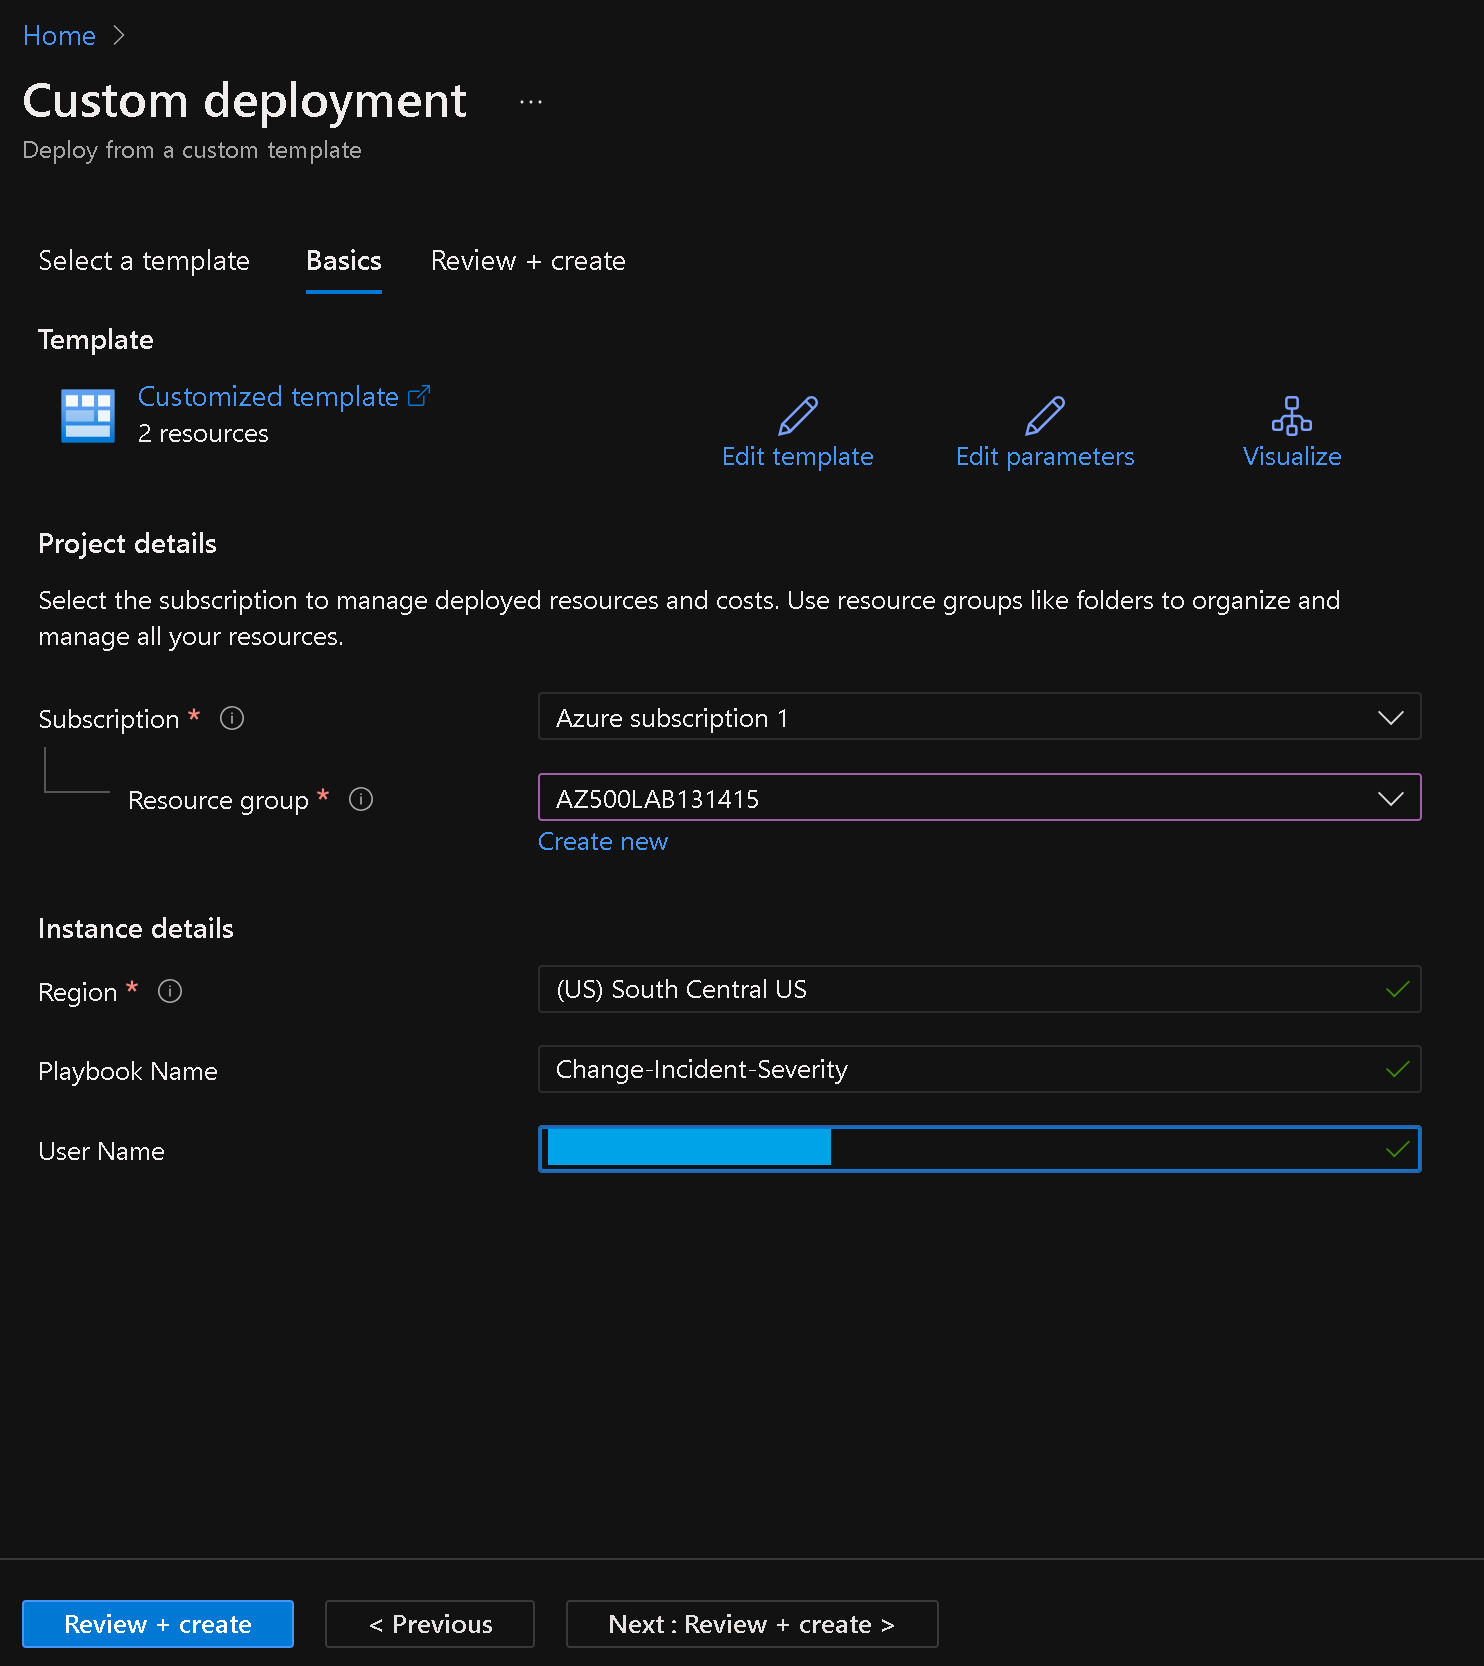
Save the template and provide the necessary details such as subscription, resource group, location, playbook name, and user name.
-
Review the settings and click "Review + create" and then "Create" to deploy the playbook.
Note: Wait for the deployment to complete.
In the Azure portal, in the Search resources, services, and docs text box at the top of the Azure portal page, type Resource groups and press the Enter key.
On the Resource groups blade, in the list of resource group, click the AZ500LAB131415 entry.
On the AZ500LAB131415 resource group blade, in the list of resources, click the entry representing the newly created Change-Incident-Severity logic app.
On the Change-Incident-Severity blade, click Edit.
Note: On the Logic Apps Designer blade, each of the four connections displays a warning. This means that each needs to reviewed and configured.
On the Logic Apps Designer blade, click the first Connections step.
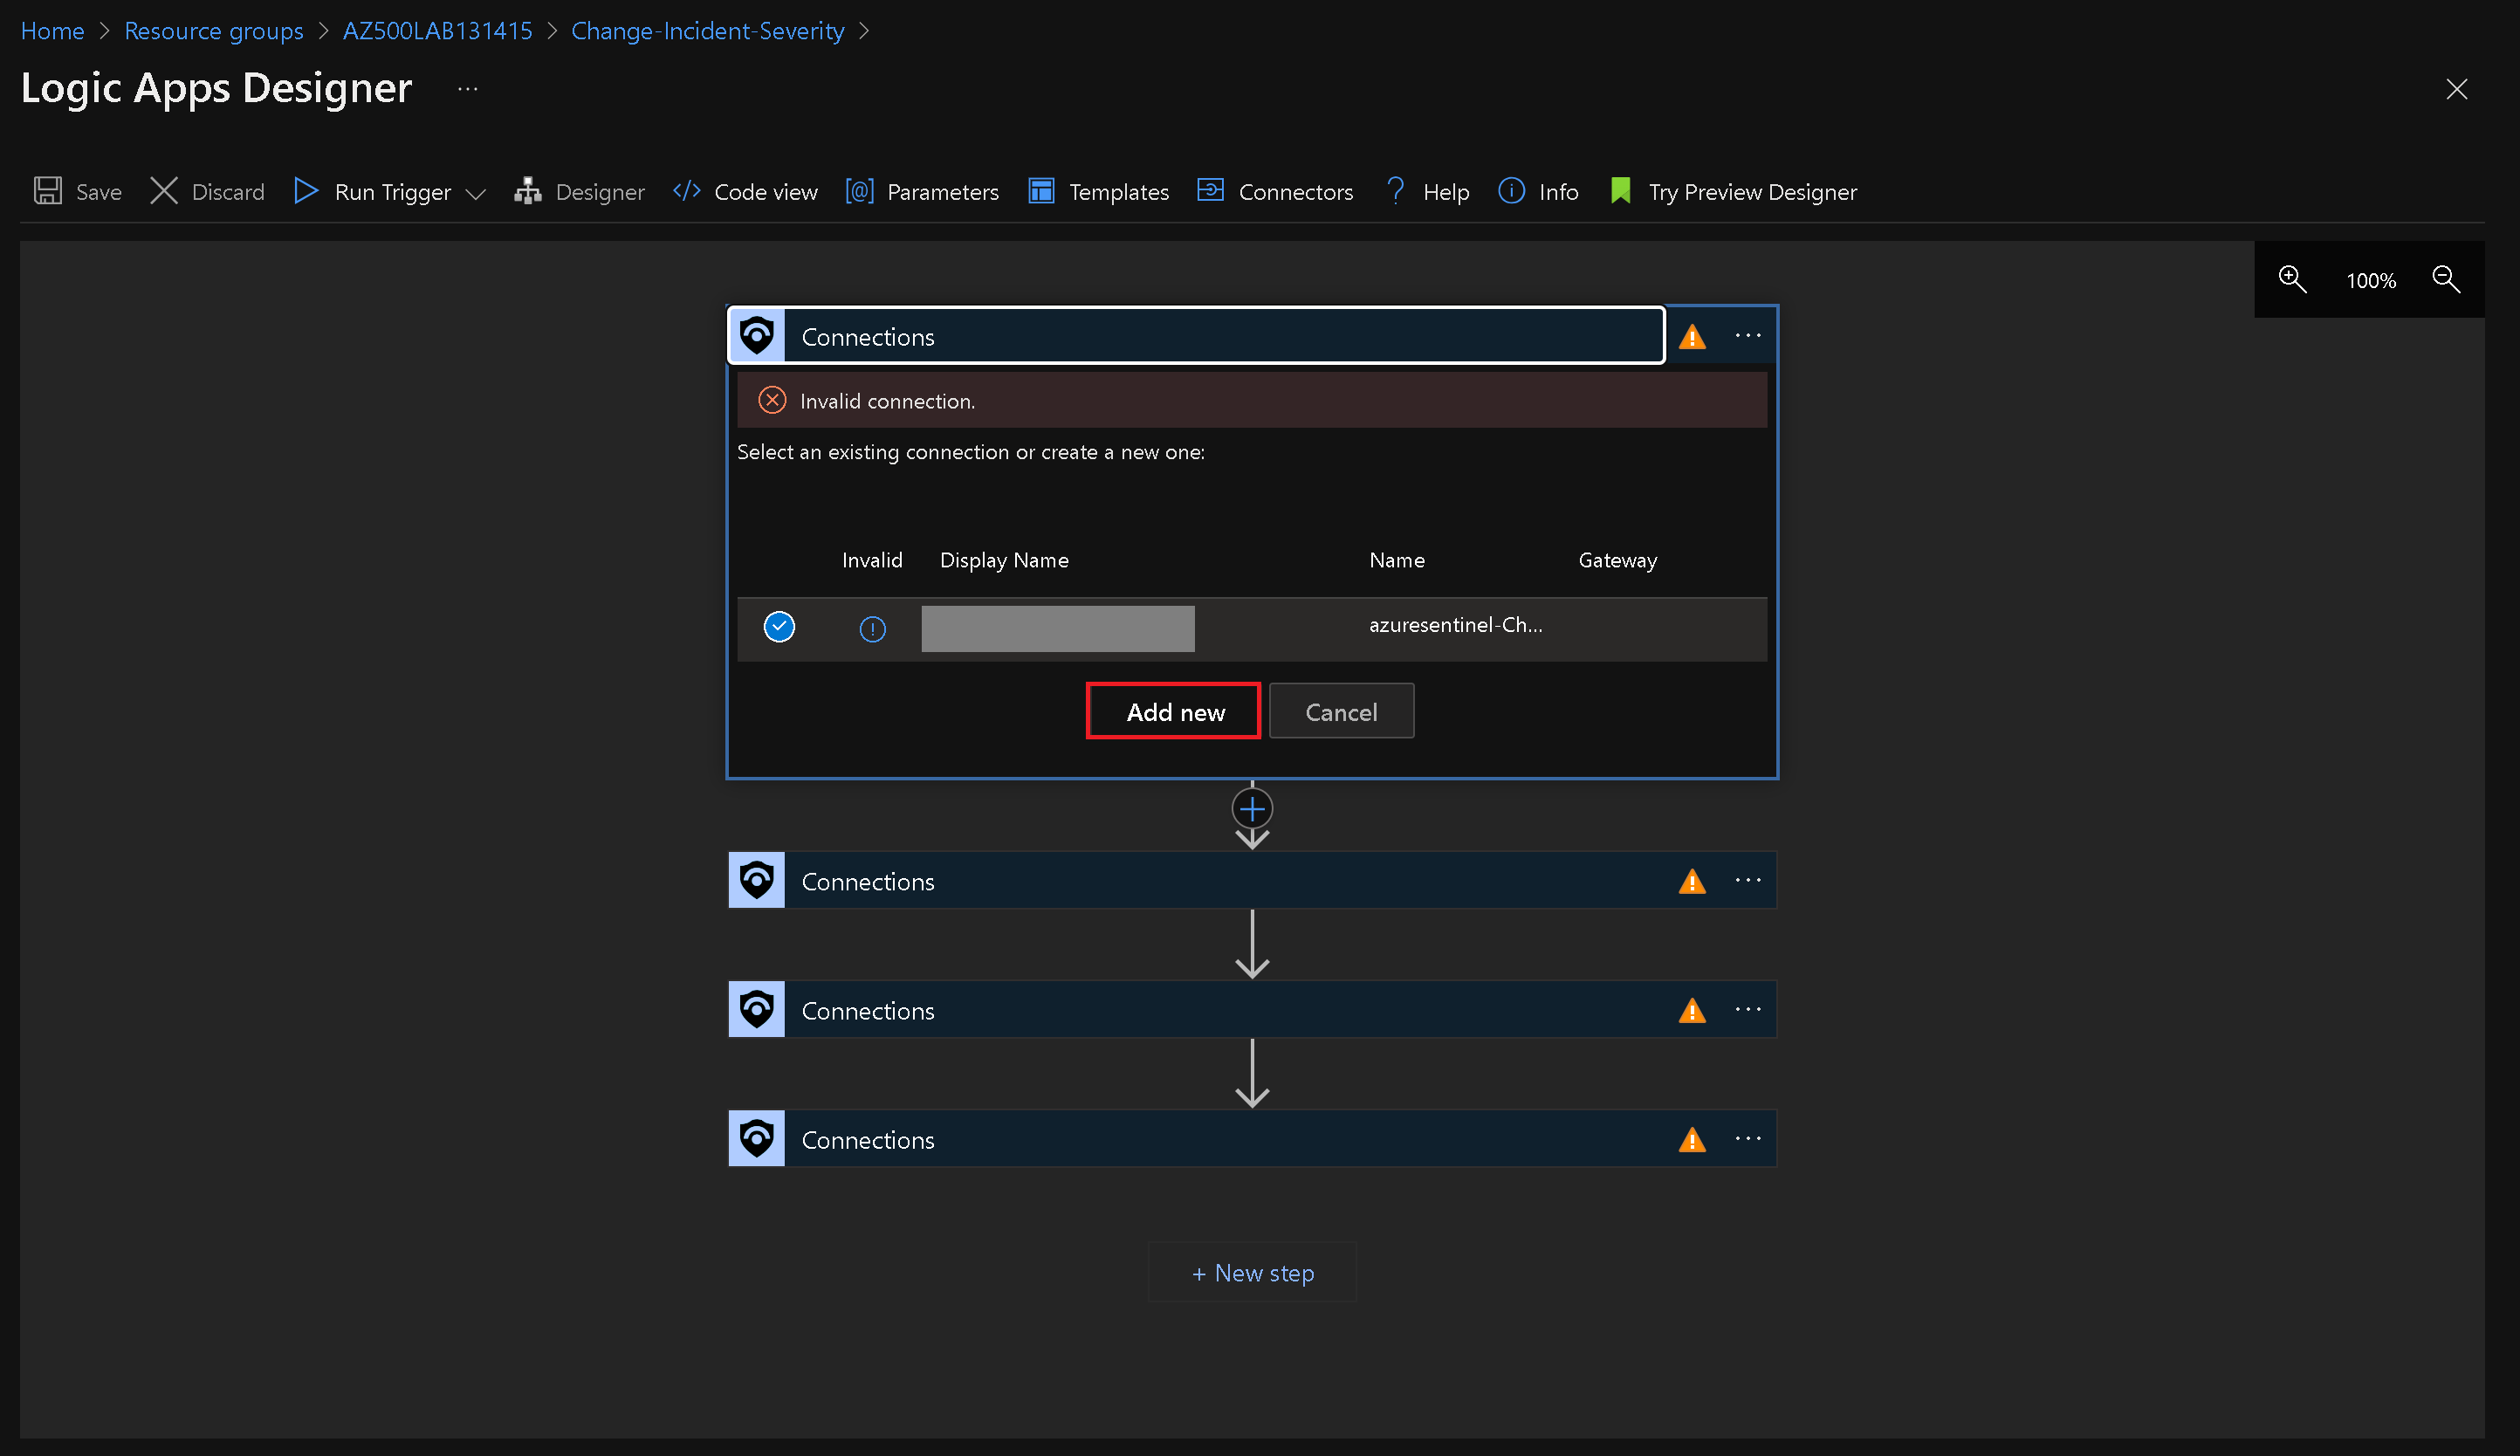
Click Add new, ensure that the entry in the Tenant drop down list contains your Azure AD tenant name and click Sign-in.
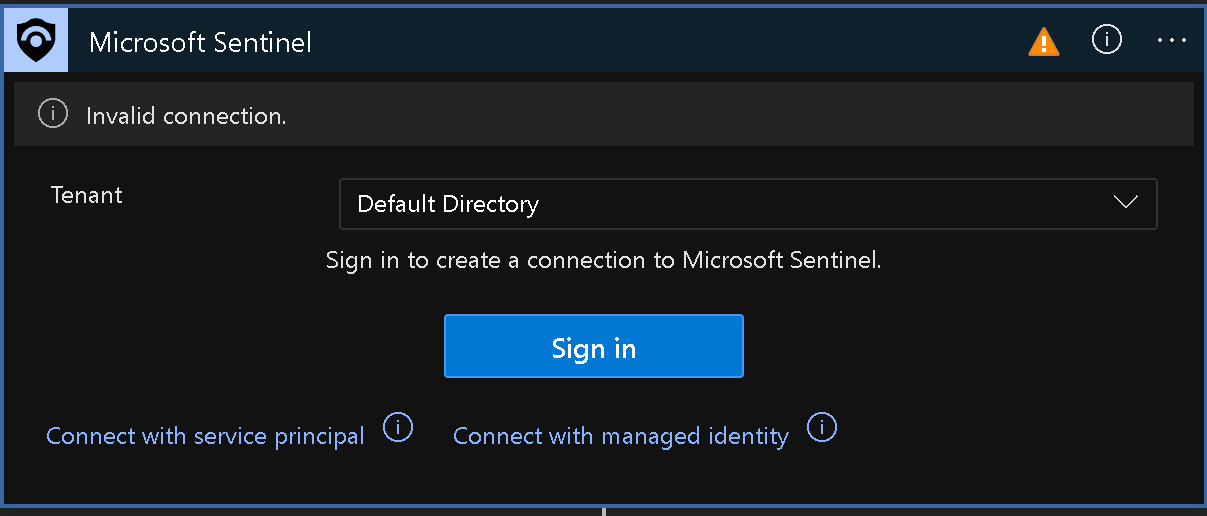
When prompted, sign in with the user account that has the Owner or Contributor role in the Azure subscription you are using for this lab.
Click the second Connection step and, in the list of connections, select the second entry, representing the connection you created in the previous step.
Repeat the previous steps in for the remaining two Connection steps.
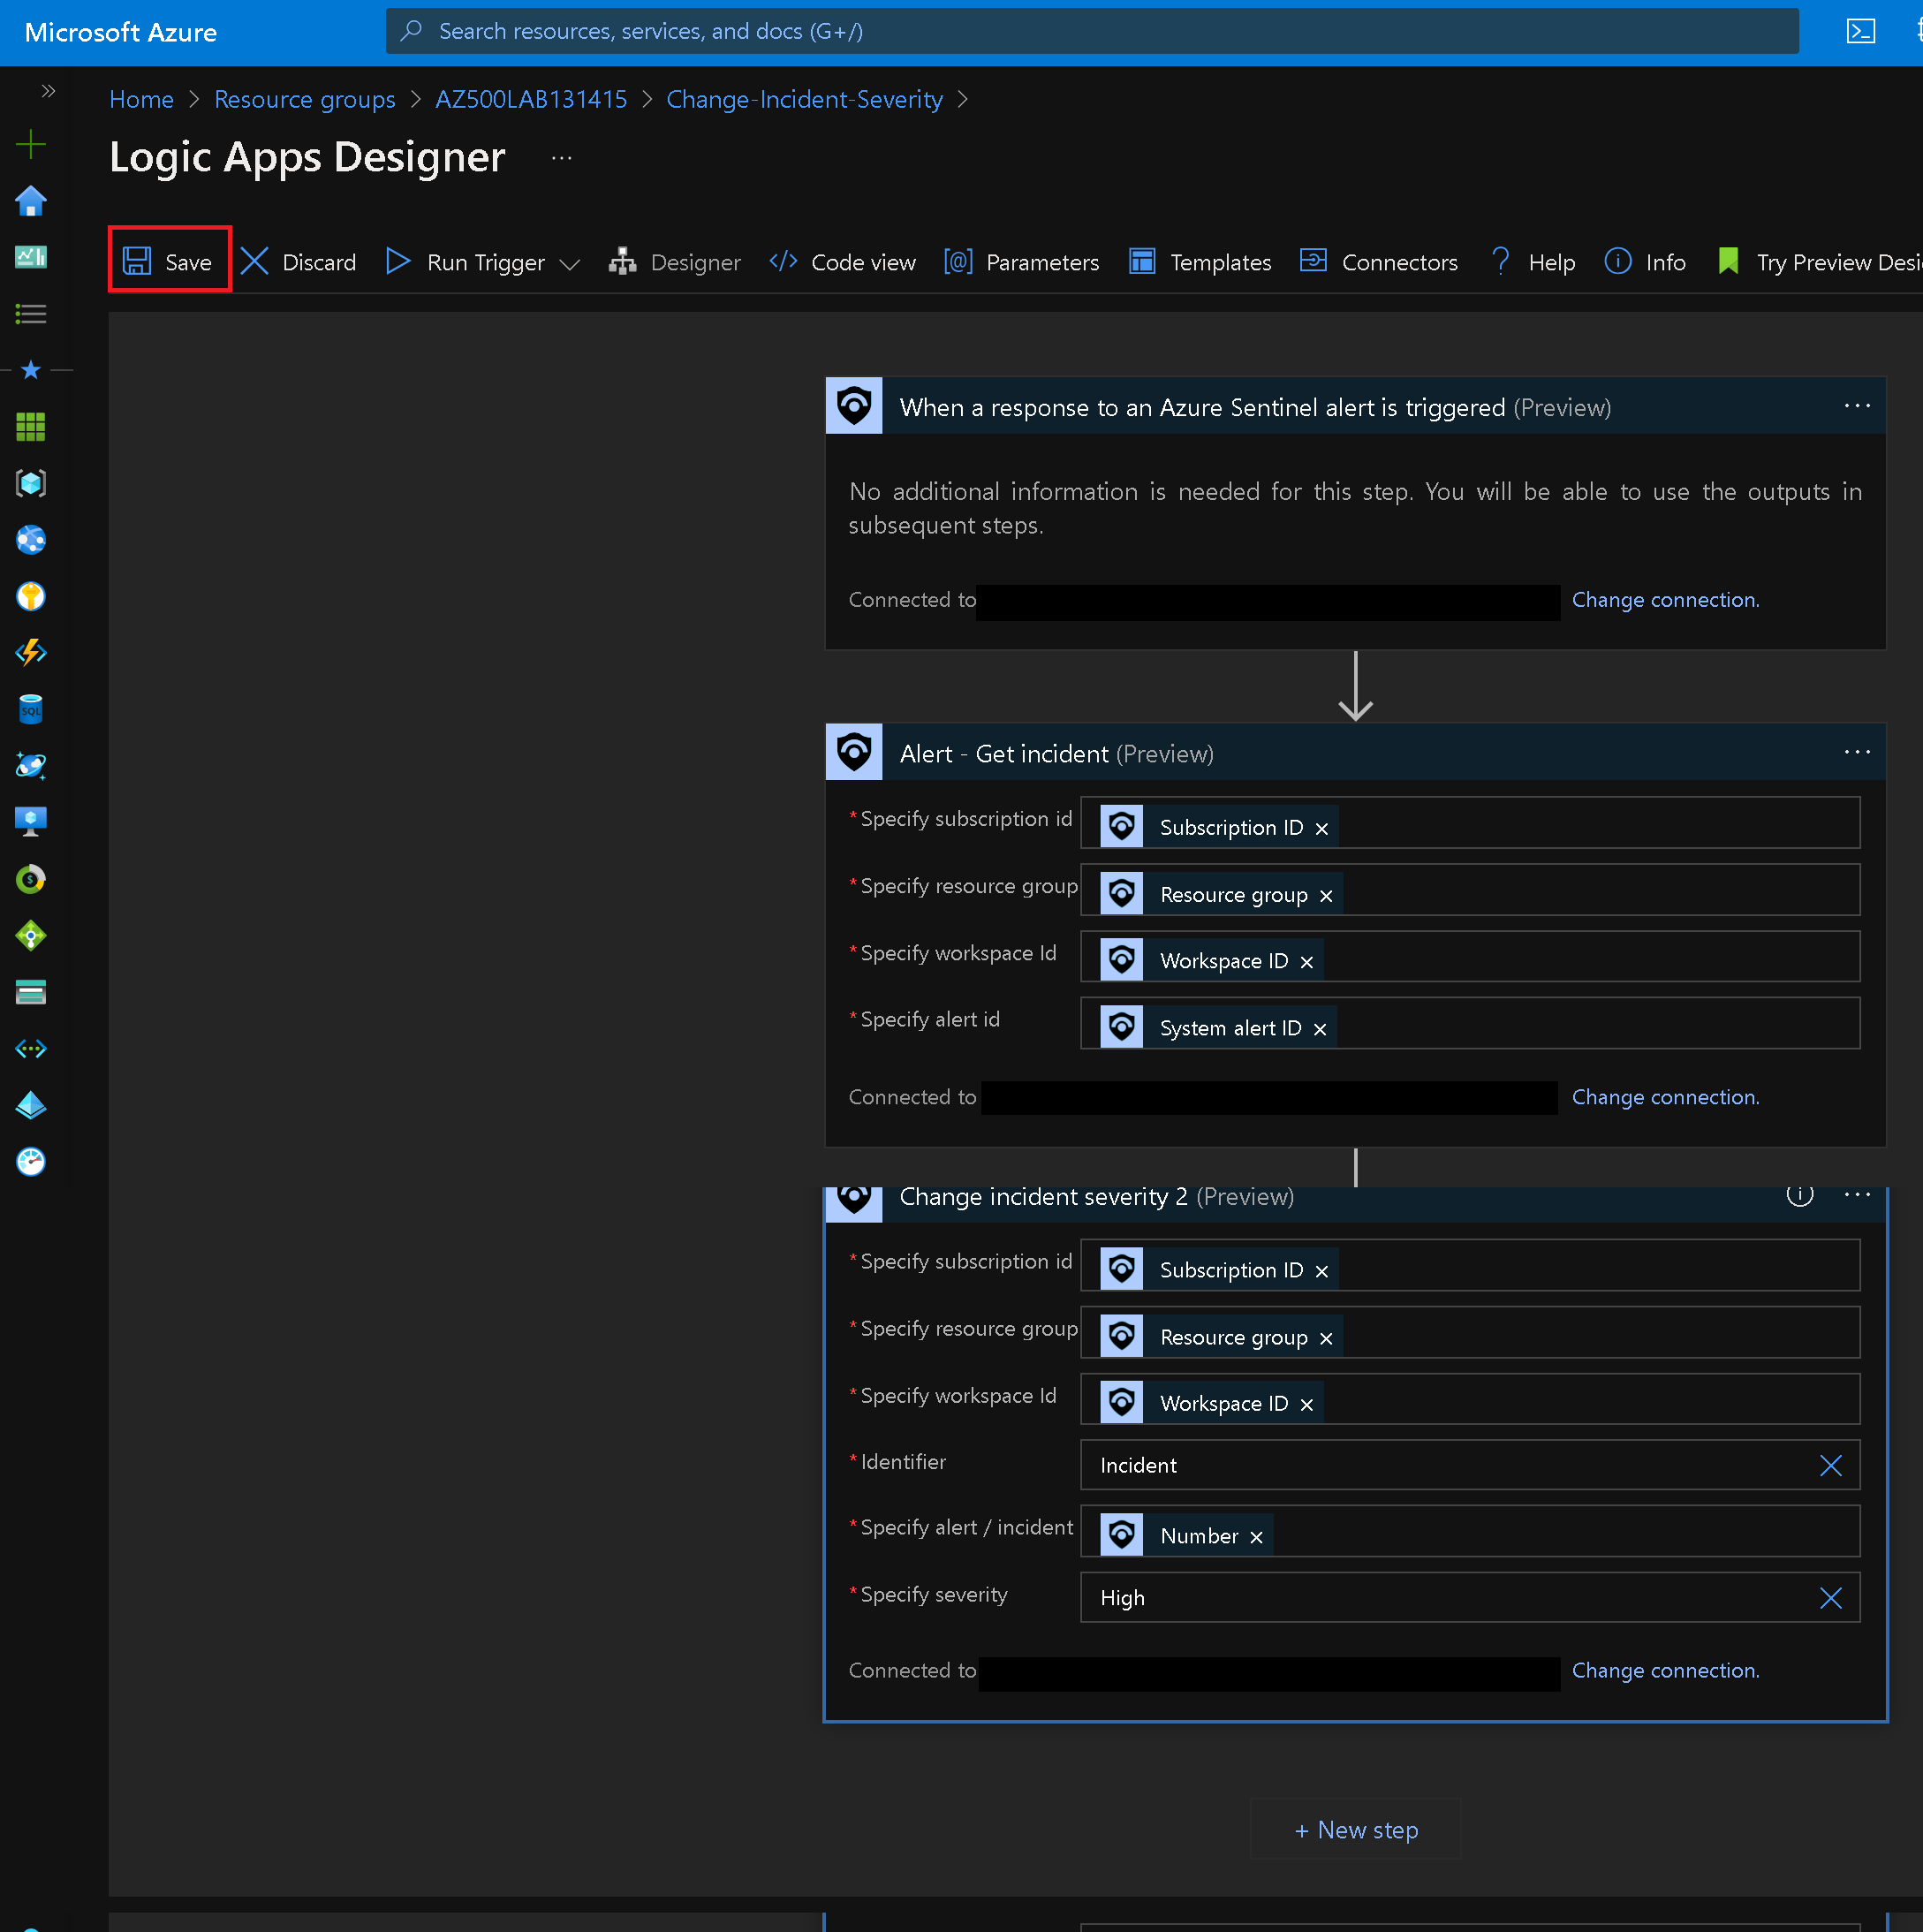
Note: Ensure there are no warnings displayed on any of the steps.
On the Logic Apps Designer blade, click Save to save your changes.
Task 5: Create a custom alert and configure a playbook as an automated response
-
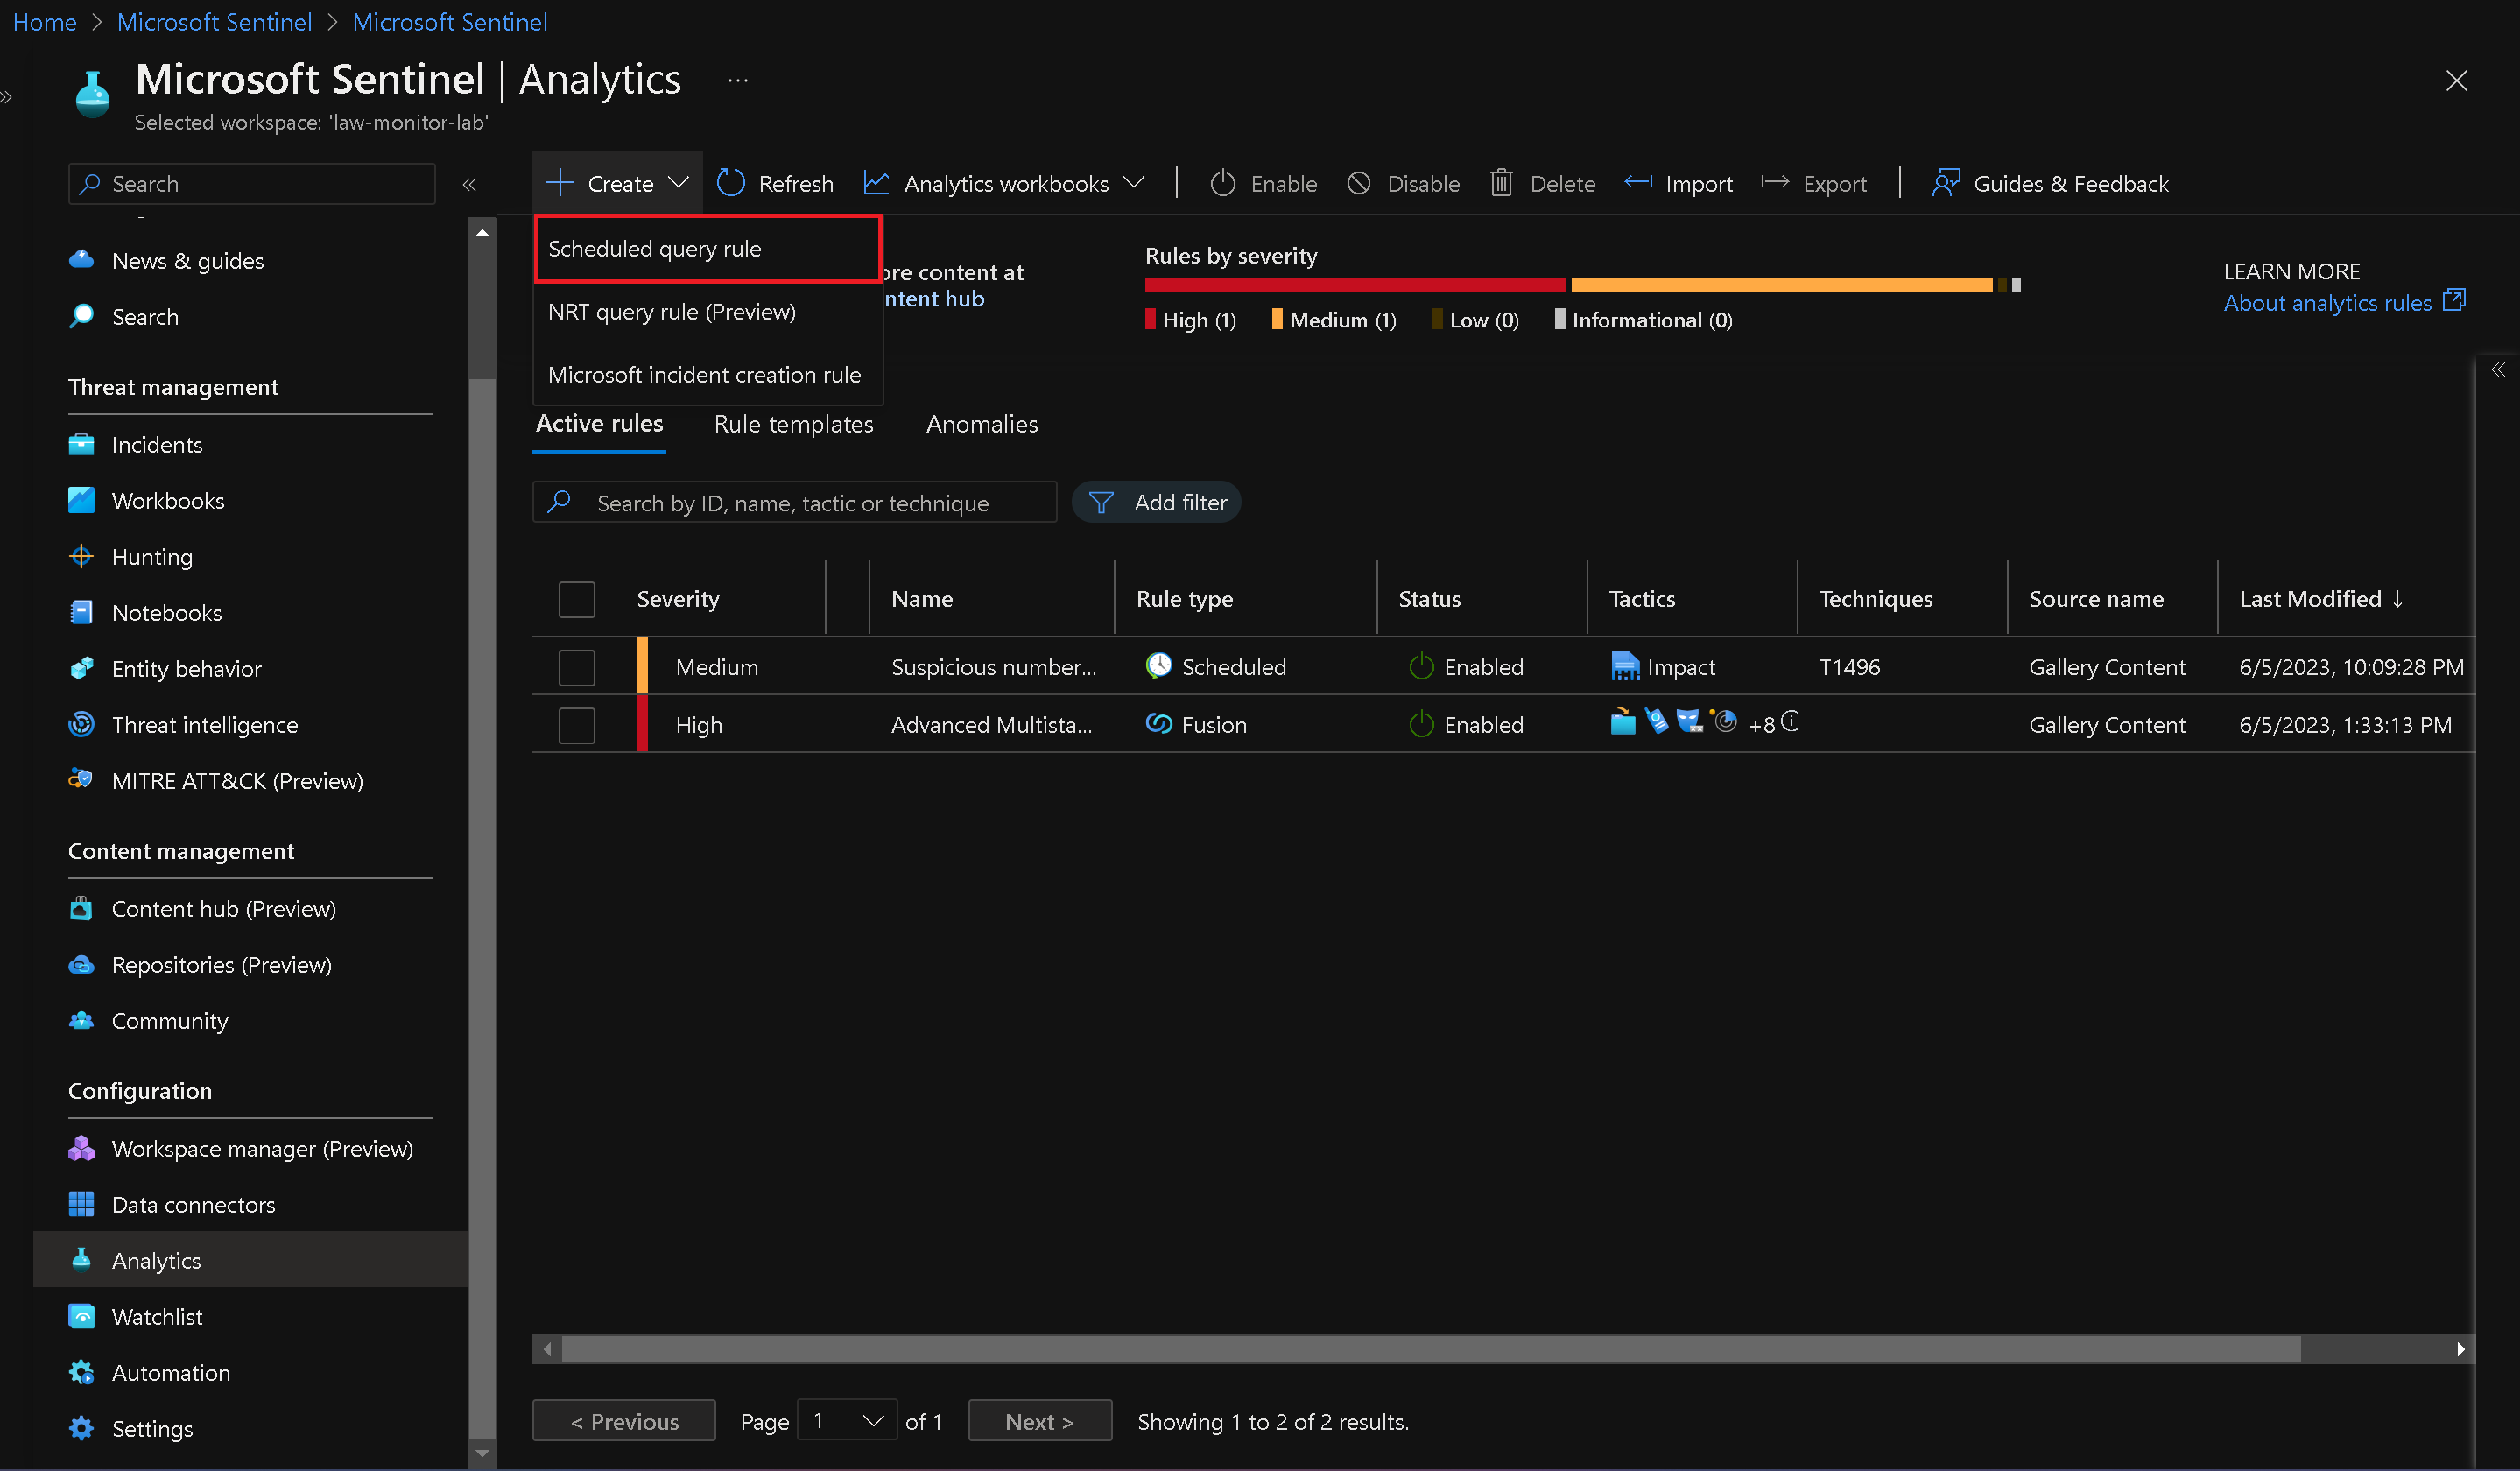
Go to the Microsoft Sentinel Overview blade and click "Analytics" in the Configuration section.
-
On the Analytics blade, click "+ Create" and select "Scheduled query rule" from the drop-down menu.
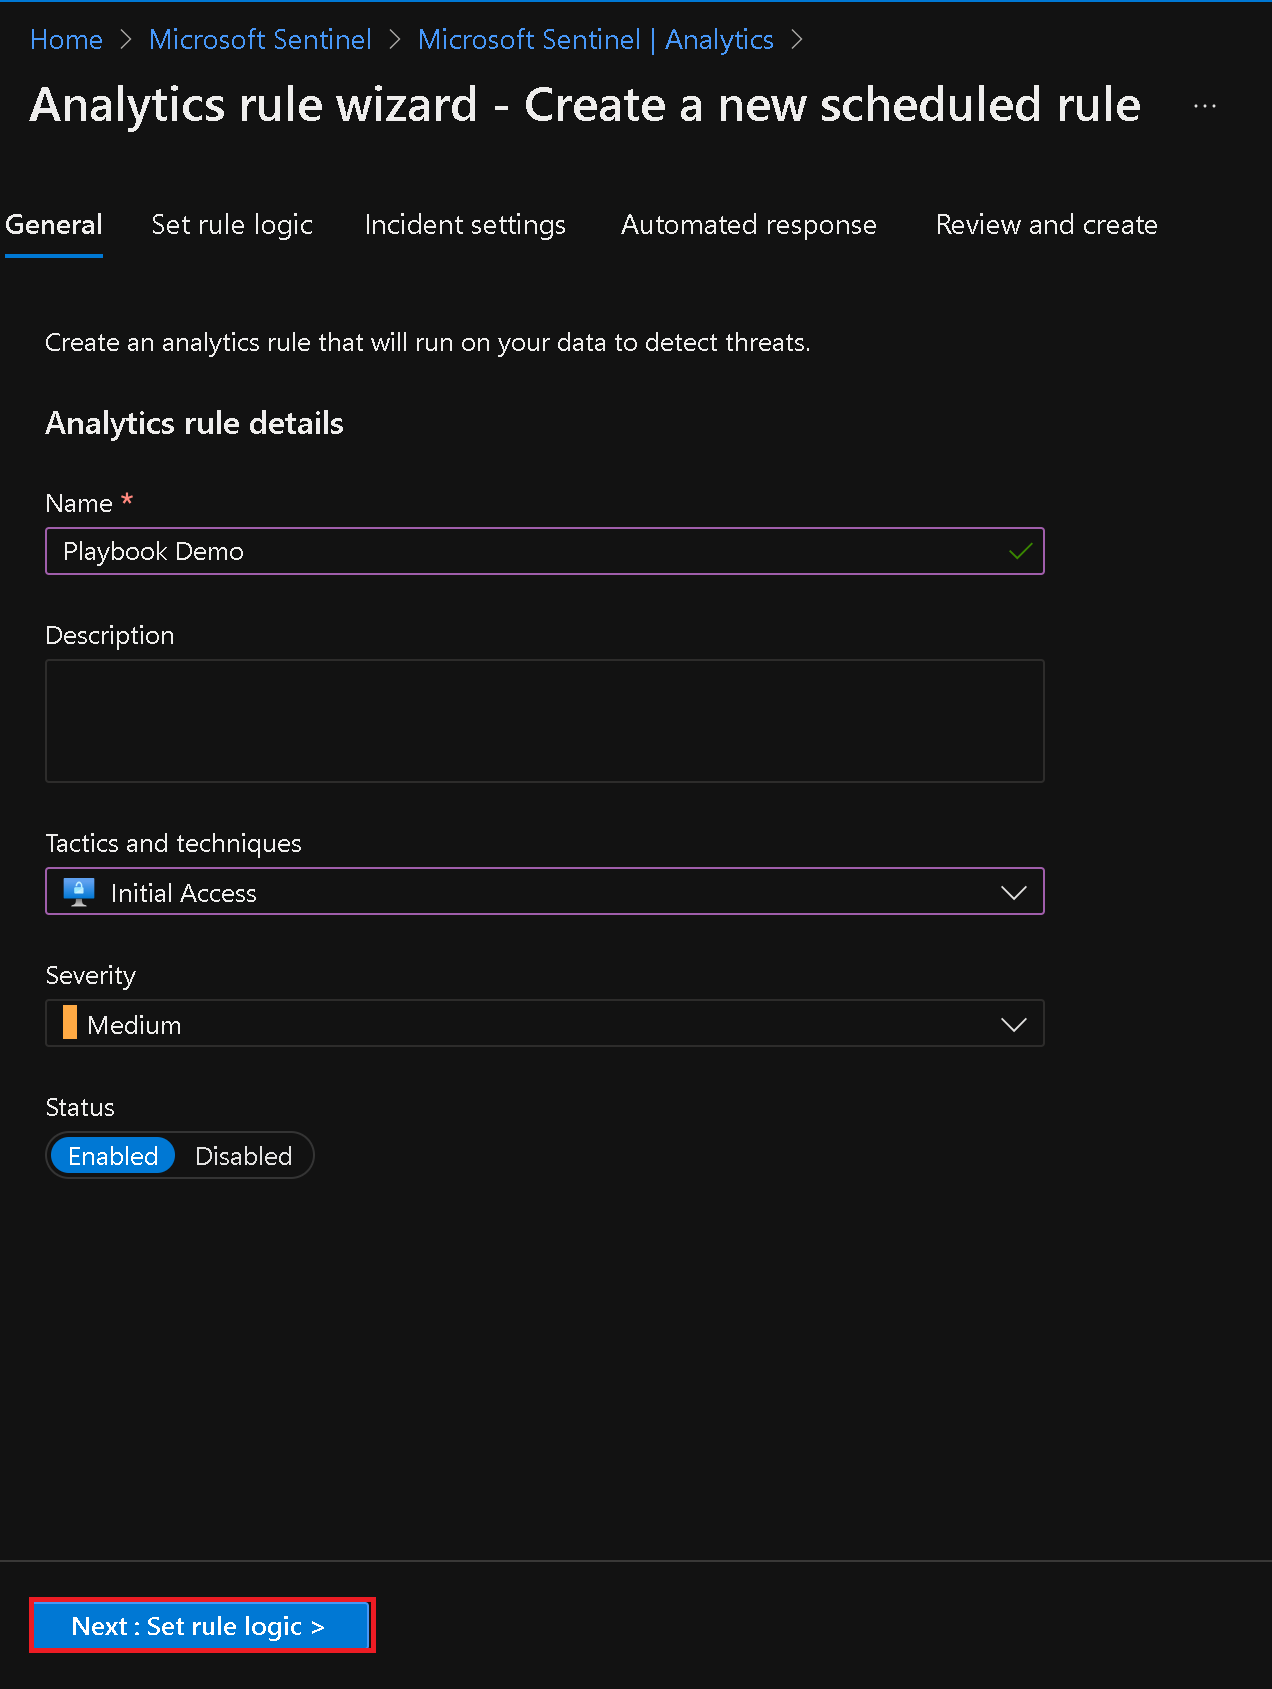
- On the General tab of the Create new rule blade, specify the rule name, tactics, and other settings.
- Switch to the Set rule logic tab and paste the provided rule query in the Rule query text box.
 AzureActivity
  | where ResourceProviderValue =~ "Microsoft.Security"
| where OperationNameValue =~ "Microsoft.Security/locations/jitNetworkAccessPolicies/delete" Note: This rule identifies removal of Just in time VM access policies.
Note: if you receive a parse error, intellisense may have added values to your query. Ensure the query matches otherwise paste the query into notepad and then from notepad to the rule query.
-
Configure the query scheduling and other settings as per the instructions.
-
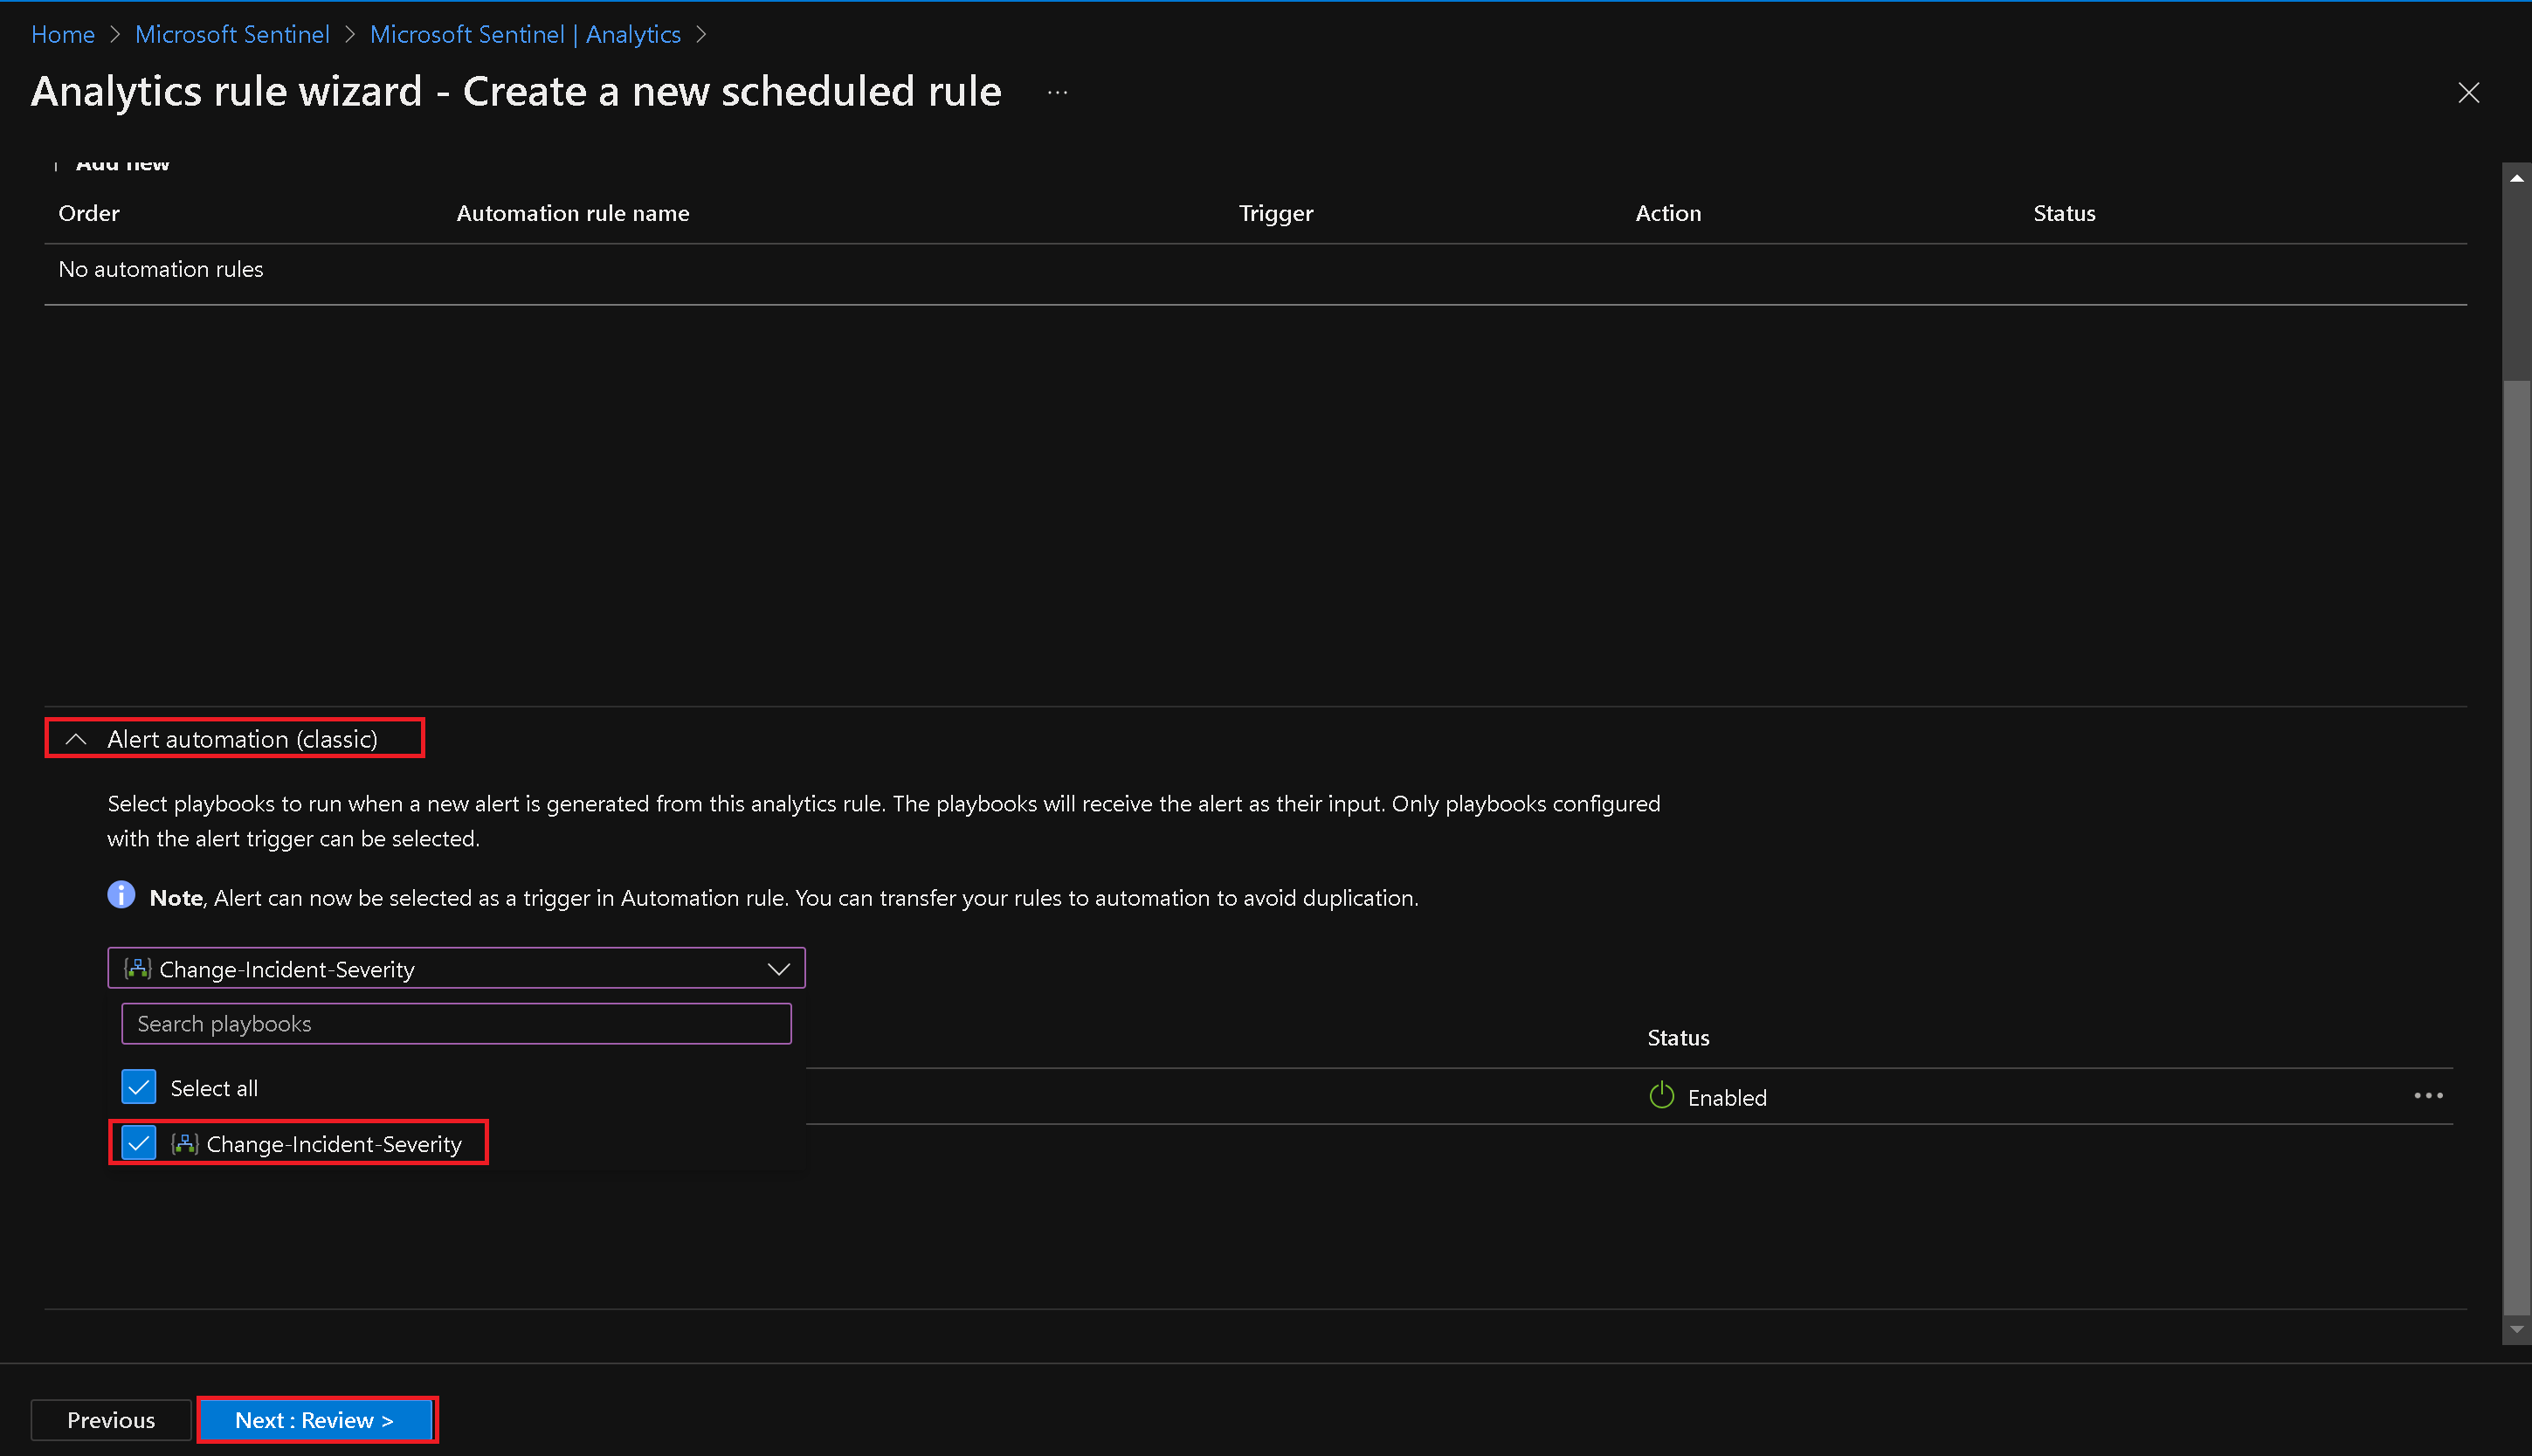
On the Automated response tab, select the checkbox next to the Change-Incident-Severity playbook in the Alert automation (classic) dropdown list.
- Review the settings and click "Create" to activate the rule.
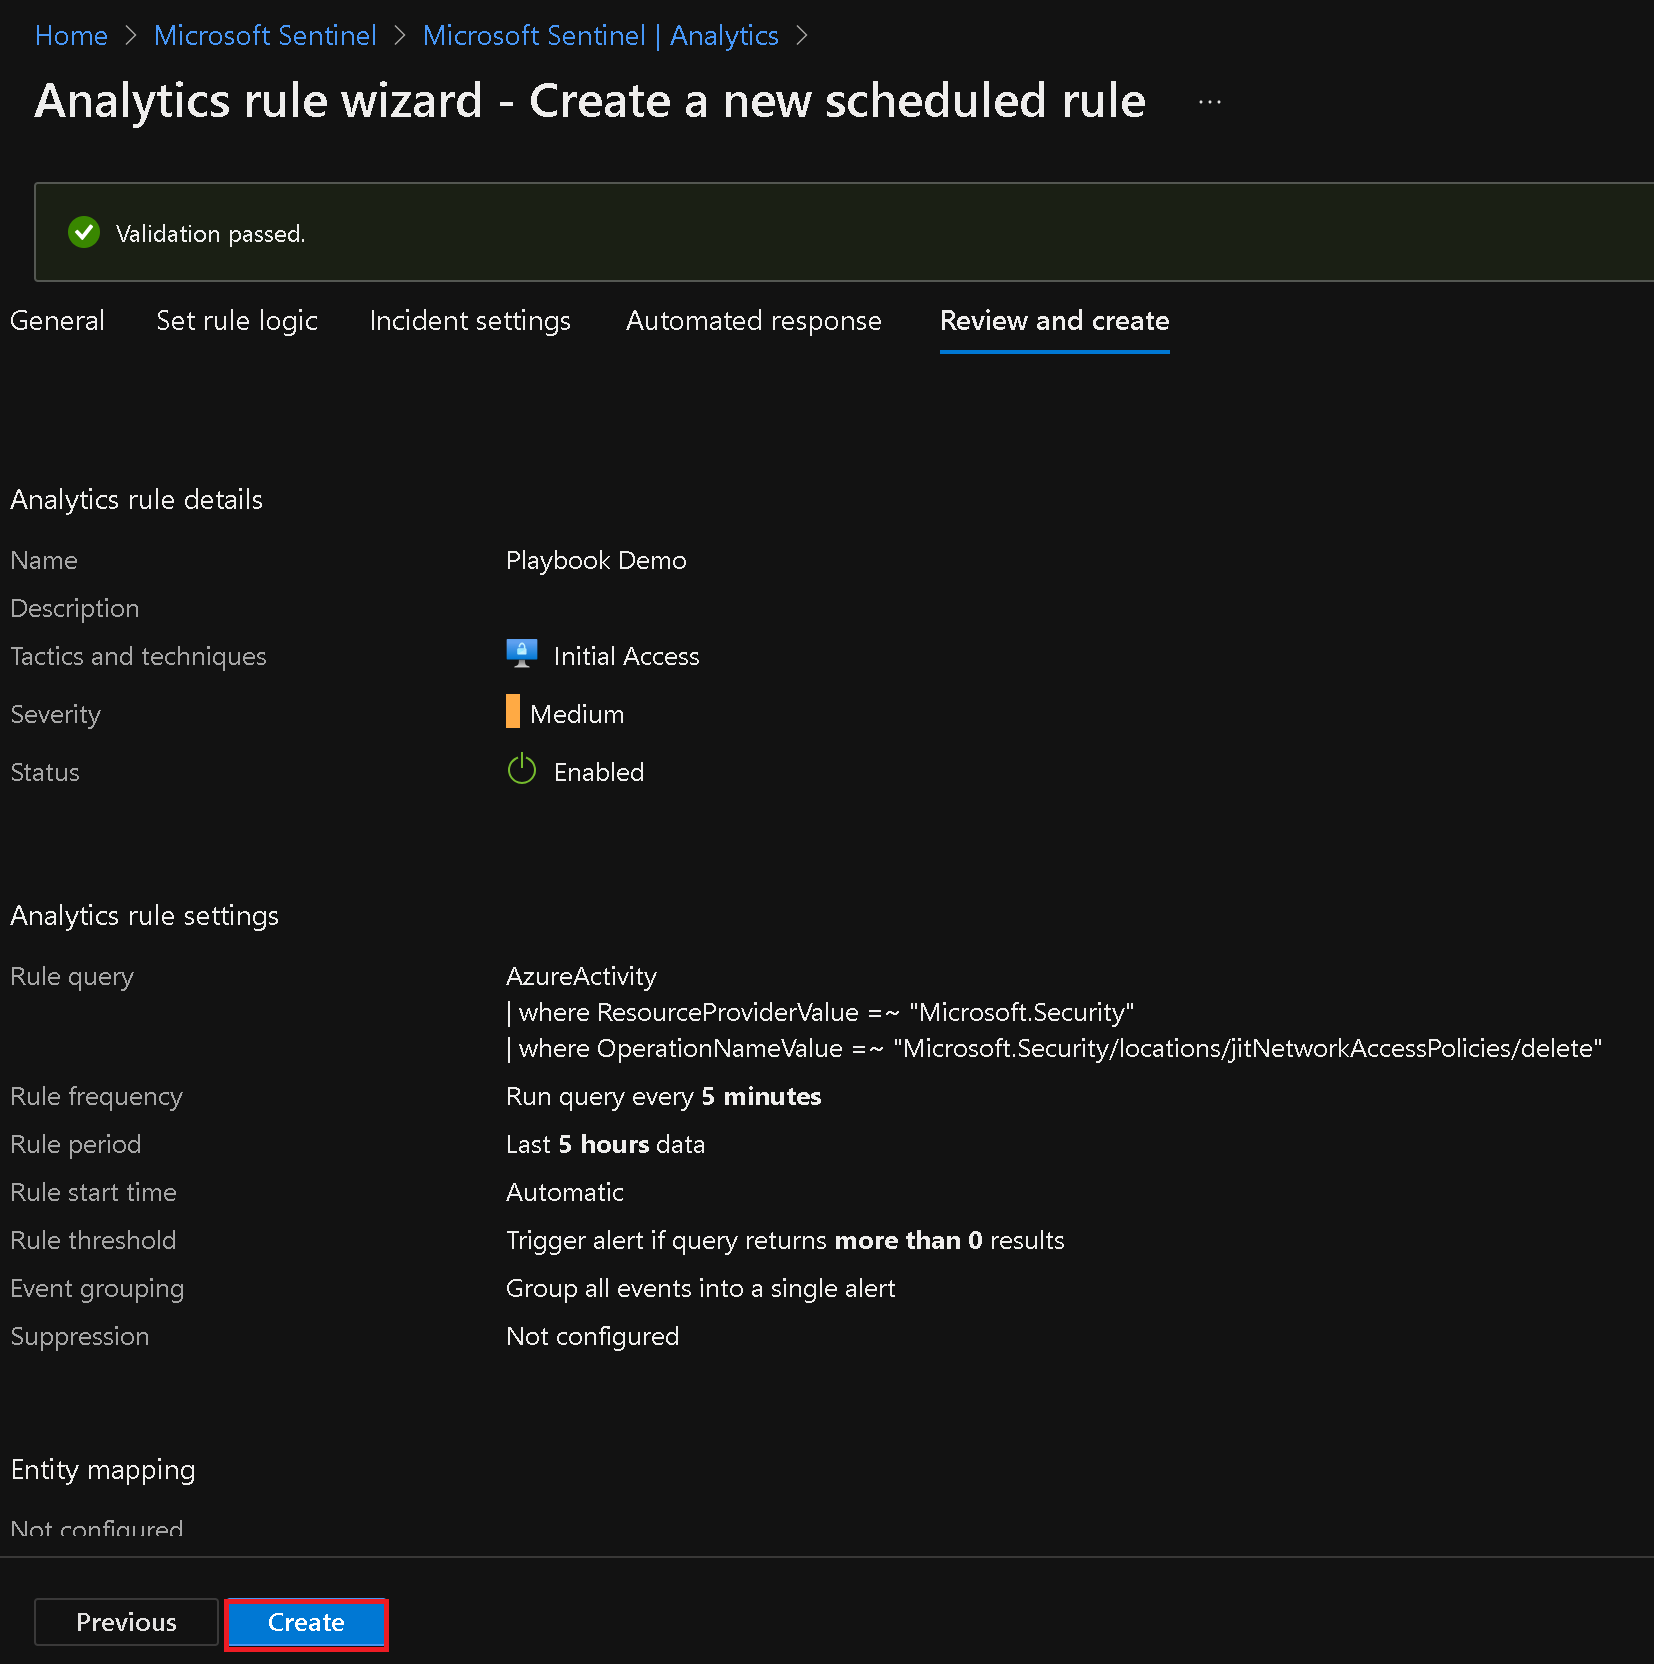
Note: You now have a new active rule called Playbook Demo. If an event identified by the rue logic occurs, it will result in a medium severity alert, which will generate a corresponding incident.
Task 6: Invoke an incident and review the associated actions
-
Open the Azure portal and navigate to the "Microsoft Defender for Cloud | Overview" blade.
-
Verify your secure score, which should have been updated by now.
-
Go to the "Microsoft Defender for Cloud | Workload protections" blade.
-
Under the "Advanced protection" section, click on "Just-in-time VM access."
-
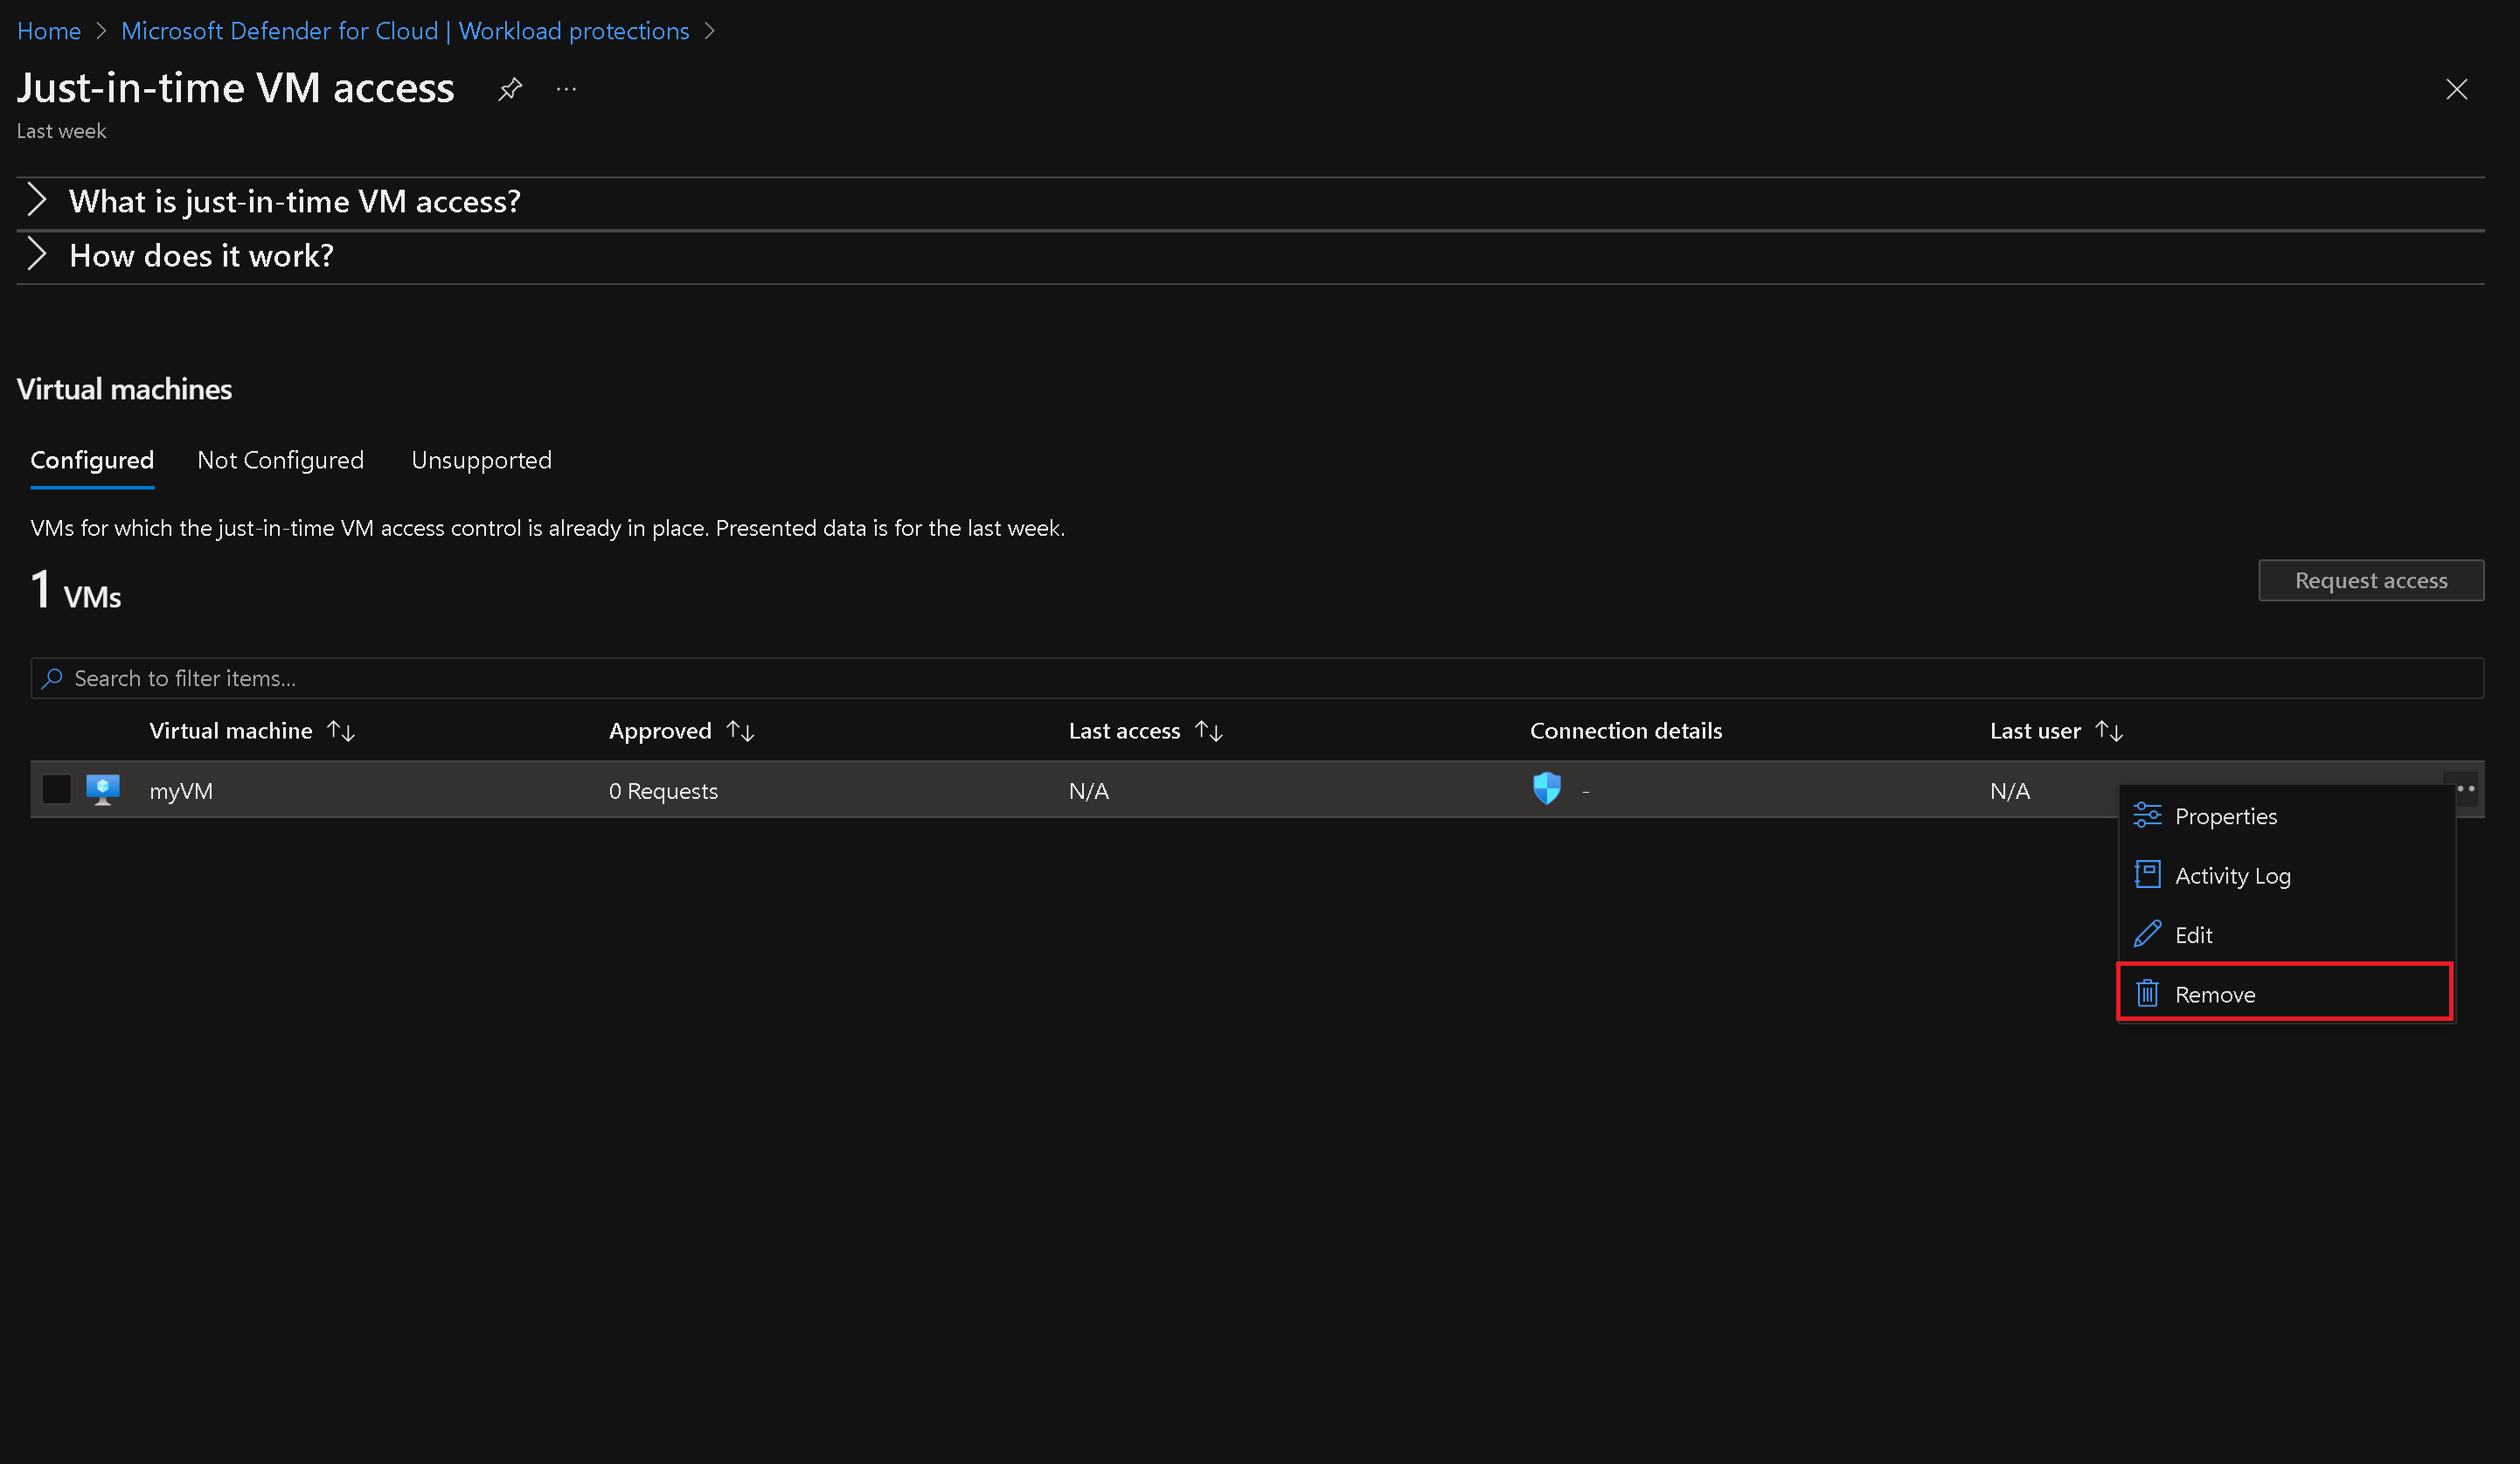
On the "Microsoft Defender for Cloud | Just in time VM access" blade, locate the row corresponding to the target virtual machine (e.g., myVM).
-
Click the ellipses button on the right-hand side of the row, select "Remove," and confirm by clicking "Yes."
Note: If the VM is not listed in the "Just-in-time VMs," go to the "Virtual Machine" blade, click on "Configuration," enable the "Just-in-time VMs" option under the Just-in-time VM's access, and repeat the previous step after navigating back to the "Microsoft Defender for Cloud" blade.
-
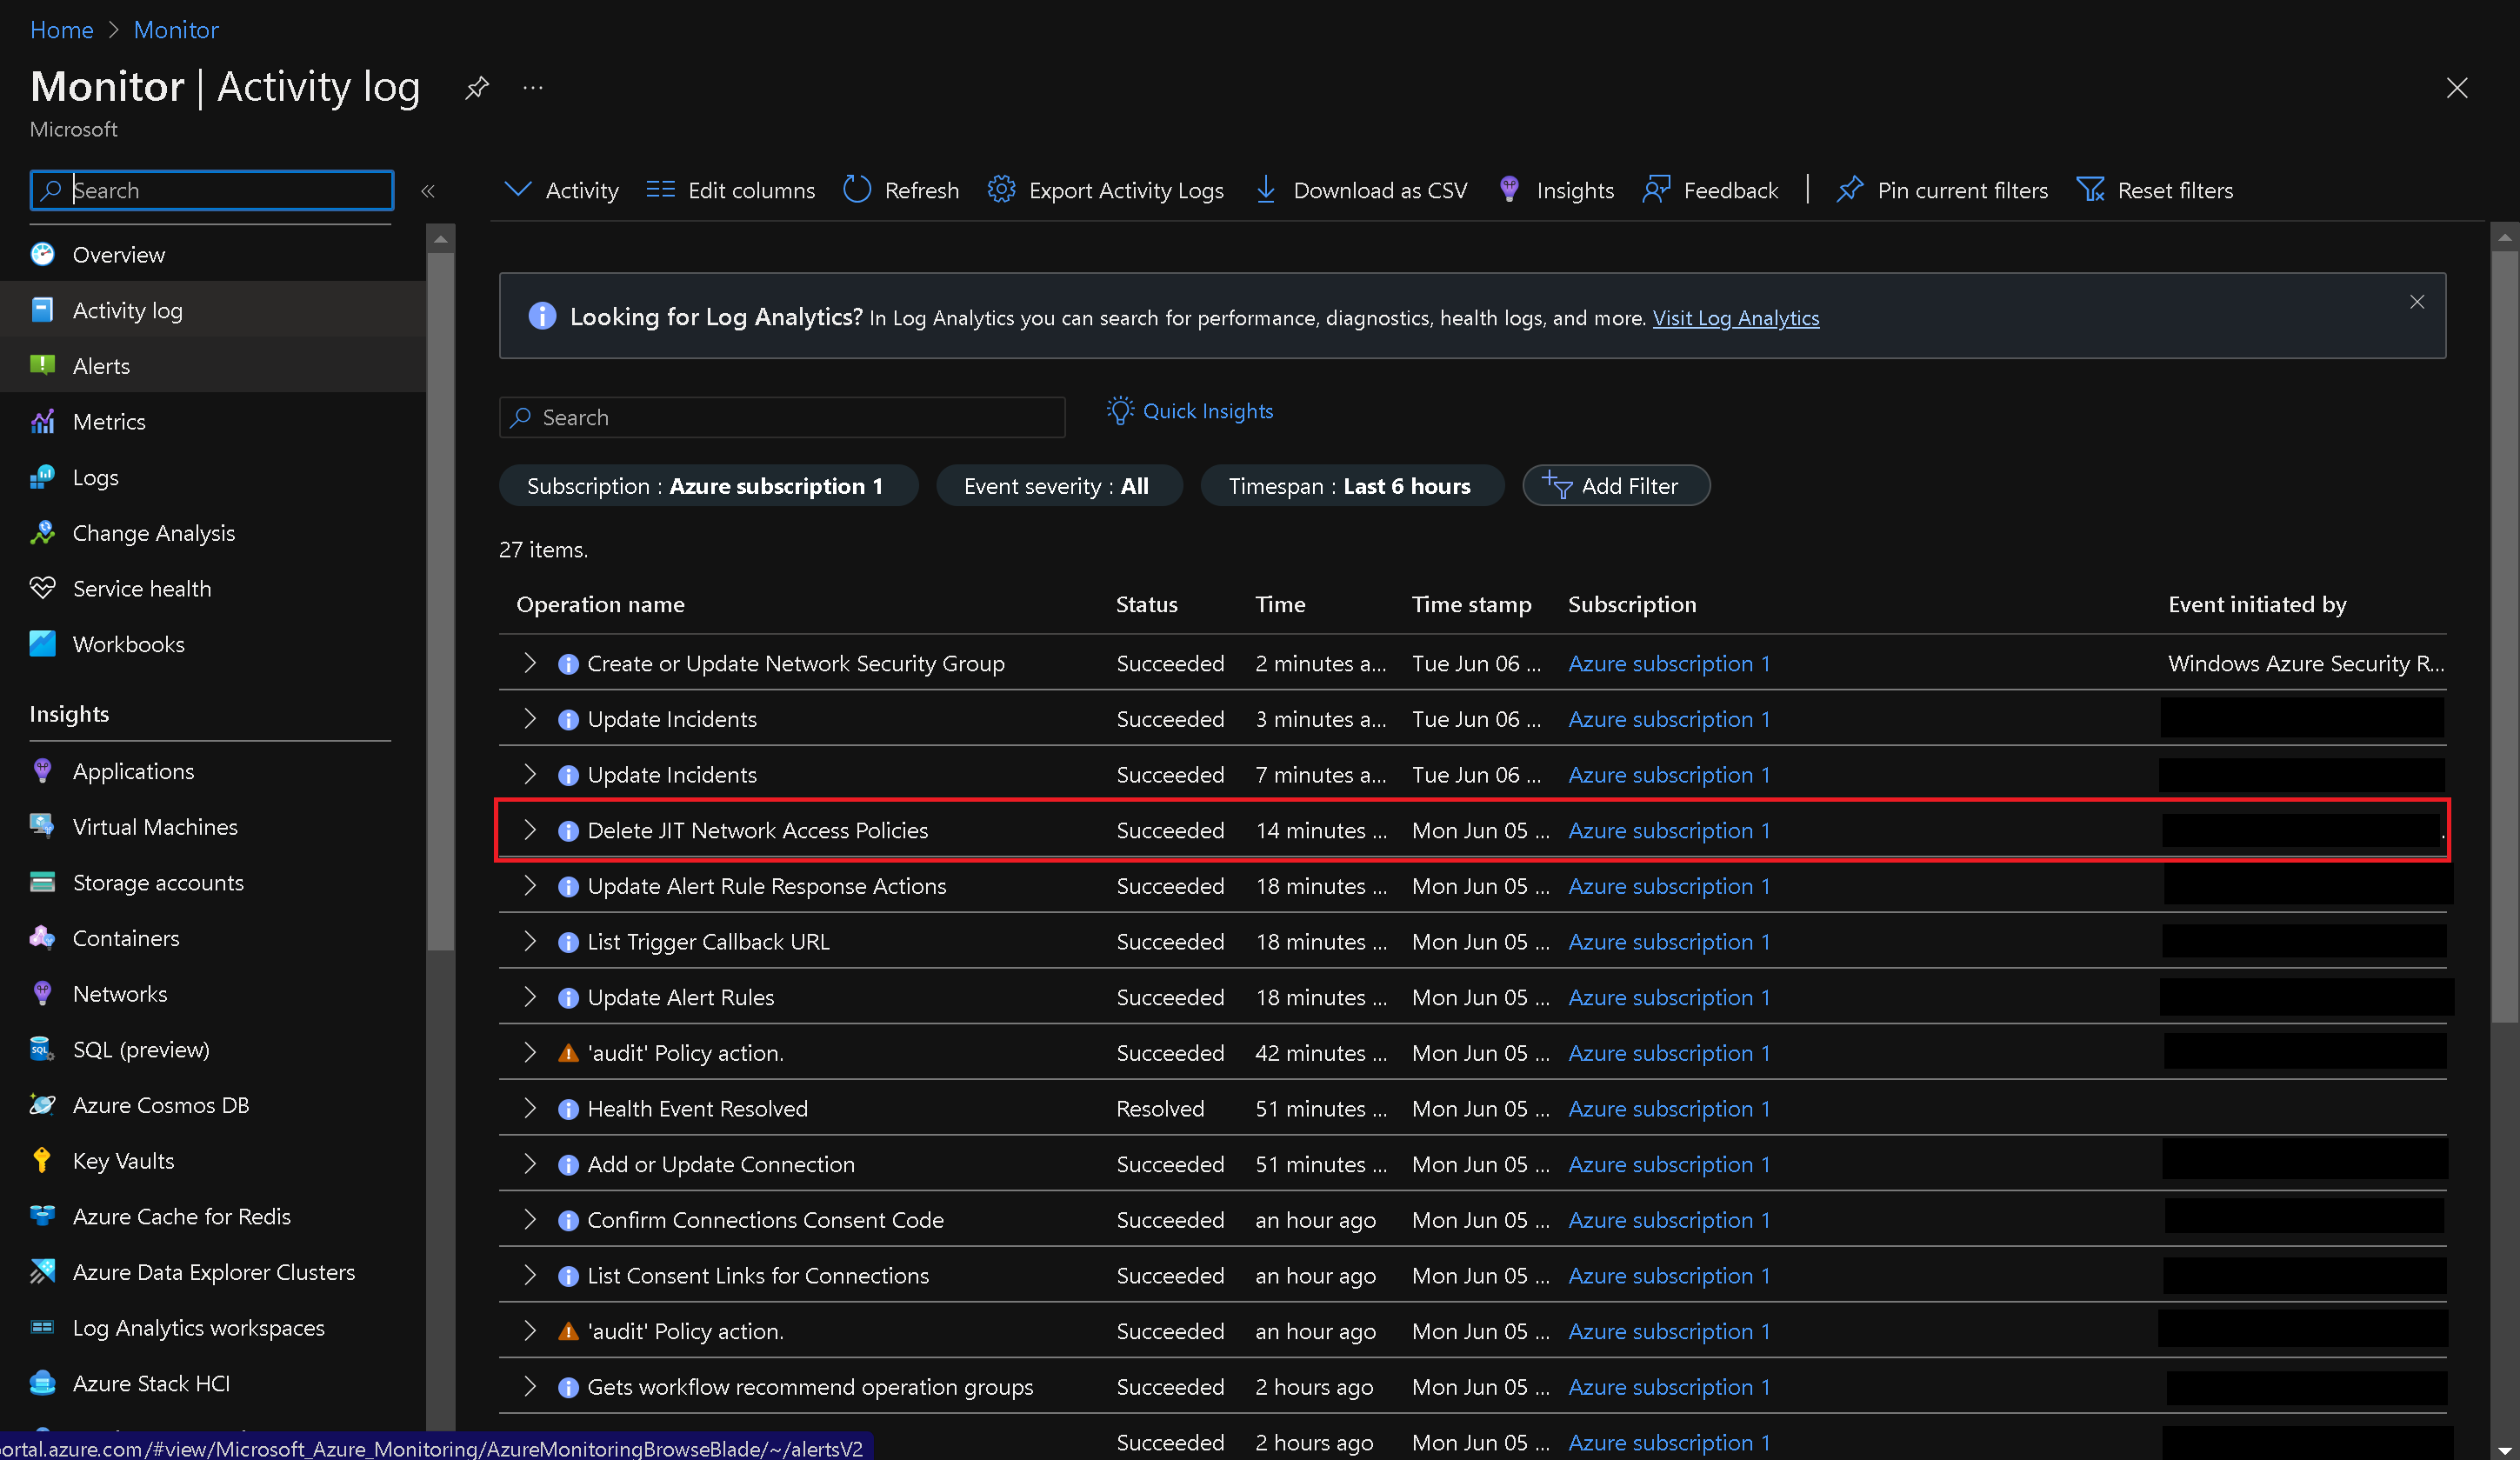
In the Azure portal, use the search box at the top to type "Activity log" and press Enter.
-
Navigate to the "Activity log" blade and look for an entry indicating the deletion of JIT Network Access Policies. Please note that it may take a minute to appear.
-
Go back to the Azure portal and navigate to the "Microsoft Sentinel | Overview" blade.
-
Review the dashboard on the "Microsoft Sentinel | Overview" blade and verify if it displays an alert corresponding to the deletion of the Just-in-time VM access policy.
Note: It may take up to 5 minutes for alerts to appear. If you don't see an alert, run the query rule mentioned in the previous task to check if the Just-in-Time access policy deletion activity has been propagated to the Log Analytics workspace associated with your Microsoft Sentinel instance. If not, recreate the Just-in-time VM access policy and repeat the deletion step.
-
In the "Threat Management" section of the "Microsoft Sentinel | Overview" blade, click on "Incidents."
-
Verify that the "Incidents" blade displays an incident with either medium or high severity level.
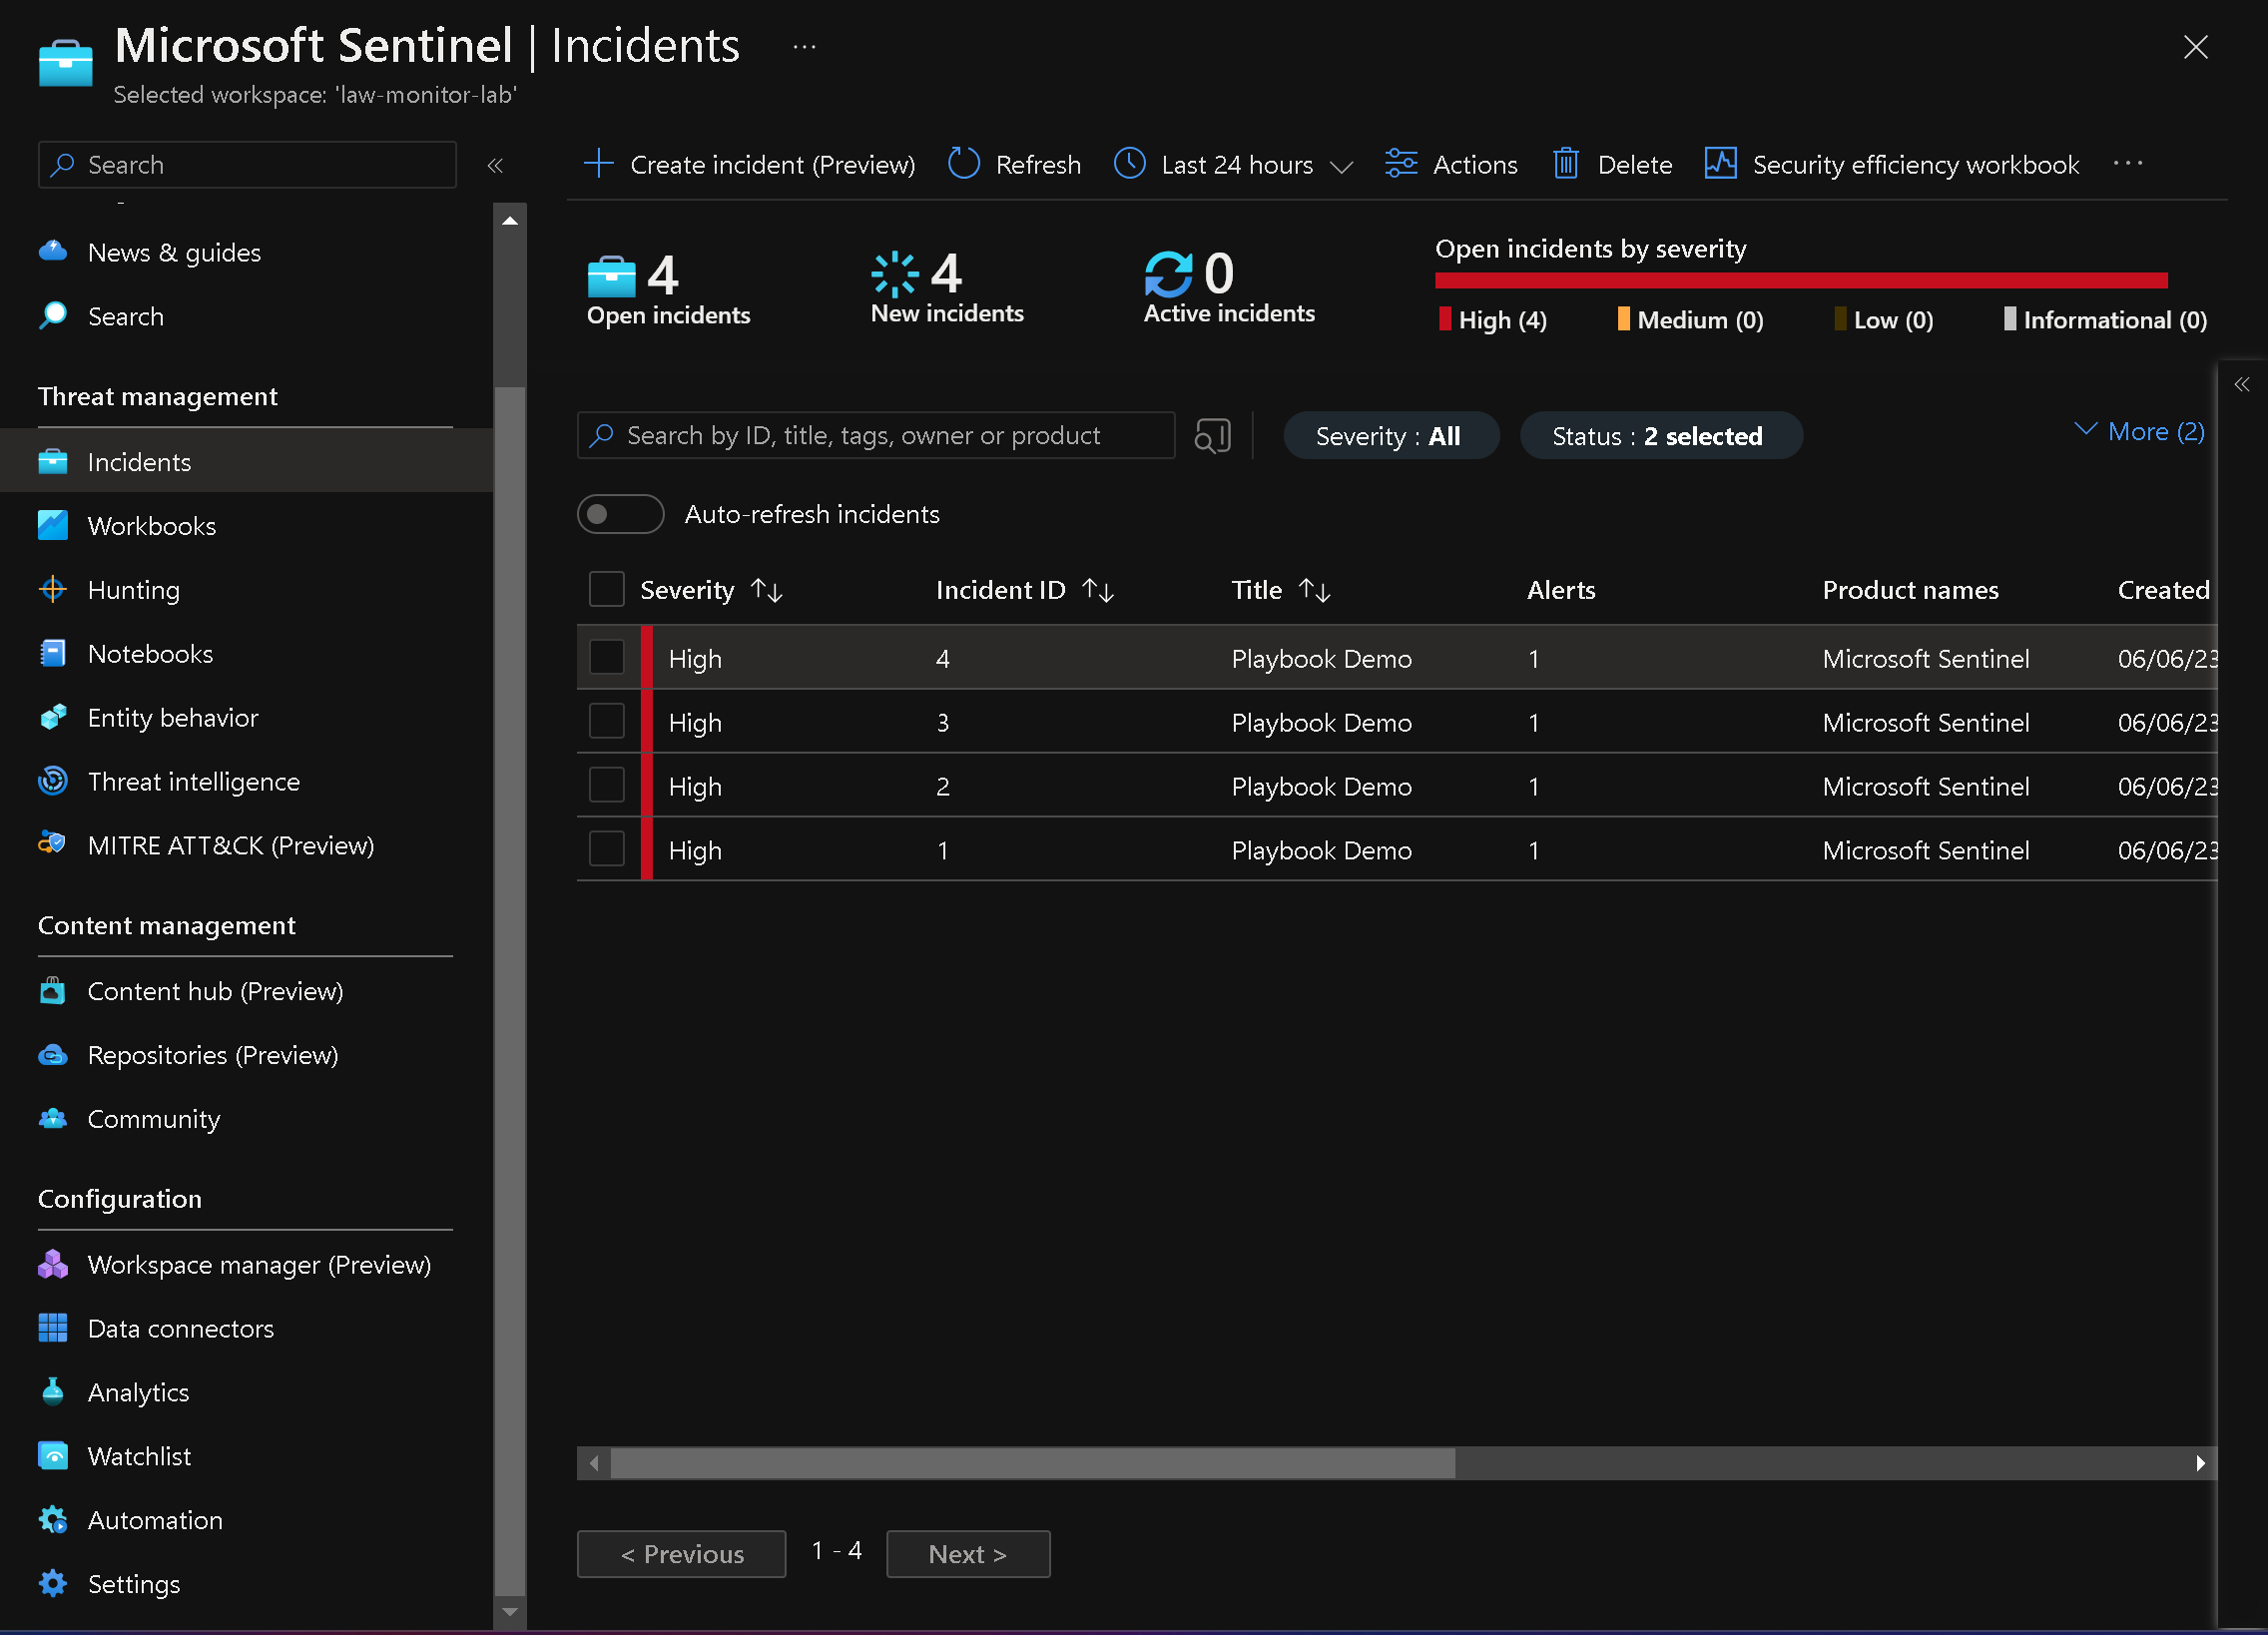
Note: It may take up to 5 minutes for the incident to appear on the "Microsoft Sentinel | Incidents" blade.
- Take a look at the "Microsoft Sentinel | Playbooks" blade to see the count of successful and failed playbook runs.
Note: You have the option to assign a different severity level and status to an incident.
Results: You have successfully simulated an incident by removing a Just-in-Time VM access policy. You have also reviewed the associated alerts and incidents in Microsoft Sentinel. This exercise confirms that you have created a Microsoft Sentinel workspace, connected it to Azure Activity logs, created a playbook, and set up custom alerts triggered by the removal of Just-in-Time VM access policies. You have validated the configuration.
Clean up resources:
Remember to remove any Azure resources that are no longer needed to avoid unexpected costs.
-
In the Azure portal, click the first icon in the top right to open the Cloud Shell.
-
If prompted, select PowerShell and create storage.
-
Ensure that PowerShell is selected in the drop-down menu in the upper-left corner of the Cloud Shell pane.
-
Run the following command in the PowerShell session within the Cloud Shell pane to remove the resource group created in this lab:
Remove-AzResourceGroup -Name "AZ500LAB131415" -Force -AsJob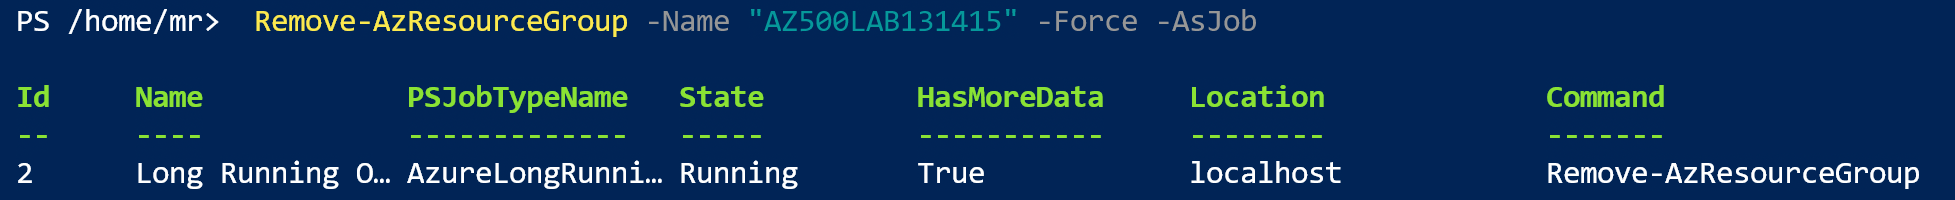
- Close the Cloud Shell pane.
Reflection
In this lab, I successfully completed the on-boarding and configuration of Microsoft Sentinel in Azure. I followed a step-by-step process to connect the Log Analytics workspace and configure the Azure Activity data connector. I also created a rule that utilizes the Azure Activity data connector and set up a playbook for automated response. Additionally, I created a custom alert and associated it with the playbook. Finally, I invoked an incident and reviewed the actions taken by Microsoft Sentinel. Overall, this lab provided hands-on experience in setting up Azure Sentinel and leveraging its capabilities for threat detection and response.
Closing
By completing this lab, I have gained practical knowledge in on-boarding Azure Sentinel and configuring its essential components. Azure Sentinel offers powerful capabilities for security monitoring and response, and this lab has equipped us with the skills to leverage its features effectively. I've learned how to connect data sources, create rules, set up automated responses, and review incidents. This knowledge will be valuable in enhancing our organization's security posture and strengthening our ability to detect and respond to threats effectively.