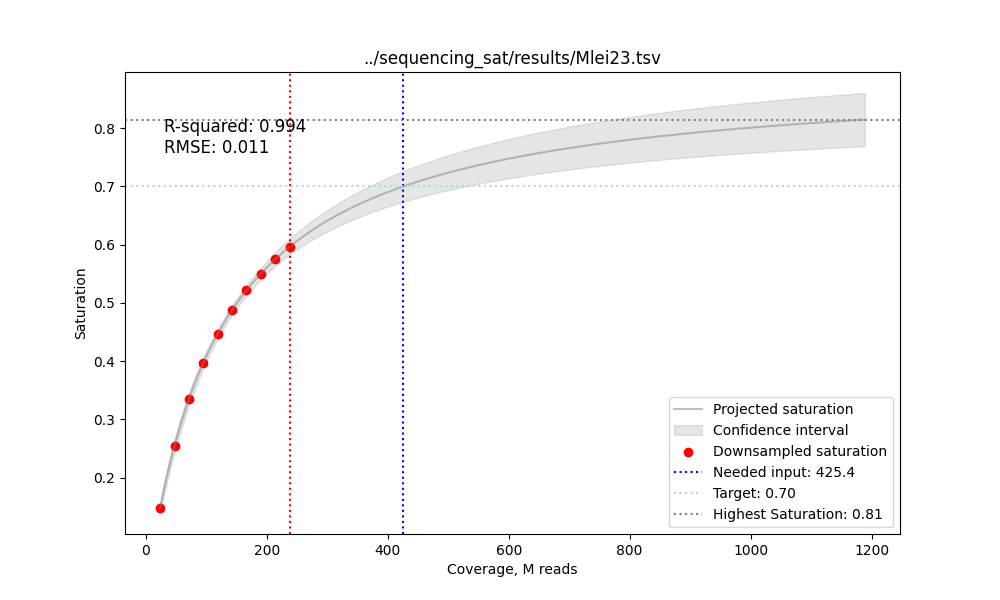
This script subsamples the .bam file and fits the saturation curve based on the amount of input reads. For the estimation to be precise, the mapping rate and the number of cells should be supplied.
CAVE: the model tends to overestimate the coverage needed.
Example toy dataset: 1000 cells, 80% mapping rate
Downsample the reads, extract the tags and compute saturation stats (use -c to use more cores):
python saturation_table.py -b test/sample.bam -n 1000 -r 0.8 -o output.tsvCAVE: this creates a big tabular file
Fit the MM model, predict the number of input reads for --target saturation and plot:
python scripts/plot_curve.py output.tsv saturation.png --target 0.7 output.tsv - contains the sequencing saturation statistics for to 10 (-s) subsampling steps
saturation.png - contains the plot of the saturation curve
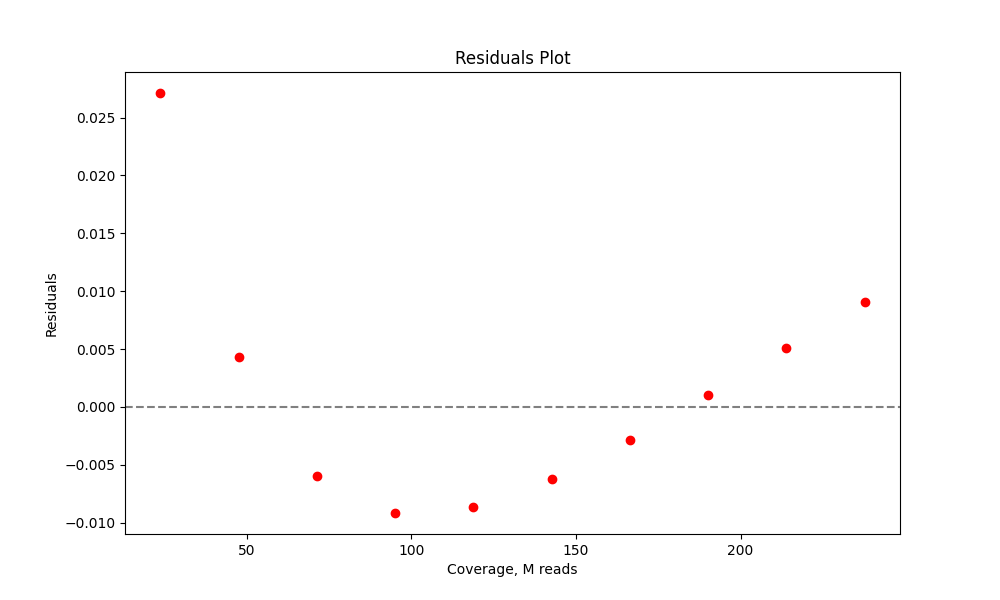
It's useful to examine residuals plot to see if the model tends to over or underestimate the coverage needeed.
The saturation can in principle be estimated from the reads coming from a subset of chromosomes.
TODO: add speed vs estimated saturation plot
__TODO: add residuals! __

