This is a DAP-based JavaScript debugger. It debugs Node.js, Chrome, Edge, WebView2, VS Code extensions, and more. It has been the default JavaScript debugger in Visual Studio Code since 1.46, and is gradually rolling out in Visual Studio proper.
The shipped version of VS Code includes the js-debug version at the time of its release, however you may want to install our nightly build to get the latest fixes and features. The nightly build runs at 5PM PST on each day that there are changes (see pipeline). To get the build:
- Open the extensions view (ctrl+shift+x) and search for
@builtin @id:ms-vscode.js-debug - Right click on the
JavaScript Debuggerextension andDisableit. - Search for
@id:ms-vscode.js-debug-nightlyin the extensions view. - Install that extension.
In js-debug we aim to provide rich debugging for modern applications, with no or minimal configuration required. Here are a few new features that js-debug brings:
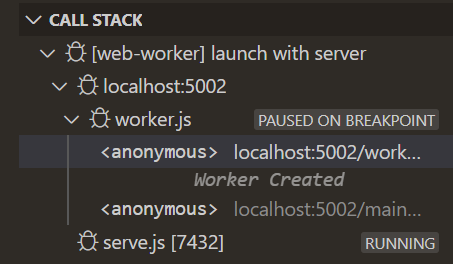
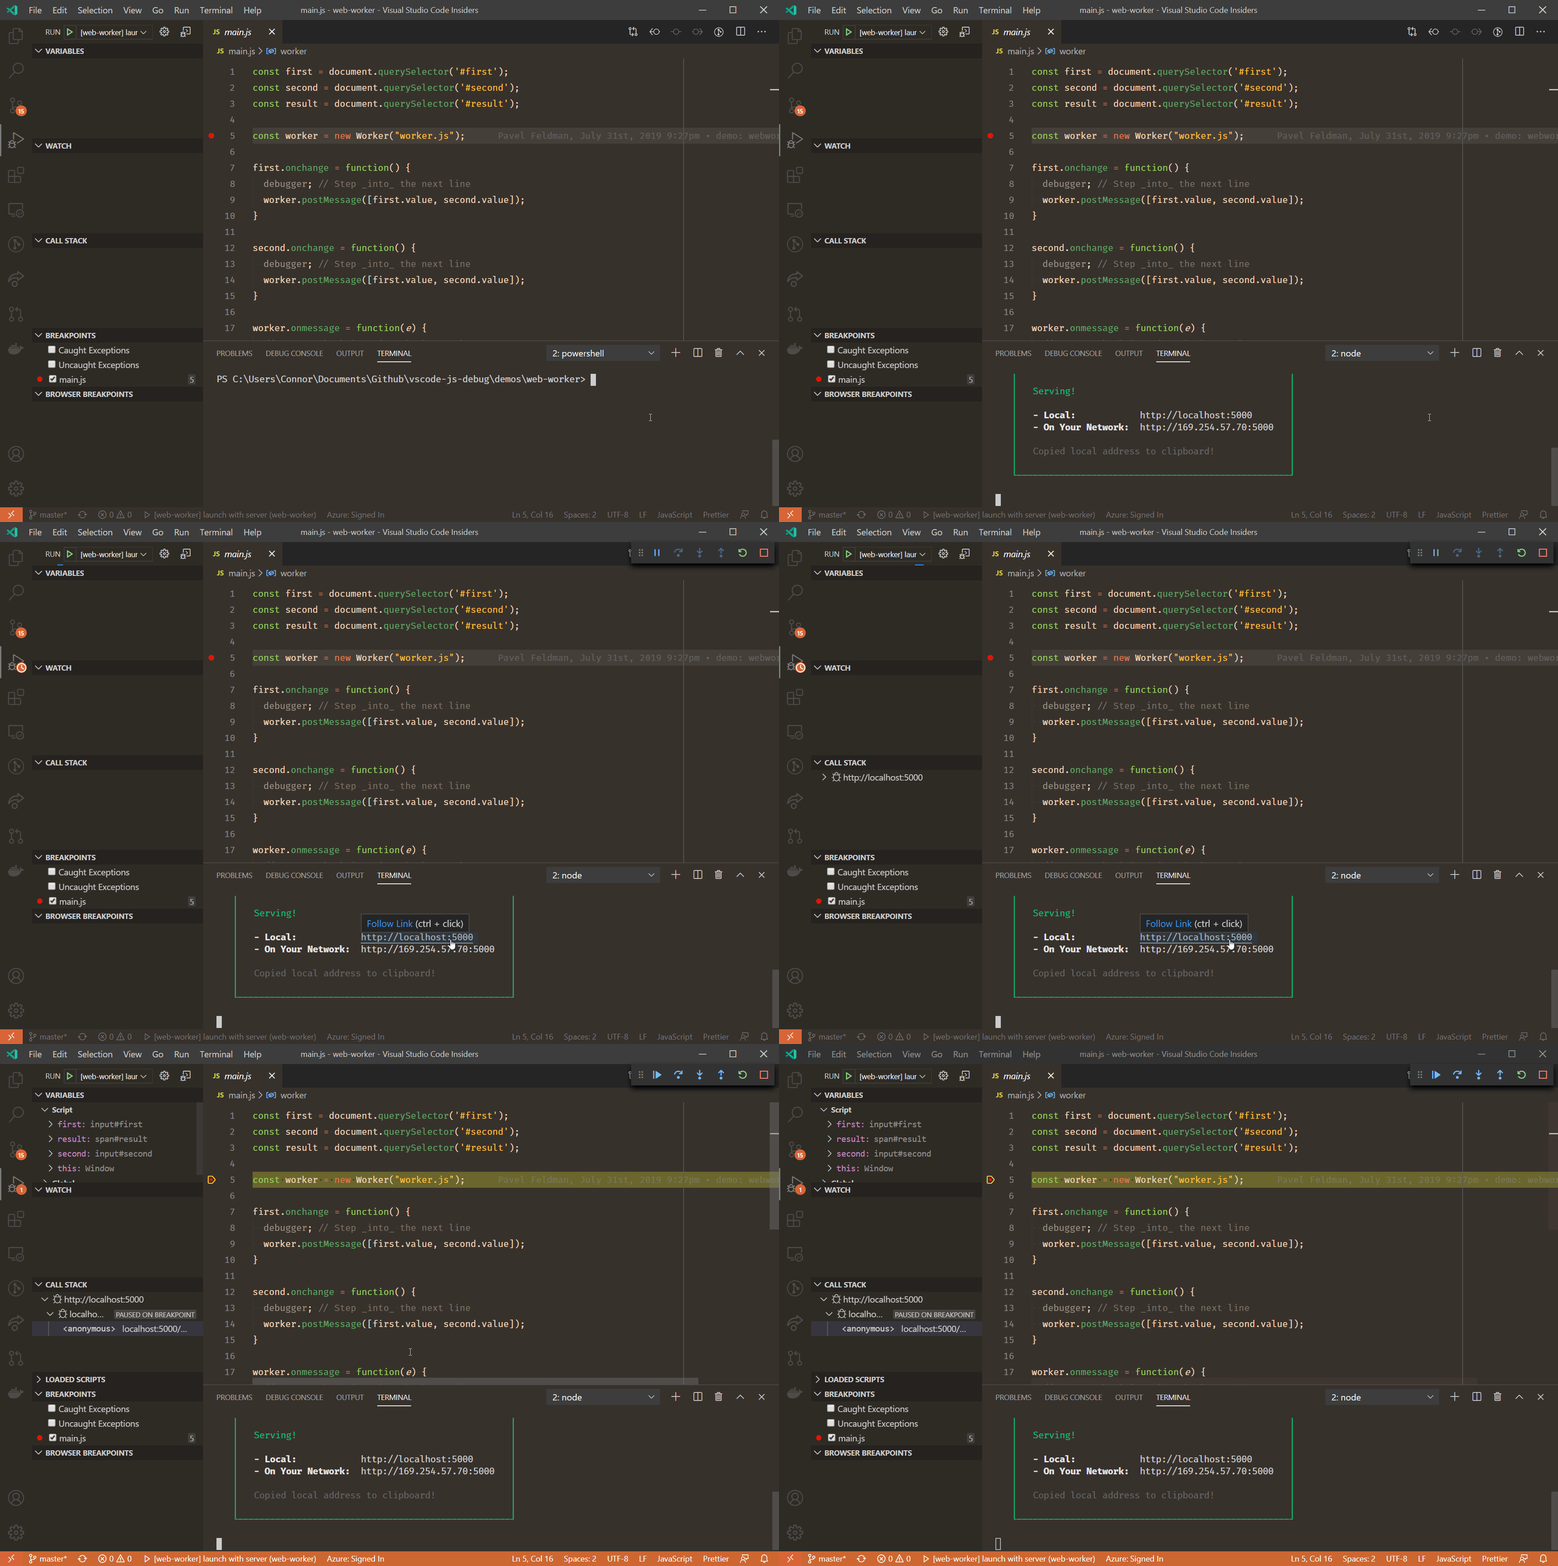
In Node.js, child processes will automatically be debugged. In browsers, service workers, webworkers, and iframes will be debugged as well.
While debugging workers, you can also step through postMessage() calls.
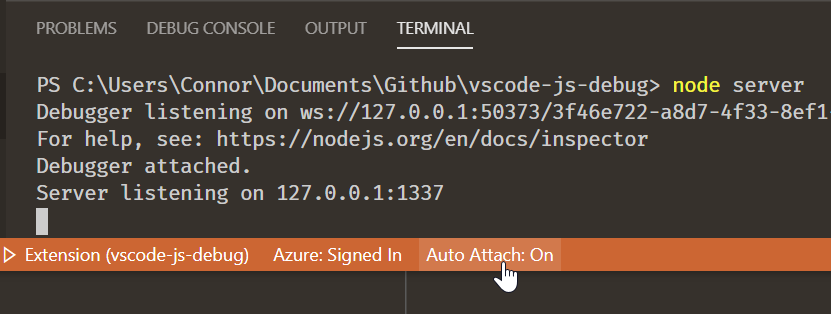
You can debug any Node.js process you run in the terminal with our revamped Auto Attach. If auto attach isn't on, you can run the command Debug: Toggle Auto Attach to turn it on. Next time you run a command like npm start, we'll debug it.
Once enabled, you can toggle Auto Attach by clicking the Auto Attach: On/Off button in the status bar on the bottom of your screen.
You can also create a one-off terminal for debugging via the Debug: Create JavaScript Debug Terminal command.
In the previous debugger, you had to remember to add the --inspect flag when you ran a command, and couldn't hit breakpoints early in the program since attachment was asynchronous.
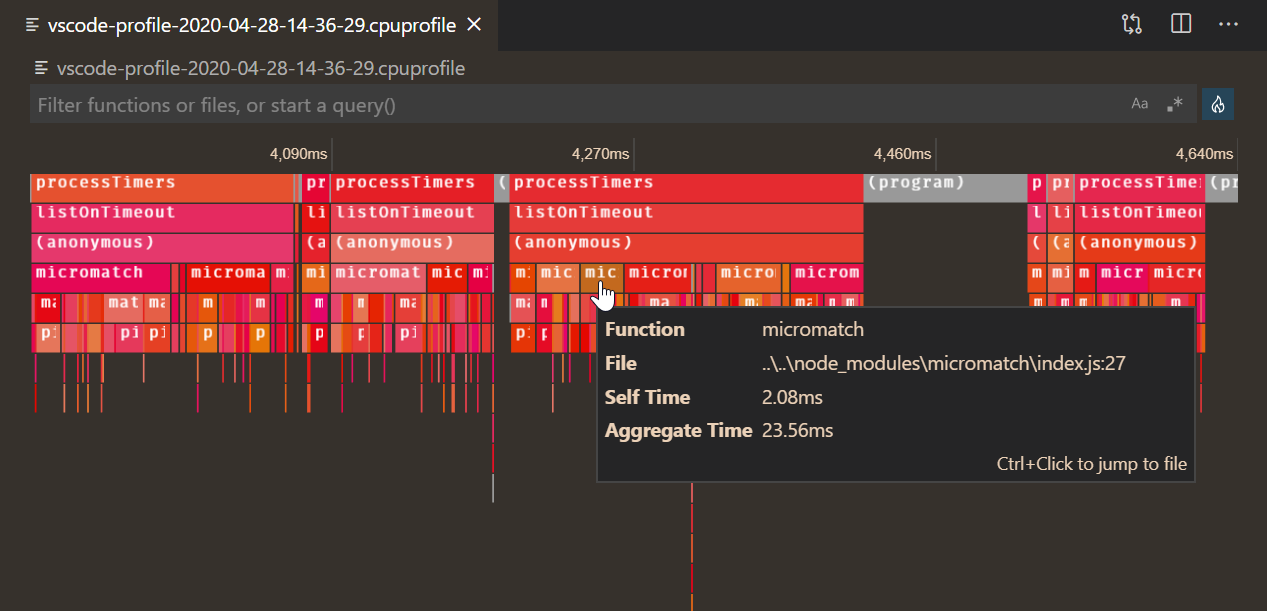
You can capture and view performance profiles natively in VS Code, by clicking on the ⚪ button in the Call Stack view, or through the Debug: Take Performance Profile command. The profile information collected through VS Code is sourcemap-aware.
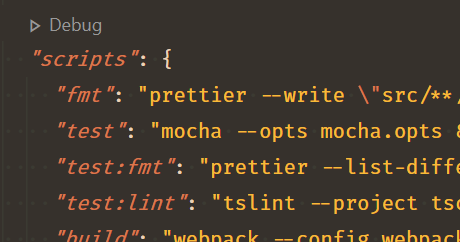
You can debug npm scripts by clicking the code lens shown in the package.json, or by running the Debug: Debug NPM Script command/
You can configure where and if the code lens is displayed in the debug.javascript.codelens.npmScripts setting.
By default, any links you click through the JavaScript debug terminal (Debug: Create JavaScript Debug Terminal command) will open in debug mode. If you'd like, you can enable this for all terminals, or disable it, by setting debug.javascript.debugByLinkOptions to always or off, respectively.
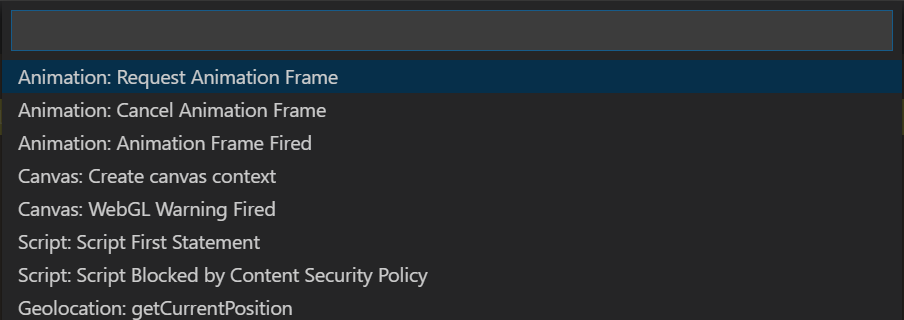
When debugging web apps, you can configure instrumentation breakpoints from VS Code in the "Browser Breakpoints" view.
Autocomplete in the debug console has been significantly improved. You can expect better suggestions for more complex expressions than VS Code was able to handle before.
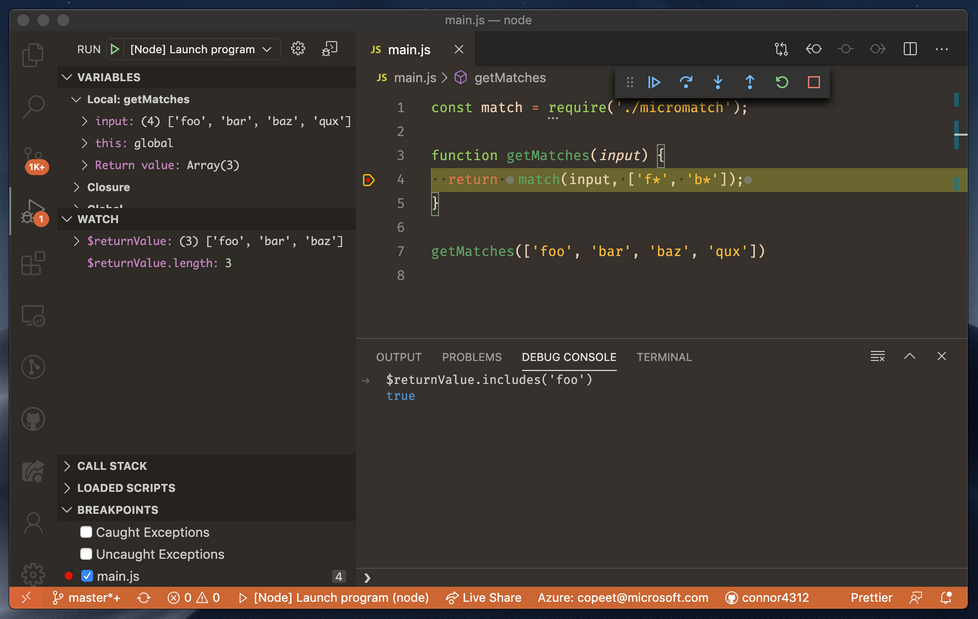
On a function's return statement, you can use, inspect, and modify the $returnValue.
Note that you can use and modify properties on the $returnValue, but not assign it to--it is effectively a const variable.
You can use await at the top level in the debug console.
However, like the Chrome devtools, if you use await while paused on a breakpoint, you'll only get a pending Promise back. This is because the JavaScript event loop is paused while on a breakpoint.
The debugger can now pretty print files, especially useful when dealing with minified sources. It will show a prompt when you step into or open a file that looks minified, and you can also trigger pretty printing manually via the Debug: Pretty print for debugging command.
You can turn off the suggestion prompt by selecting Never, or changing the setting debug.javascript.suggestPrettyPrinting to false.
We support launching the new Microsoft Edge browser, via the pwa-msedge debug type. It supports all the same configuration settings as chrome does.
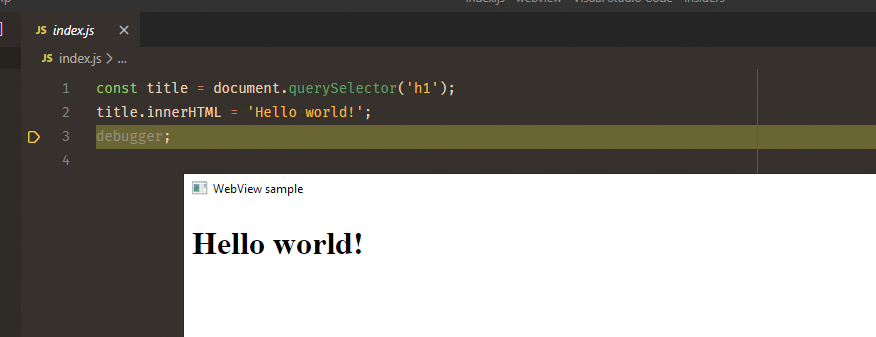
With this comes support for the WebView2 control in desktop Windows applications. Check out our webview demo to learn how to set this up.
Js-debug has a rewritten suite of sourcemap handling and breakpoint resolution logic. This results in more reliable breakpoint behavior in more cases. For example:
- We are guaranteed to set breakpoints before hitting them, where there were previously scenarios where this did not happen.
- We can handle sources present in multiple compiled files. This is common when dealing with split bundles in web apps.
- We now support in-place transpilation (such as
ts-nodeand@babel/register).
VS Code has long had an action to "Copy Value" from the Variables view. However, previously this was truncated for object or long values. Changes in VS Code and js-debug allow us to losslessly copy the full expressions as JSON.
js-debug is a cleanroom rewrite of a JavaScript debugger, so there are a large number of small improvements. Here are some more that are unworthy of their own heading:
- Console output is now improved. Promises, ArrayViews/ArrayBuffers, and other complex data structures are better supported.
- Logpoint breakpoints now support complex expressions and statements. Errors thrown will be printed, rather than silently eaten.
- You can now specify partial versions in the Node.js
runtimeVersion. Previously you needed to specify the full version, such as12.3.4. Now, you can specify12and we'll use the most recent12.*installed on the system. - Sourcemaps are now supported when attaching via the
Attach to Node.js Processcommand. - Several improvements have been made for faster performance and better out-of-the-box behavior in monorepos and multi-part applications.
- The
console.group()set of APIs are now supported. - You can pass
stable,canary, ordevasruntimeExecutables when launching browsers. We'll do our best to discover and use the specified version on your machine. - You can now set the Node.js
programto files with other or no extensions without workarounds. - Restart frame requests are now supported.
- Command line APIs like
inspect()andcopy()are now available.
See OPTIONS.md

