
This workshop is designed to be very hands-on, with many examples that can be extended as exercises. It would be impossible to touch everything that we could find interesting in web mapping, so the hope is that after going through these three acts you will feel empowered to swap in your own data and leverage hundreds of examples in your own data visualization projects!
This workshop will cover a collection of Javascript mapping libraries. By the end, you will gain hands-on experience with each library. We will see first-hand which tool is best for the job in a variety of different situations.
I've got the whole world, in my hands
This first part of the workshop will focus on understanding the data and quickly getting something on the screen.
First things first: we will play with basic GeoJSON on geojson.io to develop intuition for spatial data.
We can look at this example to get a relative sense of the "size" of one degree of longitude or latitude.

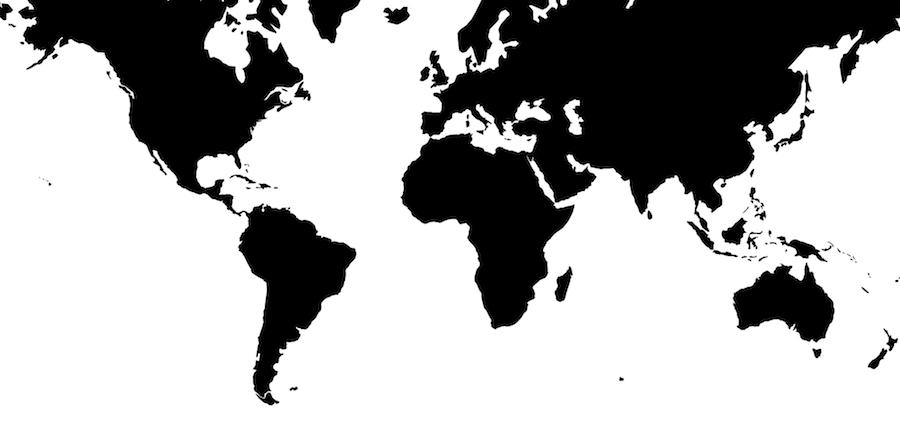
We will use a collection of datasets curated to cover a variety of locations and scales (world-wide down to city-level) in the workshop. This way, you won't feel confined to one geographic area while practicing your new web-mapping skills. Each data folder contains a README that describes where the data comes from and how it was processed:
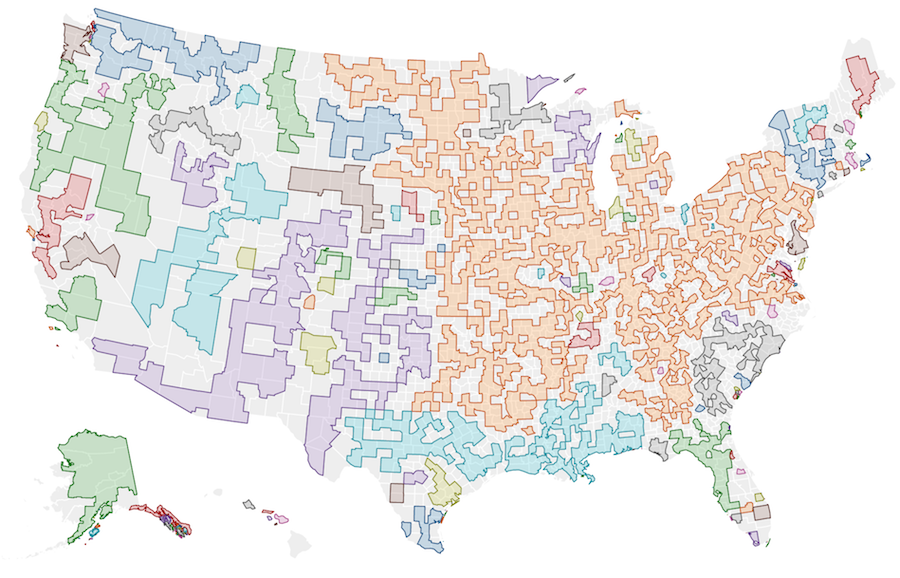
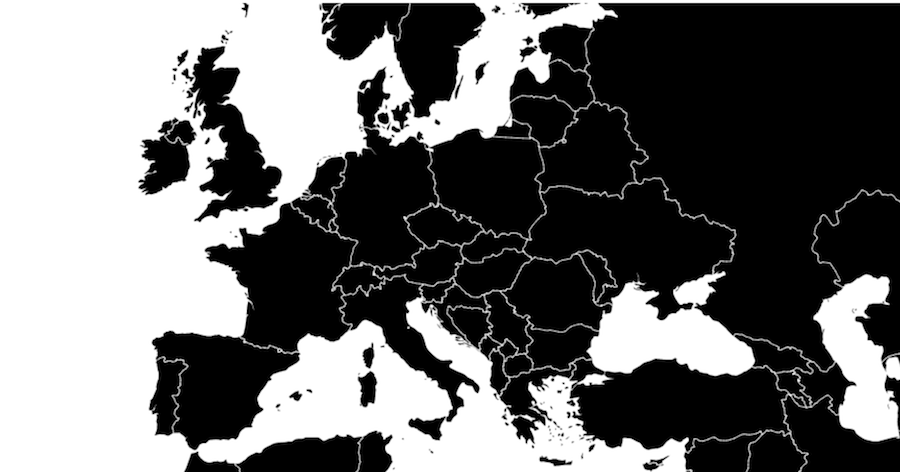
World data files
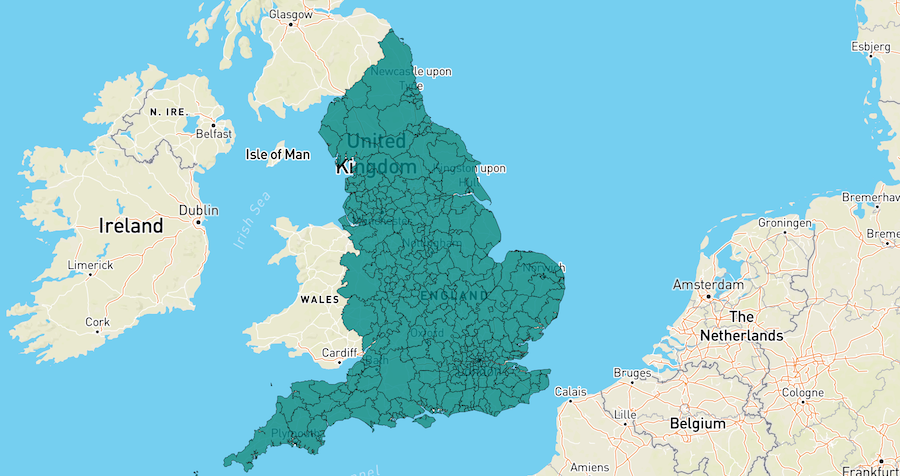
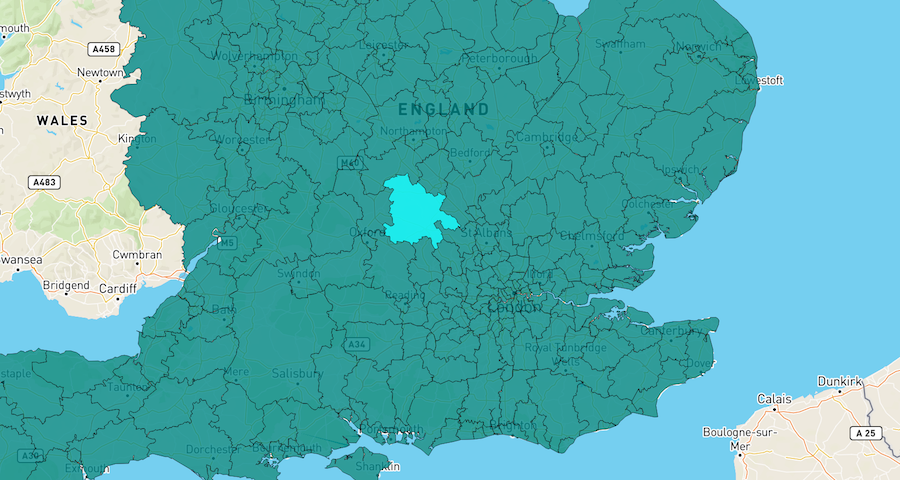
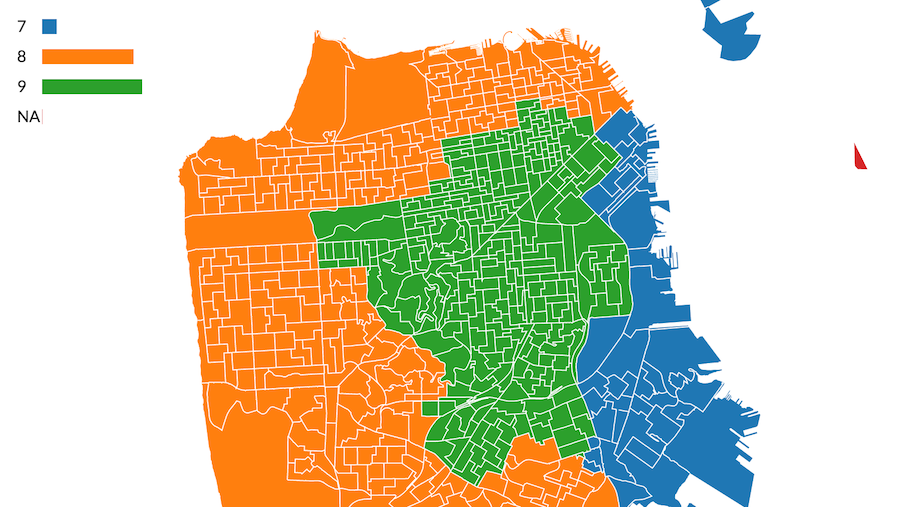
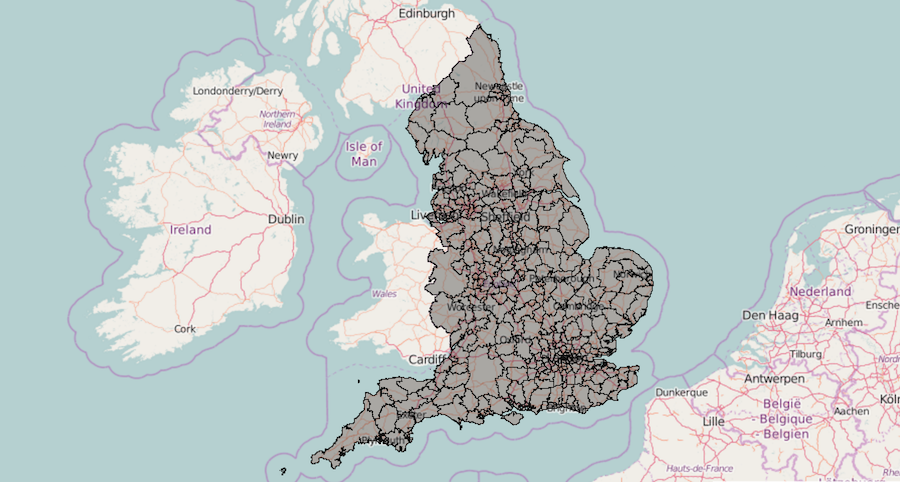
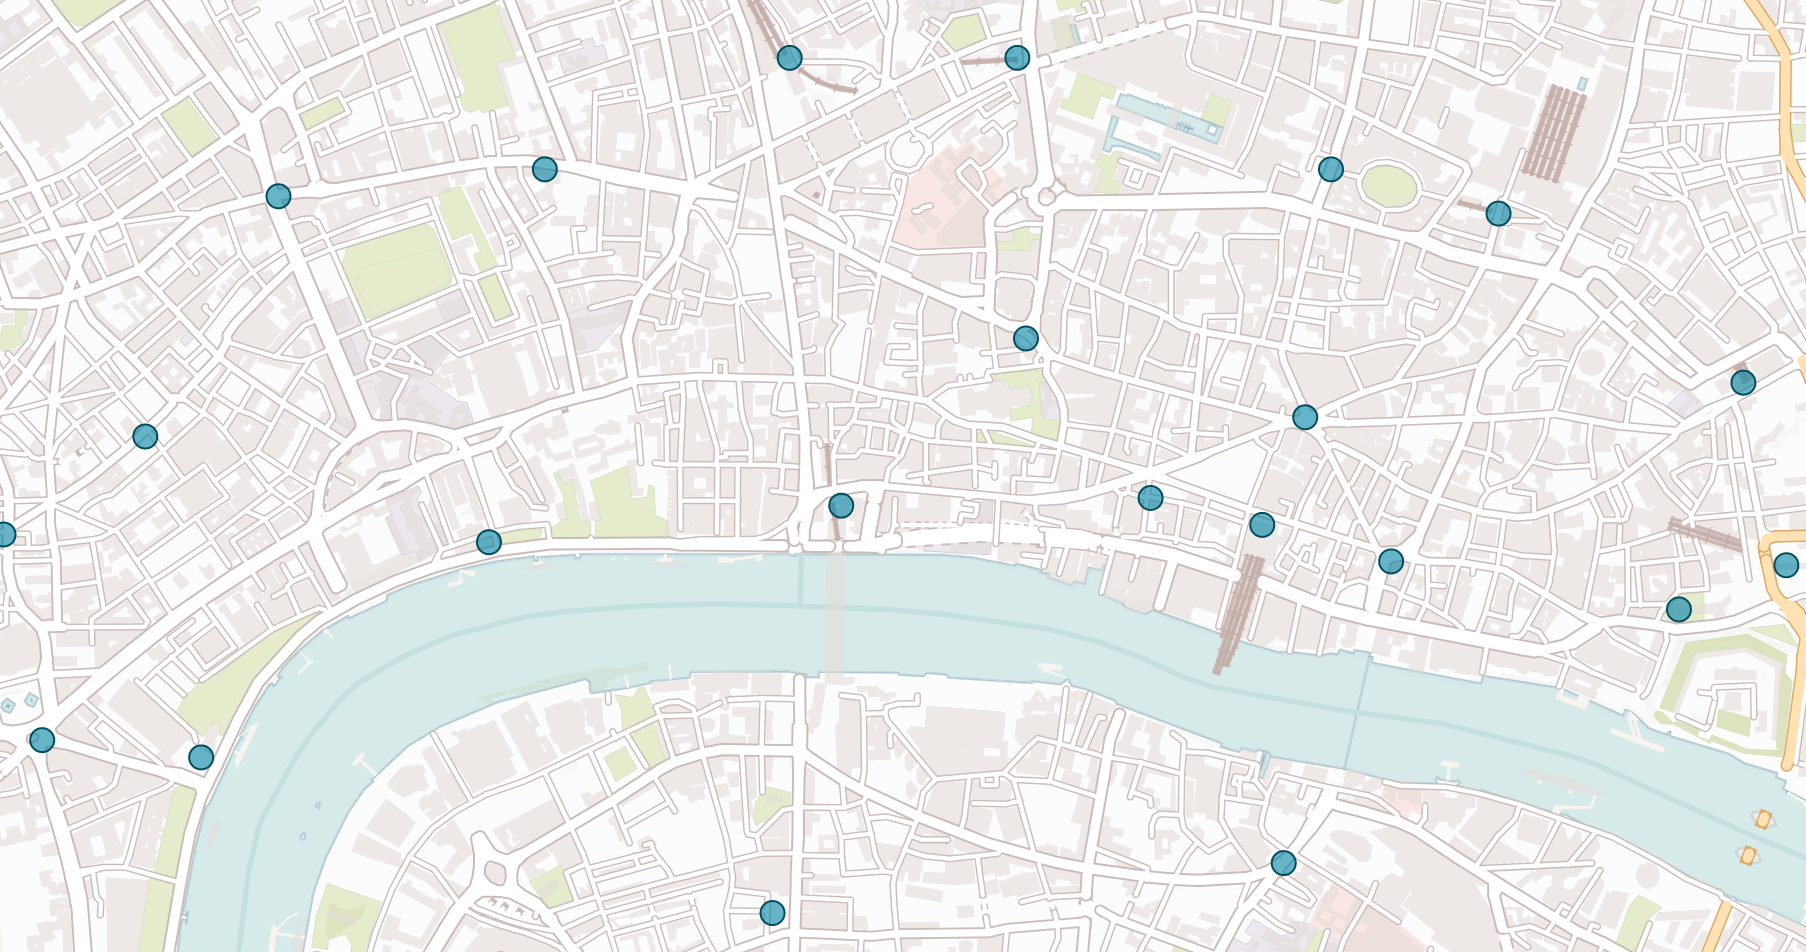
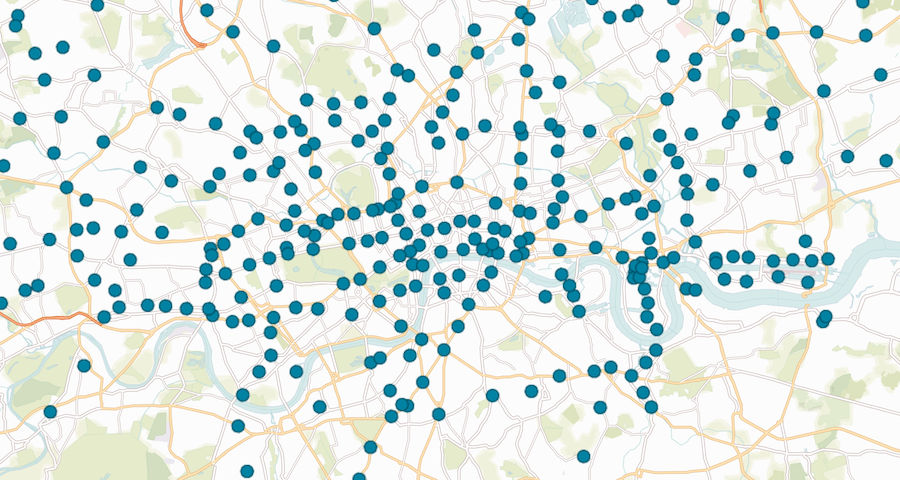
UK (London) data files
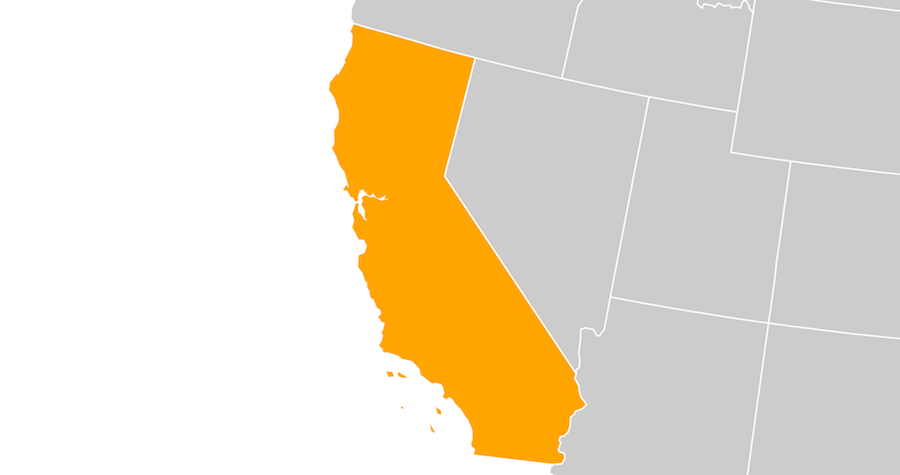
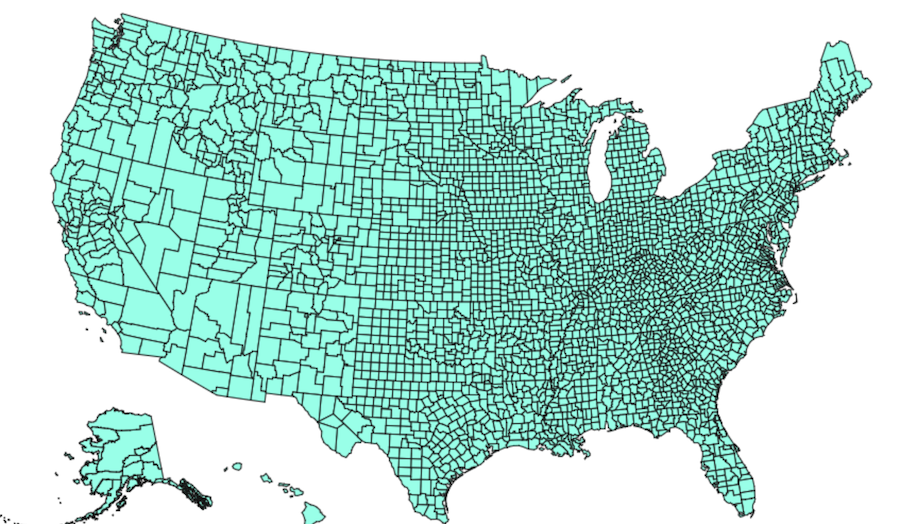
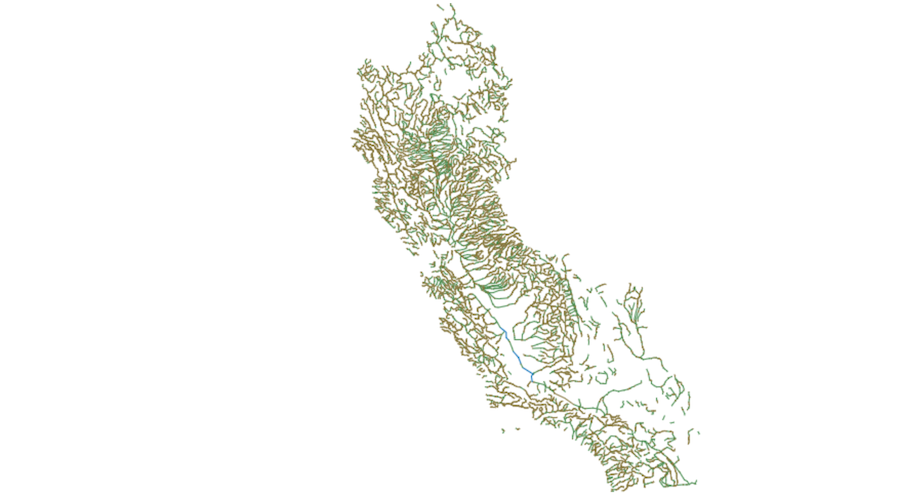
USA (SF) data files
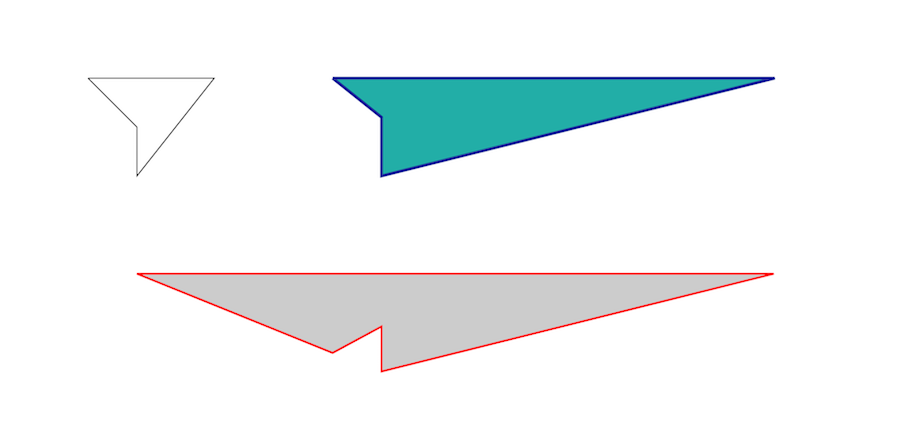
We will explore the three basic GeoJSON data types with these files:
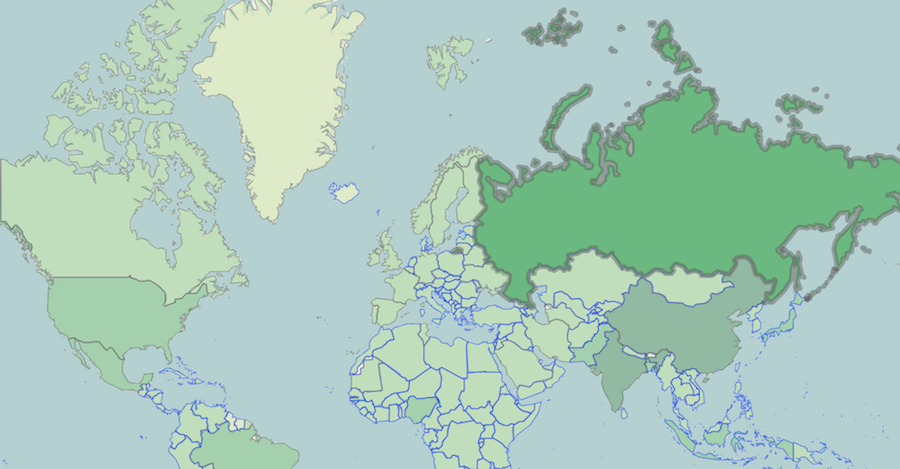
- Polygons - Administrative boundaries like countries, states, and counties
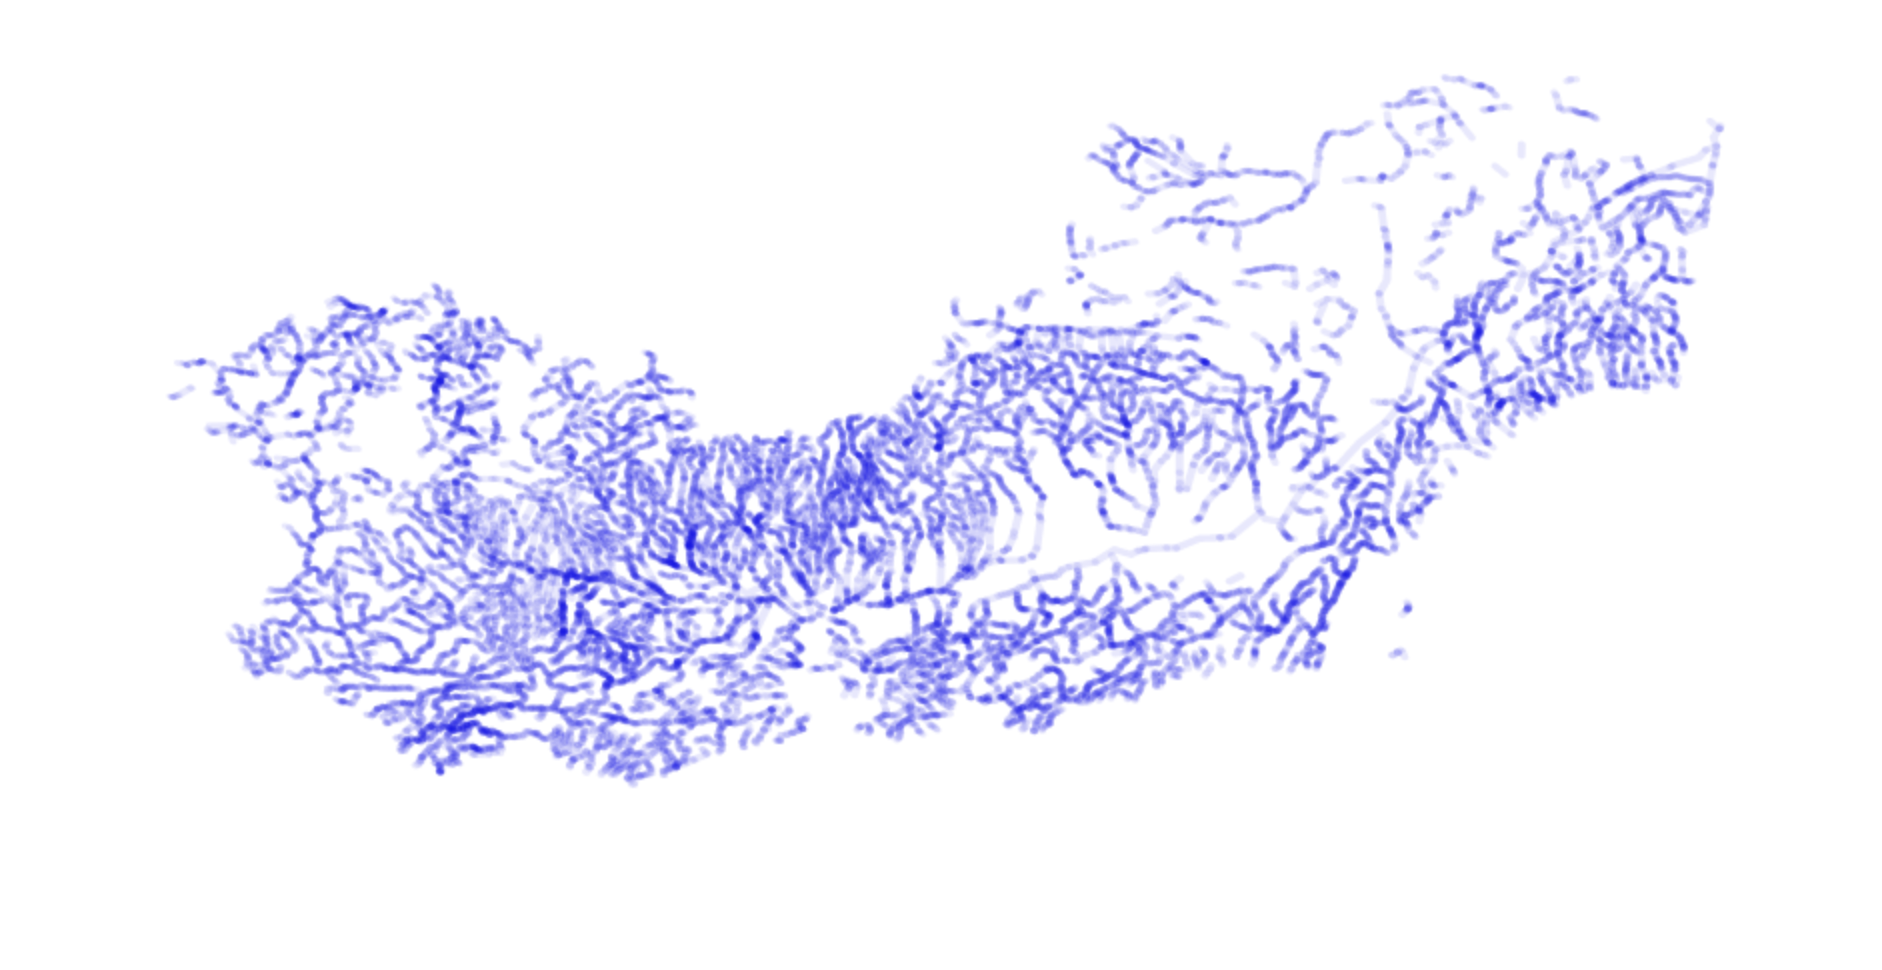
- Lines - Roads, Routes and Rivers
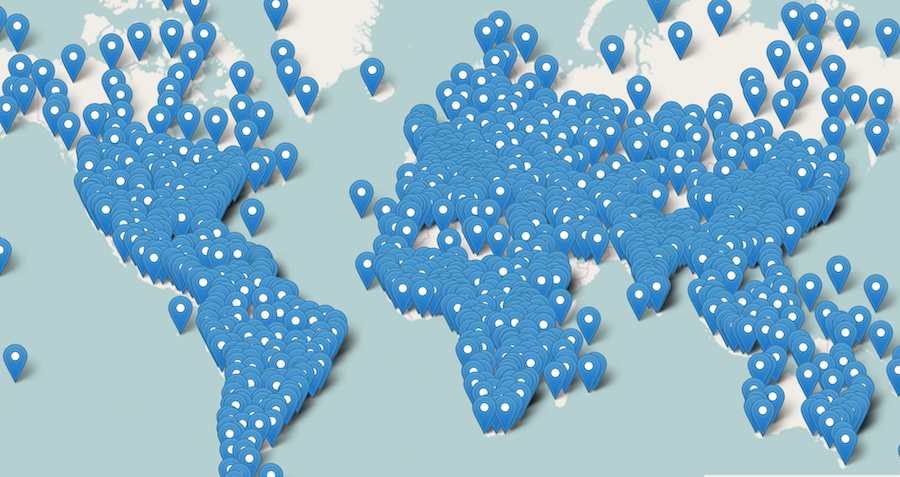
- Points - Cities, Subway stations
You can find the commands used to process and convert the data in each folder. If you want to convert your own spatial data from one file type to another, you may want to start with Mapshaper before diving into the world of command line tools like ogr2ogr.
I recommend reading More than you ever wanted to know about GeoJSON before the workshop. It's a concise overview and a great reference.
1) Getting started with Leaflet
2) Basic styling & interaction
3) Getting started with Mapbox-gl
4) Basic styling & interaction
Data driven
This second part of the workshop will focus on understanding projections and using them with d3 to render custom data-driven maps.
Map projections are an important concept, and we need at least a basic grasp
of how they work to make the kinds of custom maps we'd like to with d3.

One point we need to emphasize is that projections introduce distortion,
to get a sense for how different projections distort the geometry of the earth play with this example:

A fun modification using images to show distortion:

And a gratuitous animation with a particularly interesting projection.
If you want to understand projections from a fundamental level, checkout this thorough presentation on where projections come from.
6) Rendering a map with d3 projections
7) Mouse interactions with d3 + SVG
Hella data
This part of the workshop will focus on how we can render our maps with better performance. We can utilize an extension of GeoJSON called TopoJSON as well as other rendering techniques like using the Canvas API.
TopoJSON is an extension of GeoJSON that encodes topology. One of the biggest benefits of this is that file sizes can be significantly smaller.
A couple tools that can be used to orient yourself with TopoJSON files:
Inspect TopoJSON
Preview TopoJSON
12) Rendering a map with d3 + TopoJSON + SVG
Canvas is an HTML5 API for drawing pixel based images in the browser with Javascript. It is possible to render lots of data quicker with canvas than SVG, but it is less convenient for interaction.
13) Rendering with d3 + Canvas
TurfJS is a Javascript library for geospatial calculations and analysis. It provides many features which can come in handy when dealing with spatial data.
16) Measuring areas and lengths
17) Buffering and contracting features
We may not have time to explore these examples in depth, but they should provide inspiration and exercises for those who wish to venture deeper into the technical possibilities of the tools covered in this workshop.
It's a map, sort of
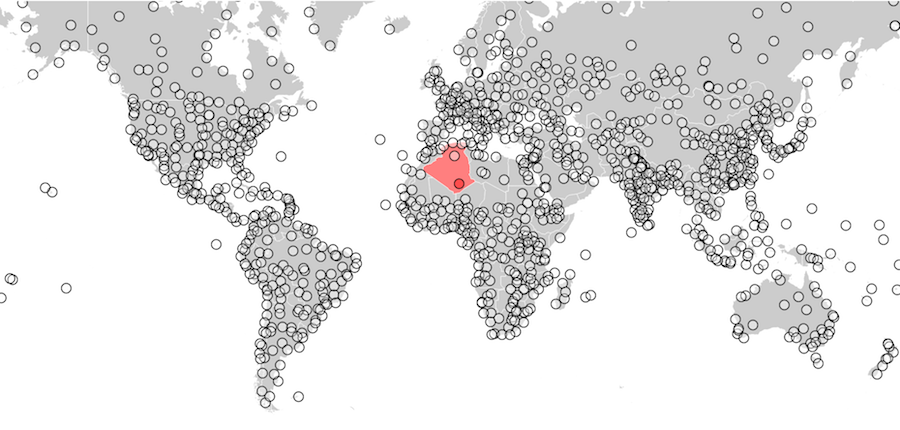
Using geospatial properties or locations to add context:
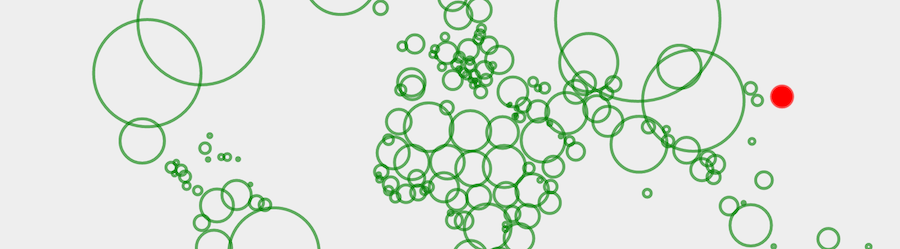
For example Circle counties,
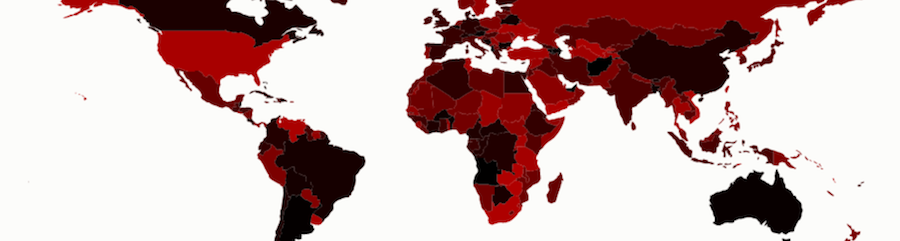
Try doing this with the world populations.
You can calculate the centroids of each country using d3 or turf.
Example answer
Advanced canvas interaction
Selecting countries on a canvas globe
Clipping
Clipping geometry data
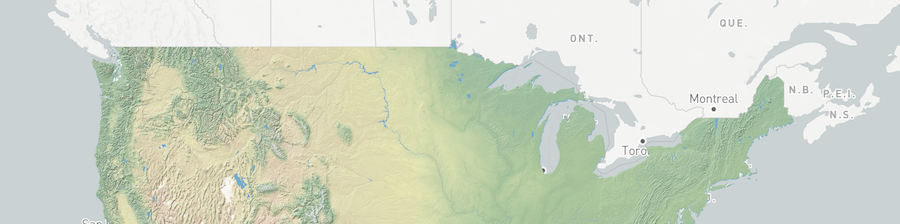
Clipping raster tiles
Voronoi
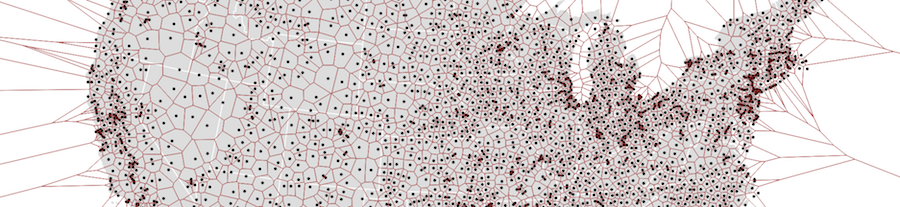
More examples
Quadtrees
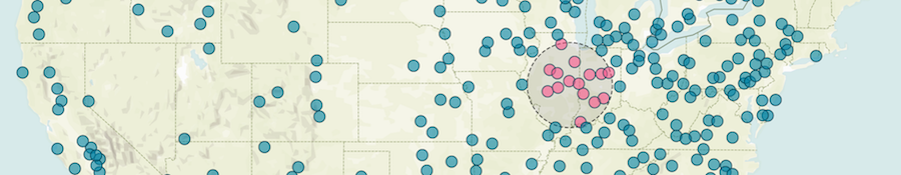
Features near mouse in canvas
Circular selection area:
Animated paths
Timer & Mapbox-gl
Transitions & Canvas
Point-along-path & SVG