This workshop will enable developers to:
- Build client-side applications more quickly and with less frustration
- Affect changes to webpages in real-time, allowing for faster change iterations
After this workshop, developers will be able to:
- Explain use cases for at least 3 tabs in the Chrome Developer Tools (Elements, Console, Network, Sources)
- Use breakpoints and
debuggerto pause and debug a script in progress - Write a Snippet for later reuse
Before this workshop, developers should already be able to:
- Use Chrome
- Write basic HTML
- Write basic JavaScript
Most modern browsers include a set of tools that allow developers to monitor and explore what's going on in a web page. The Chrome Developer Tools, which are often called the "Dev Tools", are essential knowledge for every web developer.
We can do a lot of useful things with these tools, but some of the things that are most useful:
- We can view the HTML & CSS as the browser has understood them
- We can quickly identify whether our links to other online resources are working or not
- We can monitor and manipulate data stored in the browser, including sessions, cookies and other storage options
- We can watch requests and responses as they are made and received
- We can debug issues with our code, following a script as it executes one step at a time
- We can issue JavaScript commands on a console, or browser command line
Having such a powerful set of browser tools at our disposal is incredibly valuable, and you should get into the habit of using them to their full potential.
First, let's navigate to http://generalassemb.ly.
Now to access the DevTools, we can press:
⌘ + ⌥ + ito open the DevTools (to the most recent tab used)
If you forget this command, you can go to View > Developer > Developer Tools or right click on the page and select Inspect, but try to memorize the keyboard shortcut.
Overall, there are eight main tools available in the Developer Tools. You may see people with a few more as you can add custom ones using extensions.
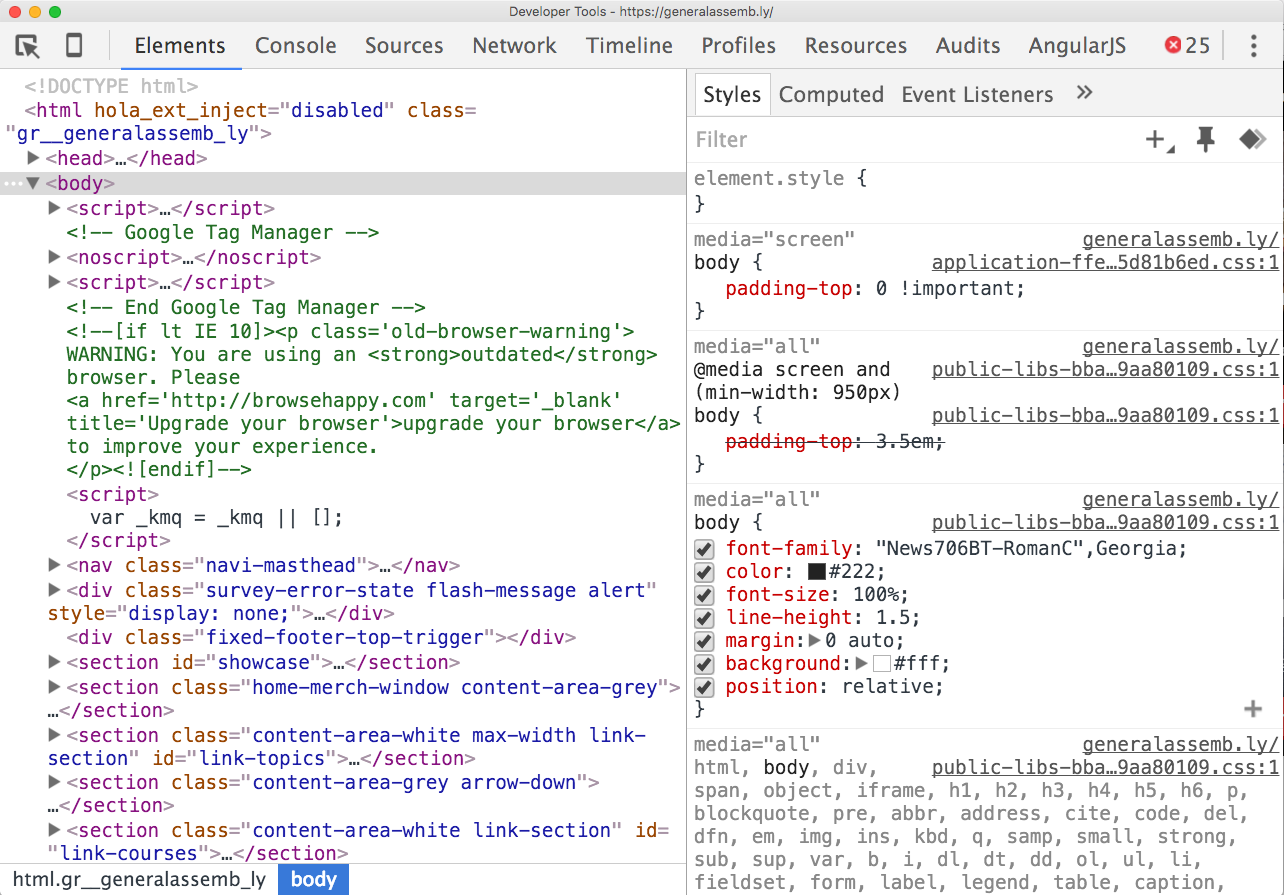
- Elements: Inspect and edit the HTML & CSS of the DOM (Document Object Model)
- Console: Run JavaScript in the browser
- Sources: A graphical interface to the V8 debugger
- Network: Evaluate network performance (refresh to see it in action)
- Timeline: Evaluate page load performance (refresh to see it in action)
- Profiles: Identify optimizations in the performance of an app or webpage.
- Application: (Formerly "Resources"); Manage application storage
- Security: Confirm whether the page you're viewing is secure
- Audits: The Audit panel can analyze a page as it loads.
The key ones to focus on are:
- Elements
- Console
- Network
- Sources
You've already seen how to use the Elements Tab to select, inspect, edit and style HTML elements and CSS in the browser without making changes to the files.
We've also been using the Console tab quite extensively (you can use the shortcut – ⌘ + ⌥ + j to navigate directly to it).
The JavaScript Console provides two primary functions for developers testing web pages and applications. It is a place to:
- Write JavaScript that interacts with the DOM and browser
- Log diagnostic information in the development process using the Console API
When we write JavaScript that we intend to be processed in a browser, we can use commands like console.log() to log values from our Javascript straight to this tab, as the code executes. It's the next best thing to setting a breakpoint when we're debugging.
The Console API is rich and deep. Take a few minutes to look through the documentation for console.group. Can you imagine a strong use case for this?
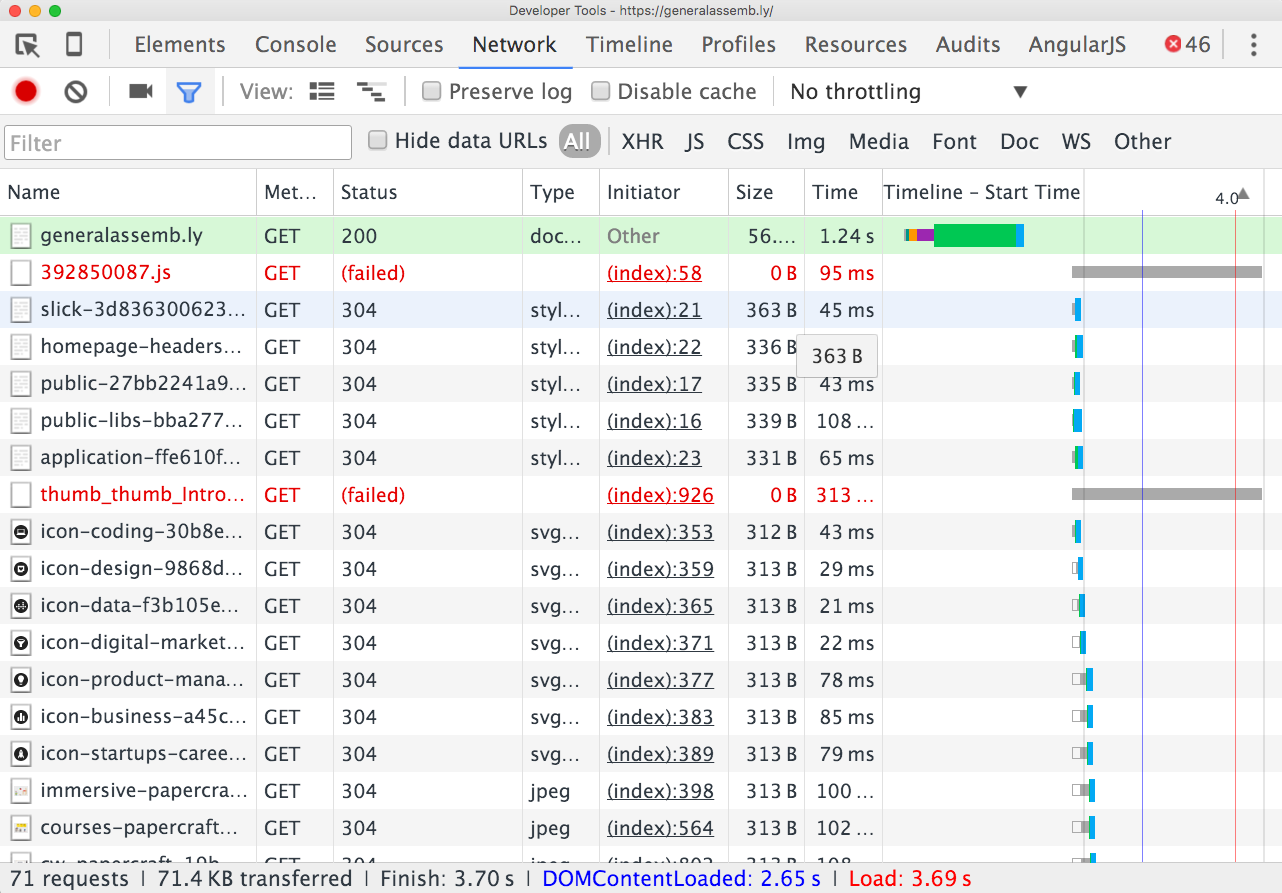
The Network panel records information about each network operation in your application, including detailed timing data, HTTP request and response headers, cookies, WebSocket data, and more.
- Refresh the page and have a look at the requests being made by the page
- Notice that the status of a lot of the resources are 304 (not modified)
- Momentarily check 'Disable Cache' so the requests are processed as new each time we ask for a resource from the server
- Refresh the page, and you should see that everything is now 200 (ok)
- 1xx — Informational
- 2xx — Success
- 3xx — Redirection
- 4xx — Client Error
- 5xx — Server Error
For more information on status codes you can reference HTTP Cat
By default, the network Tab shows all requests being made. However, you can filter these requests by:
- All
- XHR Requests
- Script
- Style
- Images
- Media
- Fonts
- Documents
- WebSockets
- Other
You can also search through these requests, which can be useful.
You can send off an HTTP request directly from the terminal. Try requesting a webpage or downloading a file using the curl command (the name originated from "see URL").
request content: curl www.example.com
download content: curl -O <link-to-some-file> (try an image)
There are other tools that can help us with this, such as Postman, which we will use later in the course. For now, we just want you to know this is here.
Now we're going to learn and practice the basics of debugging JS in Chrome.
Open the starter code in Chrome and make sure the chrome dev-tools panel is open. Go to the Sources panel.
The Sources panel helps us visualize what's going on when we load JavaScript code. It provides a way for us to debug our code in an interactive way. Follow the steps below to explore the Sources panel:
cmd+option+j OR cmd+option+i
- If it is not already selected, select Sources.
Take a look:
Schema From Chrome dev tools Website
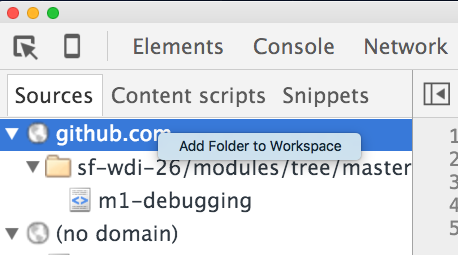
Right-click in the left-hand sidebar and select "Add folder to workspace".
At this point chrome will ask for permission to access & edit local files on your machine. Once you accept you will be able to see files in that workspace and make changes to them.
A breakpoint is an instruction given to a program via a keyword to pause the execution of a script. The Chrome dev tools let you pause execution of a script and see what's going on.
On the left side of the panel, click on a line number where you want to stop the execution of the code. The line number will be highlighted with a blue arrow to show the breakpoint.
Multiple breakpoints
You can add several breakpoints in the scripts, and every time a breakpoint is set, the execution will stop. You can enable and disable the breakpoints using the checkboxes on the right sidebar.
It is possible to access a breakpoint by clicking on it in the source on the left.
A breakpoint can be removed by clicking on the blue arrow on the left.
Another way of setting breakpoints in the code is to use the debugger keyword. If the console is open and the interpreter is going through a line in the code that contains debugger, then the console will highlight this line and the console will be in the context of the debugger.
debugger

setTimeout(function(){
  alert("Loaded");
}, 0);
The DevTools console drawer will allow you to experiment within the scope of where the debugger is currently paused. Hit the Esc key to bring the console into view. The Esc key also closes this drawer.
This section of the lesson is taken from Chrome dev tools
The execution control buttons are located at the top of the side panels and allow you to step through code. The buttons available are:
- Continue: continues code execution until we encounter another breakpoint.
- Step over: step through code line-by-line to get insights into how each line affects the variables being updated. Should your code call another function, the debugger won't jump into its code, instead stepping over so that the focus remains on the current function.
- Step into: like Step over, however clicking Step into at the function call will cause the debugger to move its execution to the first line in the functions definition.
- Step out: having stepped into a function, clicking this will cause the remainder of the function definition to be run and the debugger will move its execution to the parent function.
- Toggle breakpoints: toggles breakpoints on/off while leaving their enabled states intact.
There are also several related keyboard shortcuts available in the Sources panel:
| Execution | Shortcut |
|---|---|
| Continue | F8 or Command + \ |
| Step over | F10 or Command + ' |
| Step into | F11 or Command + ; |
| Step out | Shift + F11 or Shift + Command + ; |
| Next call frame | Ctrl + . |
| Previous call frame | Ctrl + , |
Once you have one or more breakpoints set, return to the browser window and interact with your page.
Most of the time, the JavaScript in a website will be minified, meaning that variable names are condensed and spaces and line breaks are removed. This can make the source code unreadable, and difficult to debug. You can re-format the code using the "Pretty Print" button of the bottom left side of the panel {}. This makes the code more easy to read and debug.
When you start building web apps in larger frameworks like Rails or Express, you'll set up your development environment so that code is only minified when you're deploying a production app, not while you're developing actively.
Although we won't be using Snippets in our exercise, I would like to take a moment to show you what they do. Snippets allow you to run a small piece of code on any website.
Try this:
 var bod = document.querySelector('body');
    bod.onclick = function(e){
    this.style.transform = 'rotateZ(-40deg)';
}Lets debug some JavaScript!
Clone this repo, and crack open the buggy-script folder in your text editor.
In your terminal from inside this repo type
open buggy-script/index.html
to open it in your default browser (should be Chrome)
Start in the console and look for error messages.
Use breakpoints, the debugger keyword, and anything else we learned to get this code working!
The following goals are totally optional. Stretch yourself to use part of the Chrome Developer Tools you are less familiar with to get them working.
-
Option 1 (easy): Write a new function,
checkForWin()that compares the values of all the dice and changes the DOM to indicate a win if the values match. -
Option 2 (medium): Track the scores over time using browser storage. Players want to accumulate 100 points to win.
-
Option 3 (hard): Find the rules to the game
Tenziand implement them.
Knowledge of the Dev Tools is necessary for developing client-side applications. It illustrates what's happening "behind the scenes" and allows for developers to experiment with change. These tools inevitably lead to a better workflow and greater productivity.
It is especially important to understand the link between the JS V8 Engine in Chrome and the way that error reporting is handled, and how you can interact with your scripts to figure out what's going on.
- Learn more about the DOM
- Memorize the dev tool keyboard shortcuts
- Explore the Window API; the window object represents the window containing the DOM.
- An old-but-clear YouTube tutorial debugging with Chrome DevTools back in 2012


