pyqtgraph-spectrographer
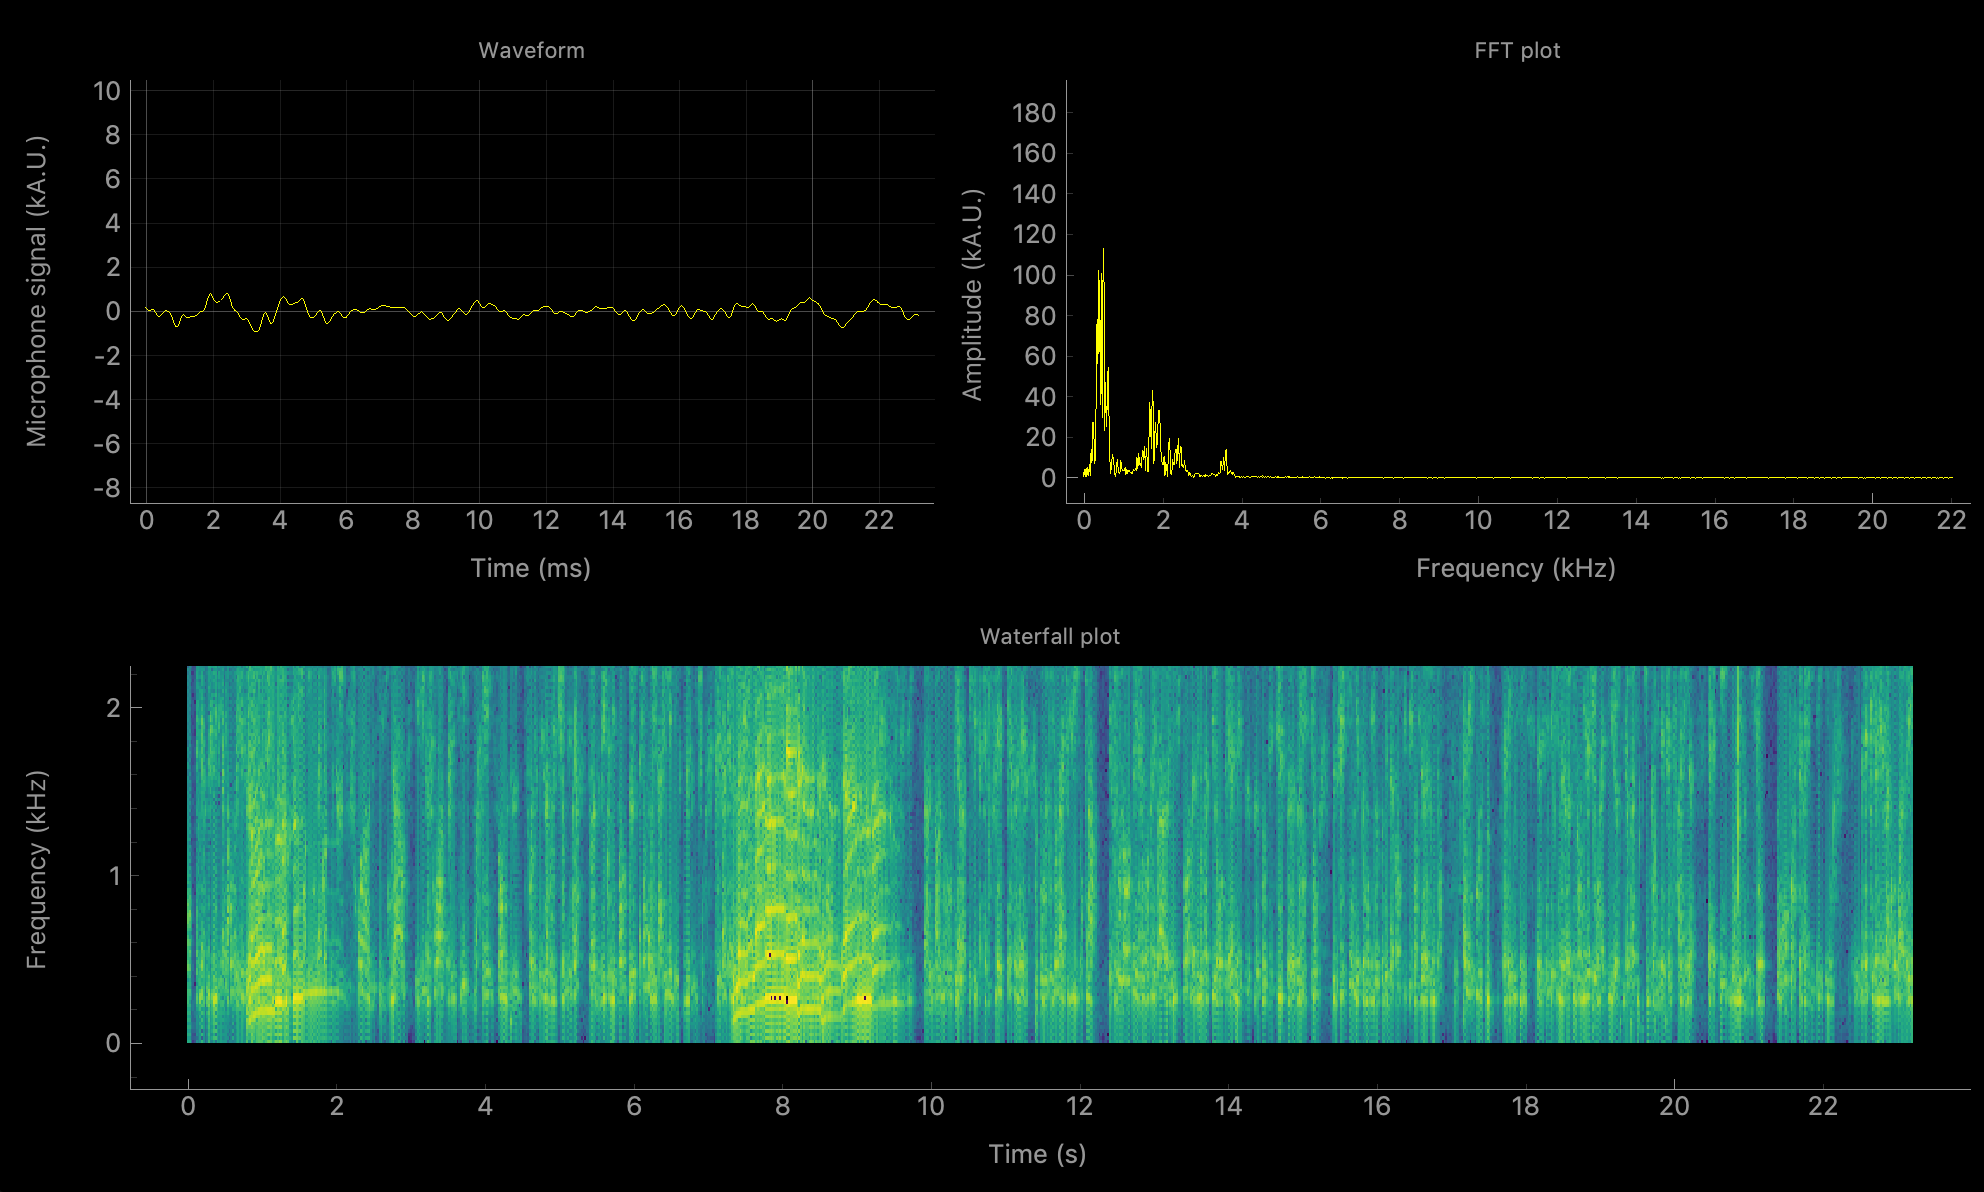
This is a simple app to display a live spectrogram from microphone input (including waveform and frequency domain).
Installation
conda
Assuming you have git cloned the repo and have a command prompt in the cloned directory,
you can use conda to create an environment with all necessary dependencies:
>>> conda env create -f environment.ymlNote: I have developed this on MacOS and found out that using pyaudio (bindings for PortAudio) required additional steps such as installing PortAudio using brew. YMMV.
virtualenv + pip
You can also install dependencies for this project in a virtualenv using pip:
>>> python3 -m venv venv
>>> source venv/bin/activate
>>> python3 -m pip install -r requirements.txt
Note that on Ubuntu you might need to install the following packages beforehand: apt-get install python3-venv libasound-dev portaudio19-dev libportaudio2 libportaudiocpp0 python3-pyqtgraph.
Usage
From the root directory, activate the conda environment with the dependencies and run main.py
>>> conda activate spectrographer
>>> python main.py