Debugging slows down
seva100 opened this issue · comments

First of all, huge thanks for this lovely library!
I found it the most useful during debugging some complicated PyTorch code, so that I can see all the tensors properties at a single glance.
However, I found that it takes around 3-5 seconds every time for the IDE (VSCode in my case) after it stops at the breakpoint before it allows me to inspect the code and variables. Also warnings like this one appear:
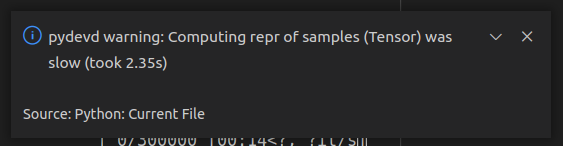
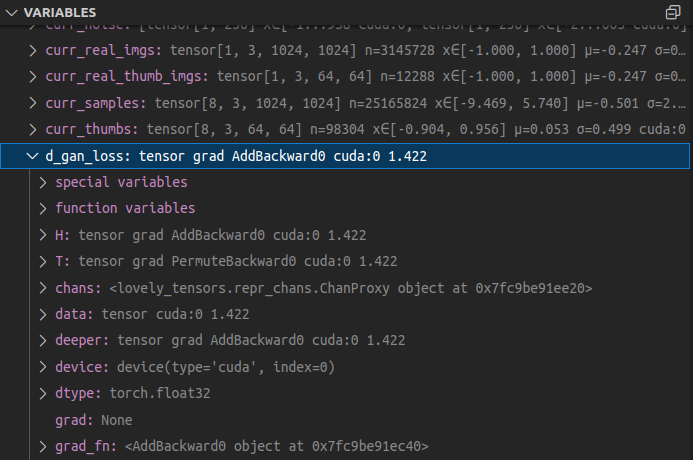
I think it started happening when I installed lovelytensors; also the text in the warning suggests the printing takes some time. I am wondering, is there anything that can be done in this regard? Maybe I can select only a part of the variables that interest me, or allow lovelytensors not go too "deep" (e.g. monkey patch __repr__ only for the local variables but not their properties). E.g. see below:
- VSCode version: 1.73.1
- OS: Ubuntu 20.04
- running over a remote connection (remote OS: Ubuntu 20.04)

Thank you! 💕
I see the issue.
So, every time the debugger displays the variables, it will call __repr__, which will synchronously copy the data to cpu and calculate the stats. I hope it does not call repr on all the object properties unless you expand the object.
Thank you for pointing this out. I will need to think about what would be the best way to address the issue. Are you using notebooks, python with cells, or plain python?
Thanks for a very prompt reply!
Oh I see, then perhaps a possible solution would be to calculate the properties without copying everything to cpu? Or perhaps I'm missing some potential drawbacks of that?
I'm using just plain python, haven't tried the same in notebooks yet.
Yeah, since I'm calculating stats on good (not inf, nan) values only, I had to perform that large binary indexing operation:
ft = t[ torch.isfinite(t) ].float()which requires, I think, at least 3x the memory used for t, and being a bit slow on large tensors felt like a better option compared to random OOMs, so I ended up first moving the tensor to CPU, and later this code ended up in lovely-numly. But I might have to reconsider it now.
My quick benchmark:
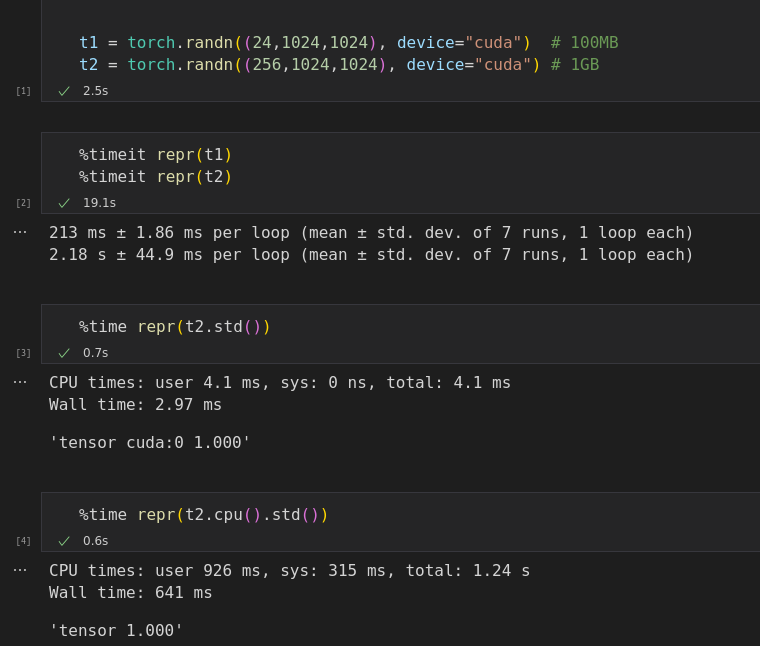
It's definitely very beneficial to calculate the stats on device, and most large tensors won't have non-finite numbers, so it might make sense to streamline this case and keep stuff on GPU. I'll try to work on this tomorrow.
Until then, if you'd like to try, you can revert to version 0.1.7, which is not using lovely-numpy, and disable copyng to cpu and possible the isfinite indexing line. Both are inside the repr_str.py:to_str().
Ah I see, I guess I'll give it a try, thanks!
Maybe another option would be to have a separate flag for non-finite checks lt.monkey_patch(check_finite=False), and if check_finite is False, just use regular mean/std.
By the way, looks like there is a function torch.nanmean that may come handy; I guess if only mean and std are needed, one can also implement nanstd by torch.sqrt(torch.nanmean((x - torch.nanmean(x)) ** 2)).
Upd: I've benchmarked torch.nanmean and custom nanstd (see above) over the masking approach, seems like in both times it's faster:
In [2]: t1 = torch.randn((24, 1024, 1024), device="cuda")     # 100 MB

In [3]: %timeit t1[ torch.isfinite(t1) ].float().mean()
4.81 ms ± 4.99 µs per loop (mean ± std. dev. of 7 runs, 100 loops each)

In [4]: %timeit t1.nanmean()
1.39 ms ± 328 ns per loop (mean ± std. dev. of 7 runs, 1000 loops each)

In [5]: nanstd = lambda x: torch.sqrt(torch.nanmean((x - torch.nanmean(x)) ** 2))

In [9]: %timeit t1[ torch.isfinite(t1) ].float().std()
4.88 ms ± 1.12 µs per loop (mean ± std. dev. of 7 runs, 100 loops each)

In [10]: %timeit nanstd(t1)
3.54 ms ± 650 ns per loop (mean ± std. dev. of 7 runs, 1000 loops each)
In [11]: t2 = torch.randn((256, 1024, 1024), device="cuda") # 1 GB
In [12]: %timeit t2[ torch.isfinite(t2) ].float().mean()
50.8 ms ± 8.15 µs per loop (mean ± std. dev. of 7 runs, 10 loops each)
In [13]: %timeit t2.nanmean()
14.6 ms ± 1.57 µs per loop (mean ± std. dev. of 7 runs, 1000 loops each)
In [14]: %timeit t2[ torch.isfinite(t2) ].float().std()
51.2 ms ± 15.8 µs per loop (mean ± std. dev. of 7 runs, 10 loops each)
In [15]: %timeit nanstd(t2)
37.3 ms ± 6.7 µs per loop (mean ± std. dev. of 7 runs, 100 loops each)My concern with nanstd() is, I think it might still have to create a temporary tensor that's as large as the input, and since we are really only concerned with performance on large tensors, this has a higher chance of OOM. And I don't know if nanmean() can avoid it either. Will experiment with it.
I think the solution is to check if all values are good and do the calculations on GPU.
If not, copy to CPU, mask, and calculate there.
I also don't know if there is a way to implement memory-efficient nanmin() and nanmax().
My debugging so far. Single 256M FP32 -> 1GB tensor on CUDA.
Without LT:
1x memory, snappy debugger
LT 0.1.8: .cpu().numpy() -> calculate stats on CPU with NumPy
1x memory, 2300ms for repr, the debugger is slow
LT 0.1.7: .cpu(). -> calculate stats on CPU with Torch
1x memory, 3600ms for repr, the debugger is slow
LT 0.1.7, don't do .cpu()
8x memory, 80ms repr, the debugger is fast
LT 0.1.7, don't do .cpu() and good number masking
1.2x memory 20ms repr
2x memory after using the debugger.
The reason for 2x memory is calculating min/max on t.T (debugger calls repr on all properties of t) requires memory, because it's trying to generate the indices.
def reserved(p):
    print(f"{p} Max reserved: {torch.cuda.max_memory_allocated()// (1024*1024)} MB")

t = torch.randn((256,1024,1024), device="cuda")
reserved(1)

print(t.min())
reserved(2)

print(t.T.min())
reserved(3)
1 Max reserved: 1024 MB
tensor(-5.6040, device='cuda:0')
2 Max reserved: 1024 MB
tensor(-5.6040, device='cuda:0')
3 Max reserved: 2048 MB
LT 0.1.7, don't do .cpu() and good number masking. Replace .min()/.max() with amin()/amax():
1.2x memory after repr, 1.2x after playing in debugger!
10ms repr
Debugger is snappy.
When browsing the tensor properties, the debugger occasionally complains about .deeprt being on the slow side.
1.2x memory consumption comes from
    zeros = ansi_color("all_zeros", "grey", color) if t.eq(0.).all() and t.numel() > 1 else None
    pinf = ansi_color("+Inf!", "red", color) if t.isposinf().any() else None
    ninf = ansi_color("-Inf!", "red", color) if t.isneginf().any() else None
    nan = ansi_color("NaN!", "red", color) if t.isnan().any() else None
A better way would be to utilize amin() / amax() here too:
    amin, amax = t.amin(), t.amax()

    zeros = ansi_color("all_zeros", "grey", color) if amin.eq(0) and amax.eq(0) and t.numel() > 1 else None
    pinf = ansi_color("+Inf!", "red", color) if amax.isposinf() else None
    ninf = ansi_color("-Inf!", "red", color) if amin.isneginf() else None
    nan = ansi_color("NaN!", "red", color) if amin.isnan() else None
LT 0.1.7, don't do .cpu() and good number masking. Replace .min()/.max() with amin()/amax(), use them for nasties too:
start = time()
print(t)
end = time()
reserved(2)
print(f"repr took {((end - start) * 1000)} ms")

print("Break!")
reserved(3)
1 Max reserved: 1024 MB
tensor[256, 1024, 1024] n=268435456 x∈[-5.884, 6.161] μ=3.629e-05 σ=1.000 cuda:0
2 Max reserved: 1024 MB
repr took 10.094881057739258 ms
Break!
3 Max reserved: 1024 MB
🥳 🎈 🎉
The solution I see:
- If the tensor is all good - no nan/inf, float type (can't call .mean() on int tensors) - do the calculations on GPU.
- Otherwise, move to CPU, NumPy (since it's faster), mask, convert to float, and calculate on CPU. This means that, yes, unclean tensors will be slower-ish. Not a big deal in repl, might be a problem in the debugger.
- For .deeper, set a default max number of rows per dimension. I don't see how printing .deeper with > a dozen rows can be useful. Allow an easy override.
I'll try to implement it all tomorrow.
Wow, great results! Thanks a lot for the extensive benchmarking!
When browsing the tensor properties, the debugger occasionally complains about .deeprt being on the slow side.
Yes, I also had a warning about that by the way. I'm thinking a possible solution would be to make .deeper a method (.deeper()) so that it's not called automatically. But I'm not sure you'd like to go for it, since it breaks the syntax convention a bit that you have for other LT features. What do you think?
And generally I'm also thinking about something like optional arguments for debugging in lt.monkey_patch(), e.g. lt.monkey_patch(check_finite=False) or lt.monkey_patch(properties_on_demand=True). What do you think? Perhaps I could help with implementation if needed.
Yep, deeper() would be a solution, but I think once we enforce a limit on the output, it's going to stop being an issue in practice, and we can keep the interface consistent. I would go for deeper() if is it being a property keeps causing issues.
check_finite=False would calculate the stats on all numbers without checking if they are finite, right? Yes, I can see it being useful; it would keep everything on the GPU.
What about properties_on_demand ?
Ah OK, then I think there's likely no need for deeper() indeed.
Yeah it's correct about check_finite=False. But I'm also thinking it should be checked if torch.any(torch.isfinite(x)) call is fast enough -- in this case it can be just done every time in the beginning and based on the value either calculate stats on device or on CPU.
About properties_on_demand, I had in mind that all LT properties are calculated on demand only (makes sense only in the debugging mode) -- this could be implemented e.g. by turning all of them into functions (just like .deeper(), etc.), but now I'm not sure it's worth it.
But I'm also thinking it should be checked if
torch.any(torch.isfinite(x))call is fast enough -- in this case it can be just done every time in the beginning and based on the value either calculate stats on device or on CPU.
Yeep, that's what I had in mind for the solution. Except I'm going to use amin/amax to see if there are any non-finite numbers since they don't require extra memory unlike any().
I'll think about properties_on_demand. My gut feeling is it's a bad idea since once you set it, all your code will have to do the explicit call and there is no going back. You also can't reuse other people's code that does not do the explicit call, including any library code. Maybe there is a way to let the debugger know not to touch some properties, I'll think about it. Maybe we should just convert everything to explicit methods.
I've pushed an update that limits the number of items displayed by .deeper.
The debugger no longer complains about slow repr, and things are snappy.
I think this issue can be closed. Thank you for bringing it up! 💕
Please let me know if you spot anything else that could see improvement.
@xl0 I've just tested it and it does work lightning fast!
Huge thanks for making such a fast fix, awesome job!
💕 :)