matplotlib-gallery
This repository is a collection of different matplotlib plots in IPython notebooks that I needed for my data visualizations.
This project is not connected to the gallery on http://matplotlib.org/gallery.html, although there might be some overlap and redundancy.
To view the IPython notebooks, simply click on the header links or images.
Sections
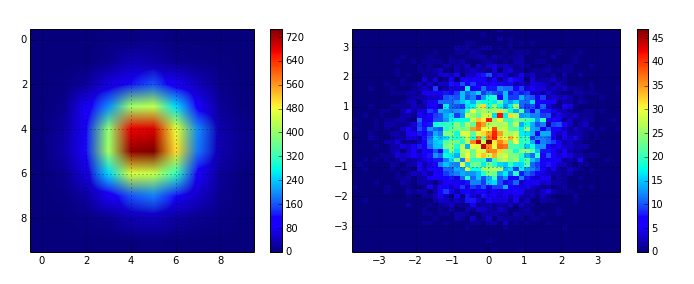
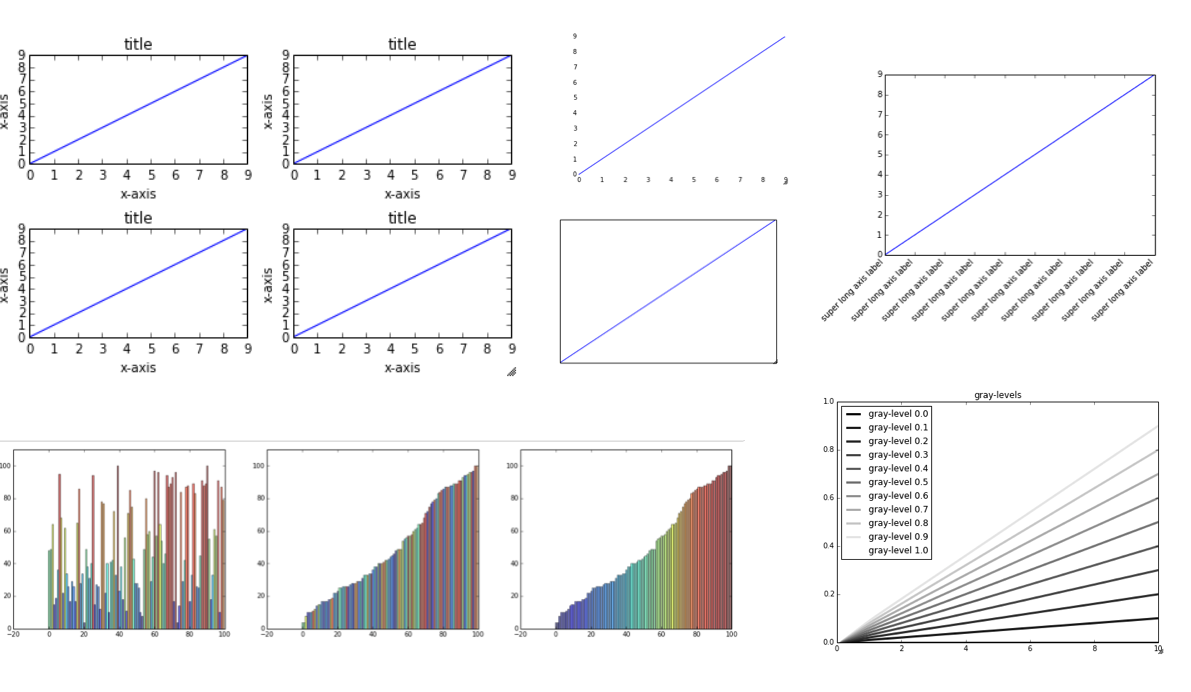
- 2D histograms / heat maps / levelplots
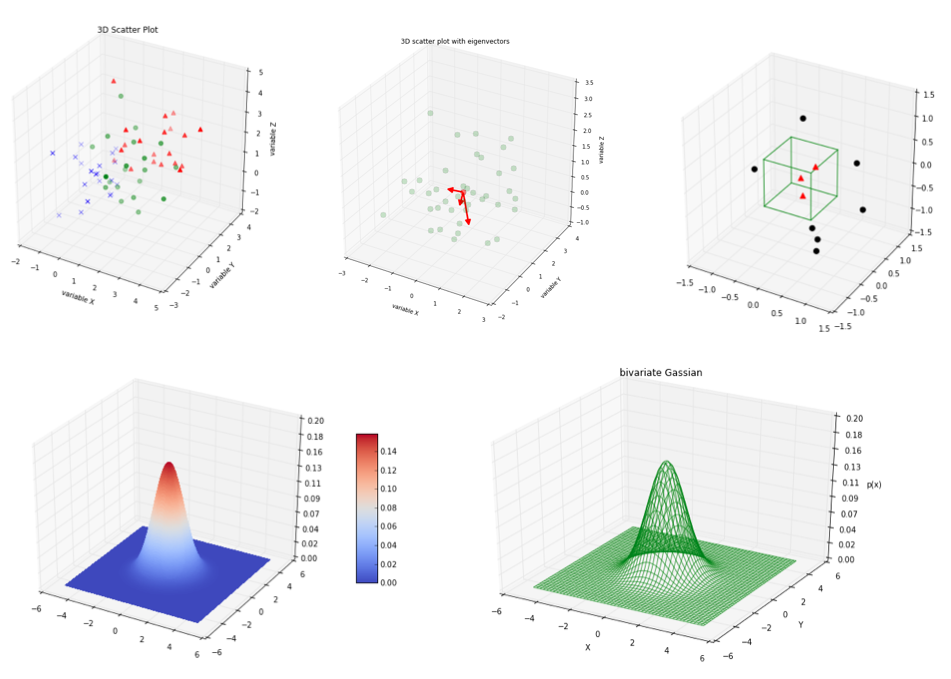
- 3D Plots
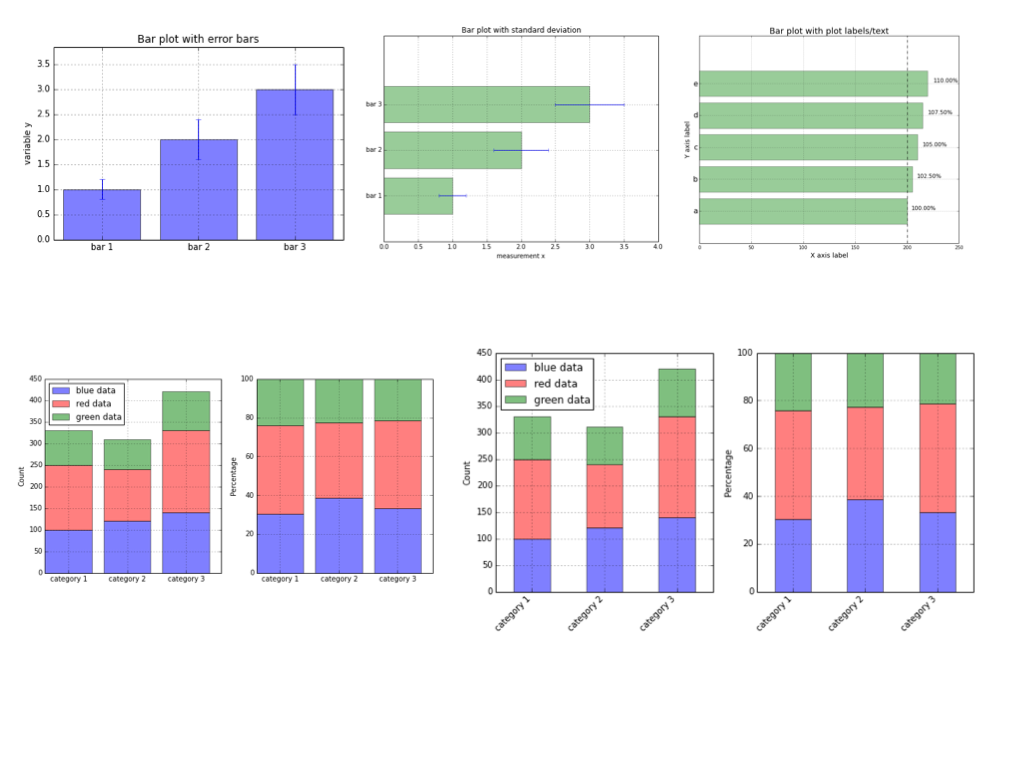
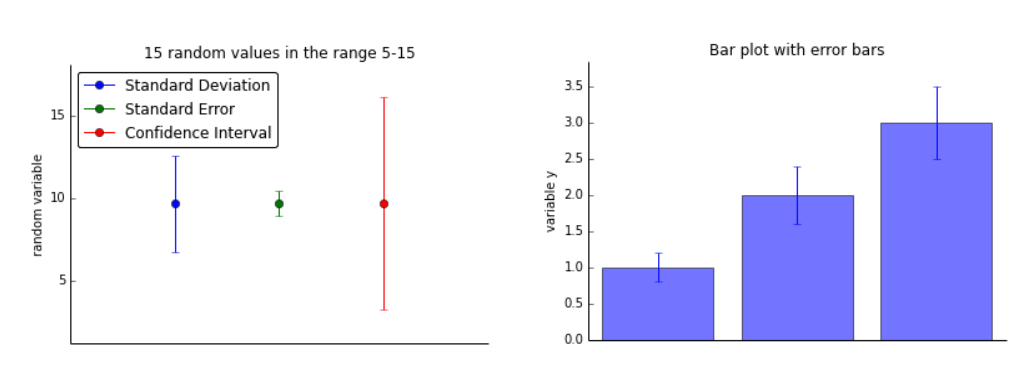
- Bar plots
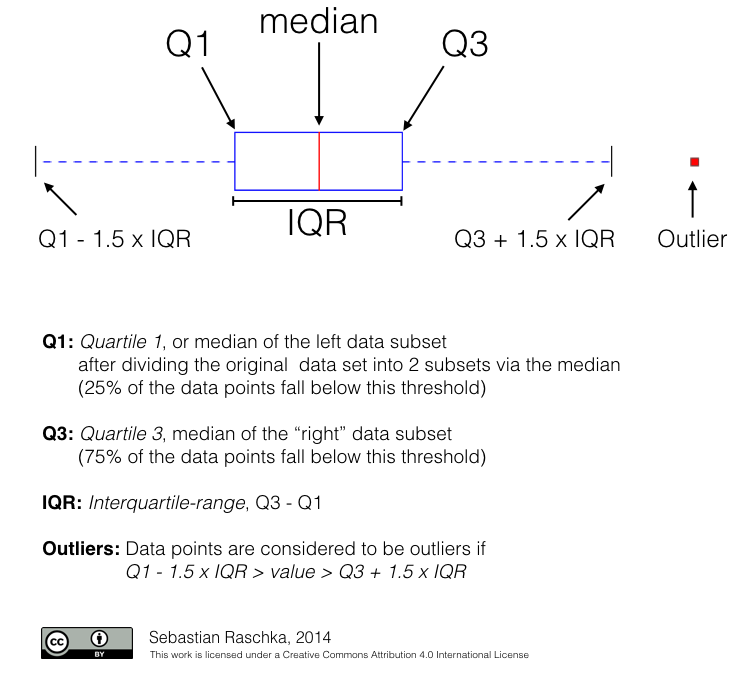
- Boxplots and Violinplots
- Errorbar plots
- Formatting I: subplots, markers, colors, axes
- Formatting II: gridlines
- Formatting III: legends
- Formatting IV: style sheets
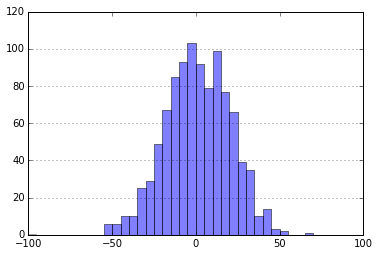
- Histograms
- Line plots
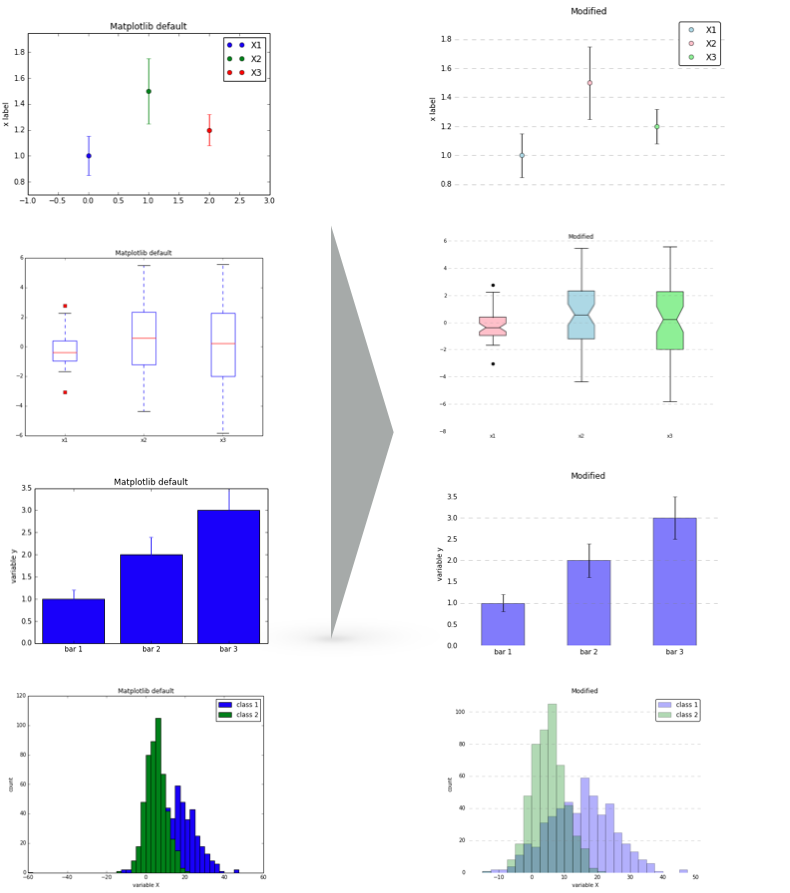
- Preparing Plots for Publication
- Scatter plots
- Special plots
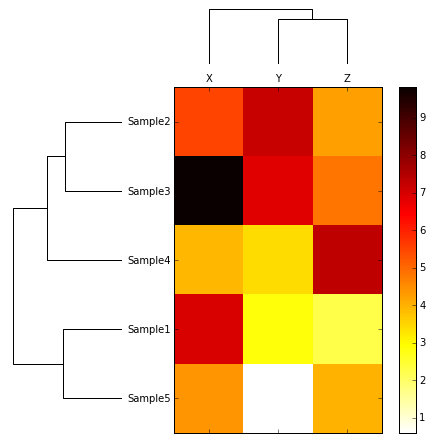
- Clustering - Heatmaps and Dendrograms
- Tips and Tricks
I am looking forward to your contributions, suggestions, and ideas
If you have any suggestions or want to make additions, I would be very happy if you could send me
- an email,
- leave me a message on google+,
- or even send me a tweet on twitter (given you can fit it within the 140 character limit ;)).
Or even better: It would be great if you would simply fork this project and send me a pull request.
2D histograms / heat maps / levelplots
3D Plots
Bar plots
Boxplots and Violinplots
Errorbar plots
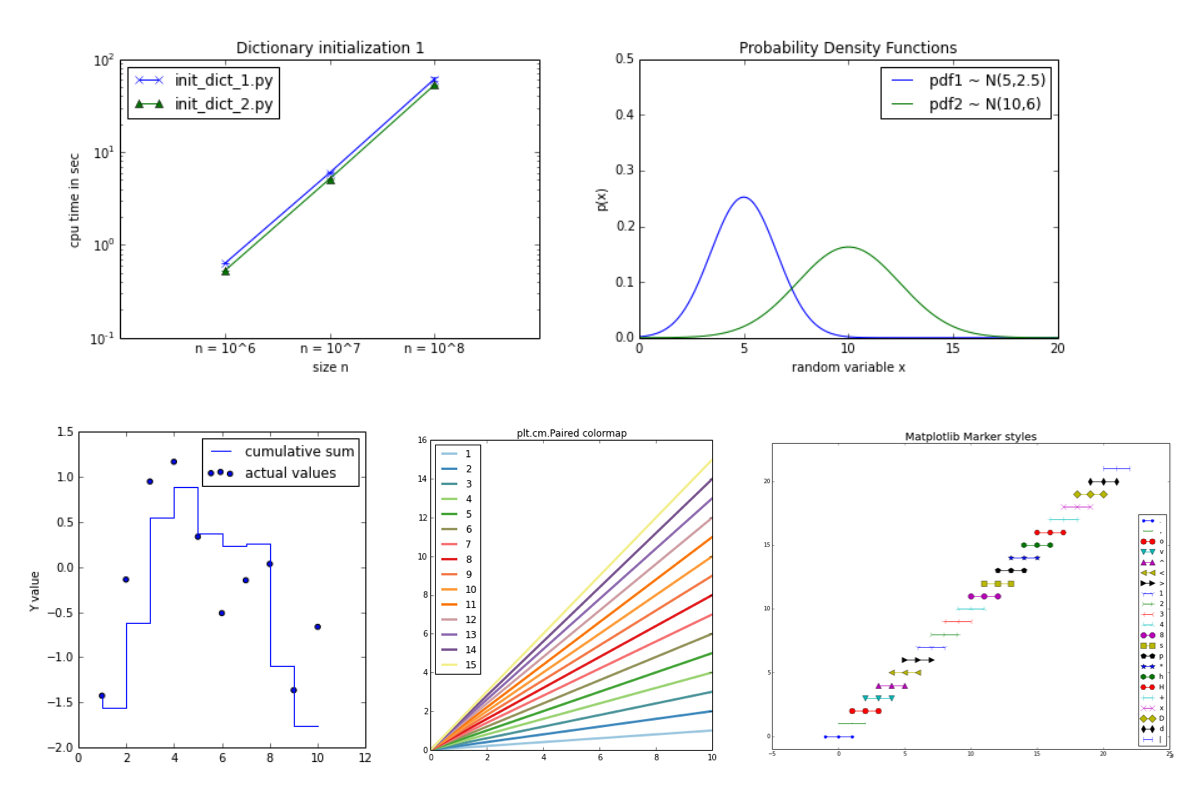
Formatting I: subplots, markers, colors, axes
Formatting II: gridlines
Formatting III: What it takes to become a legend
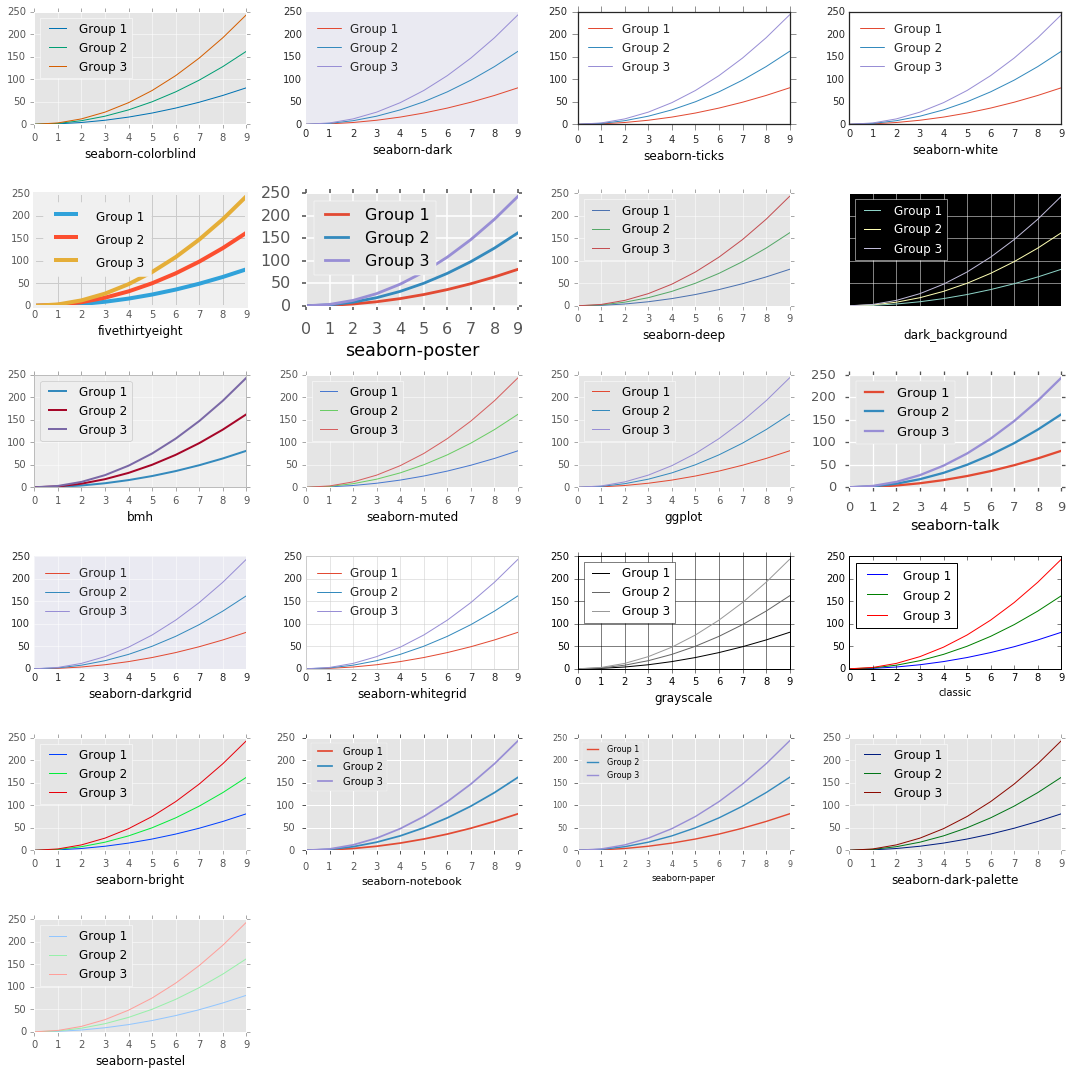
Formatting IV: Style Sheets
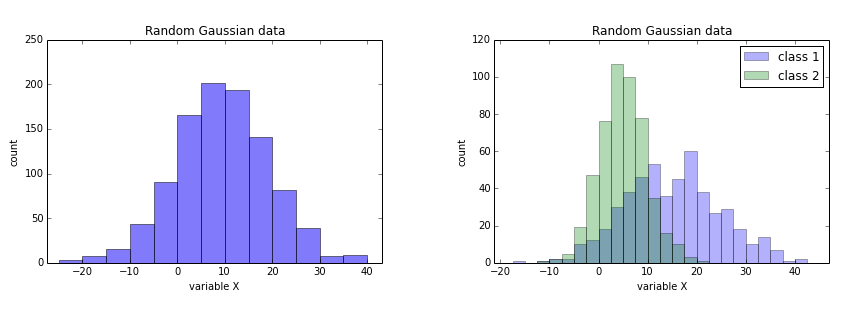
Histograms
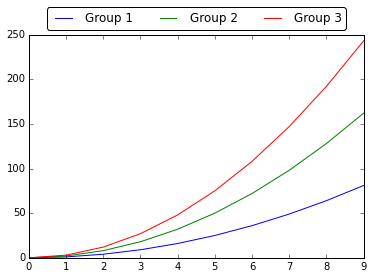
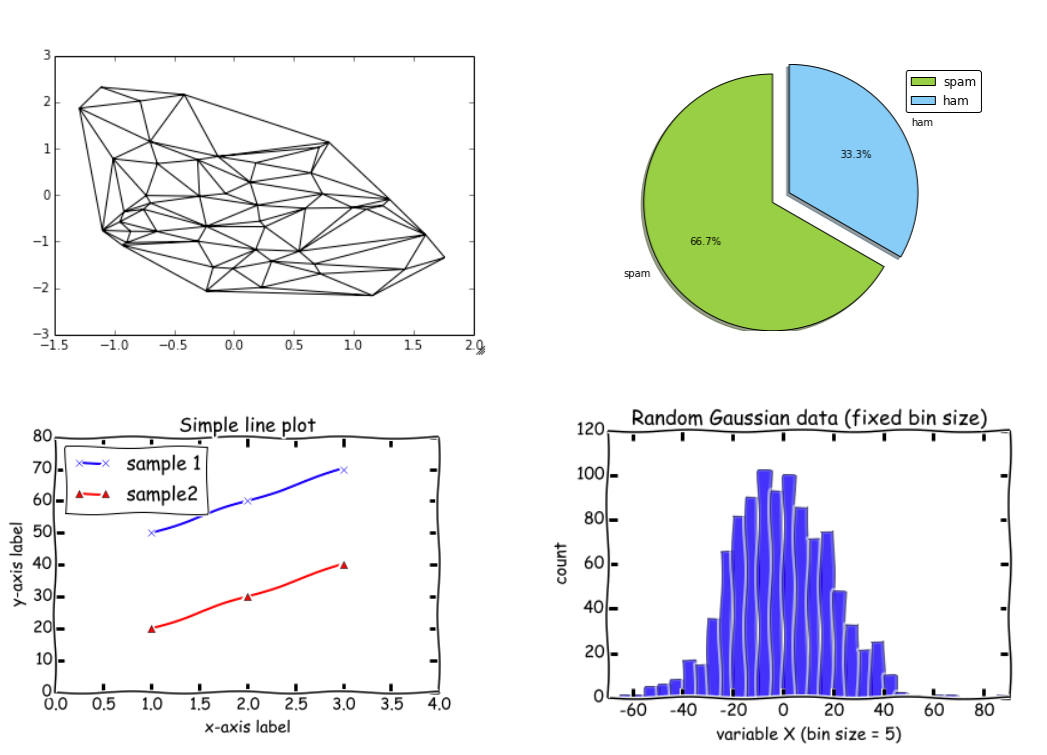
Line plots
Line plots
Preparing Plots for Publication
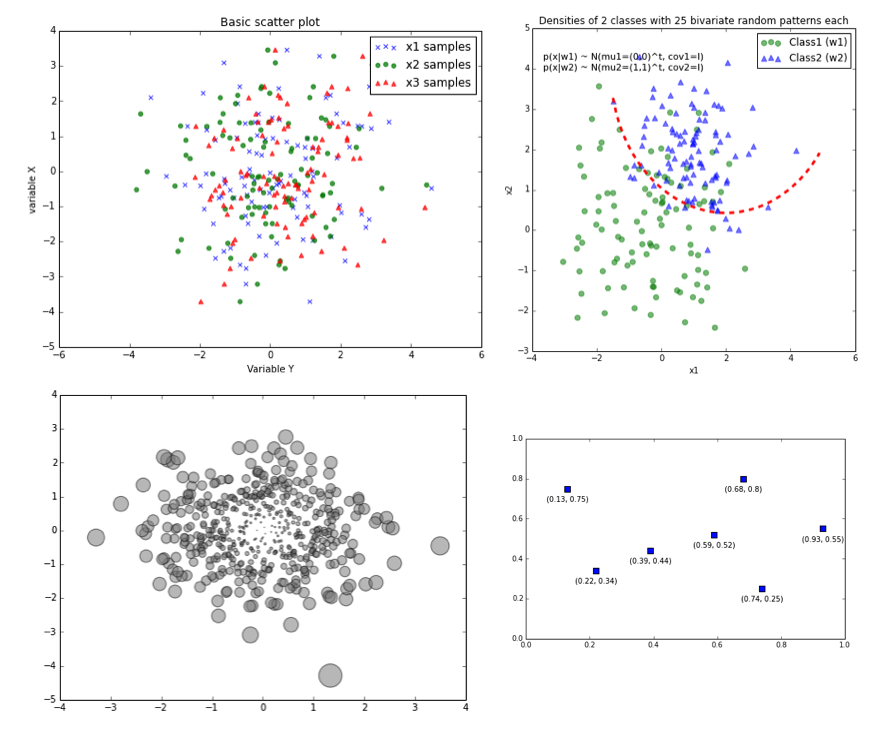
Scatter plots
Special plots
Clustering - Heatmaps and Dendrograms