- Low Returns
- “Under your mattress”
- High Yield Savings Account
- Treasury or Government Bill/Bond
- Risky Assets
- Cryptocurrency
- High Capital Investments
- Real Estate
- Alternative Assets
- Private Equity
- Alternative Options ~ A Potential Better Route:
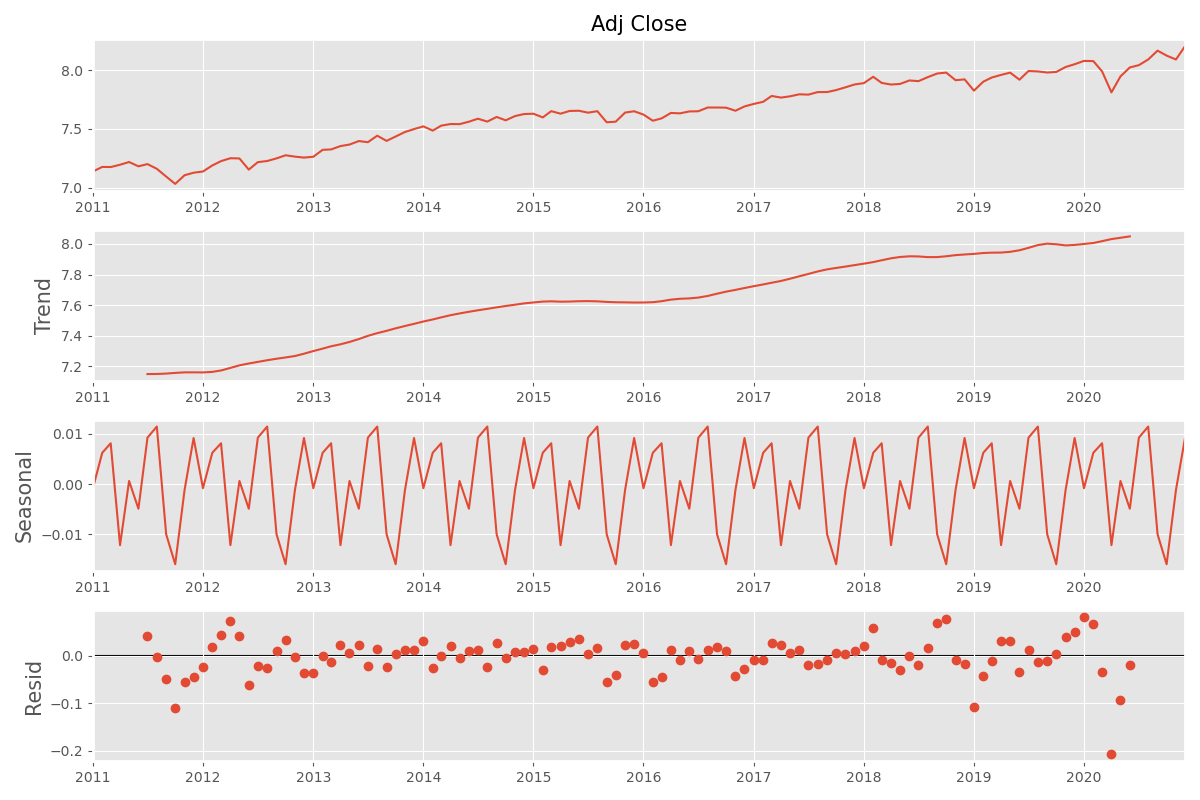
- Stock Market (S&P 500 Index) - measures performance of 505 publicly listed companies
- SP500 - 10 years - daily prices
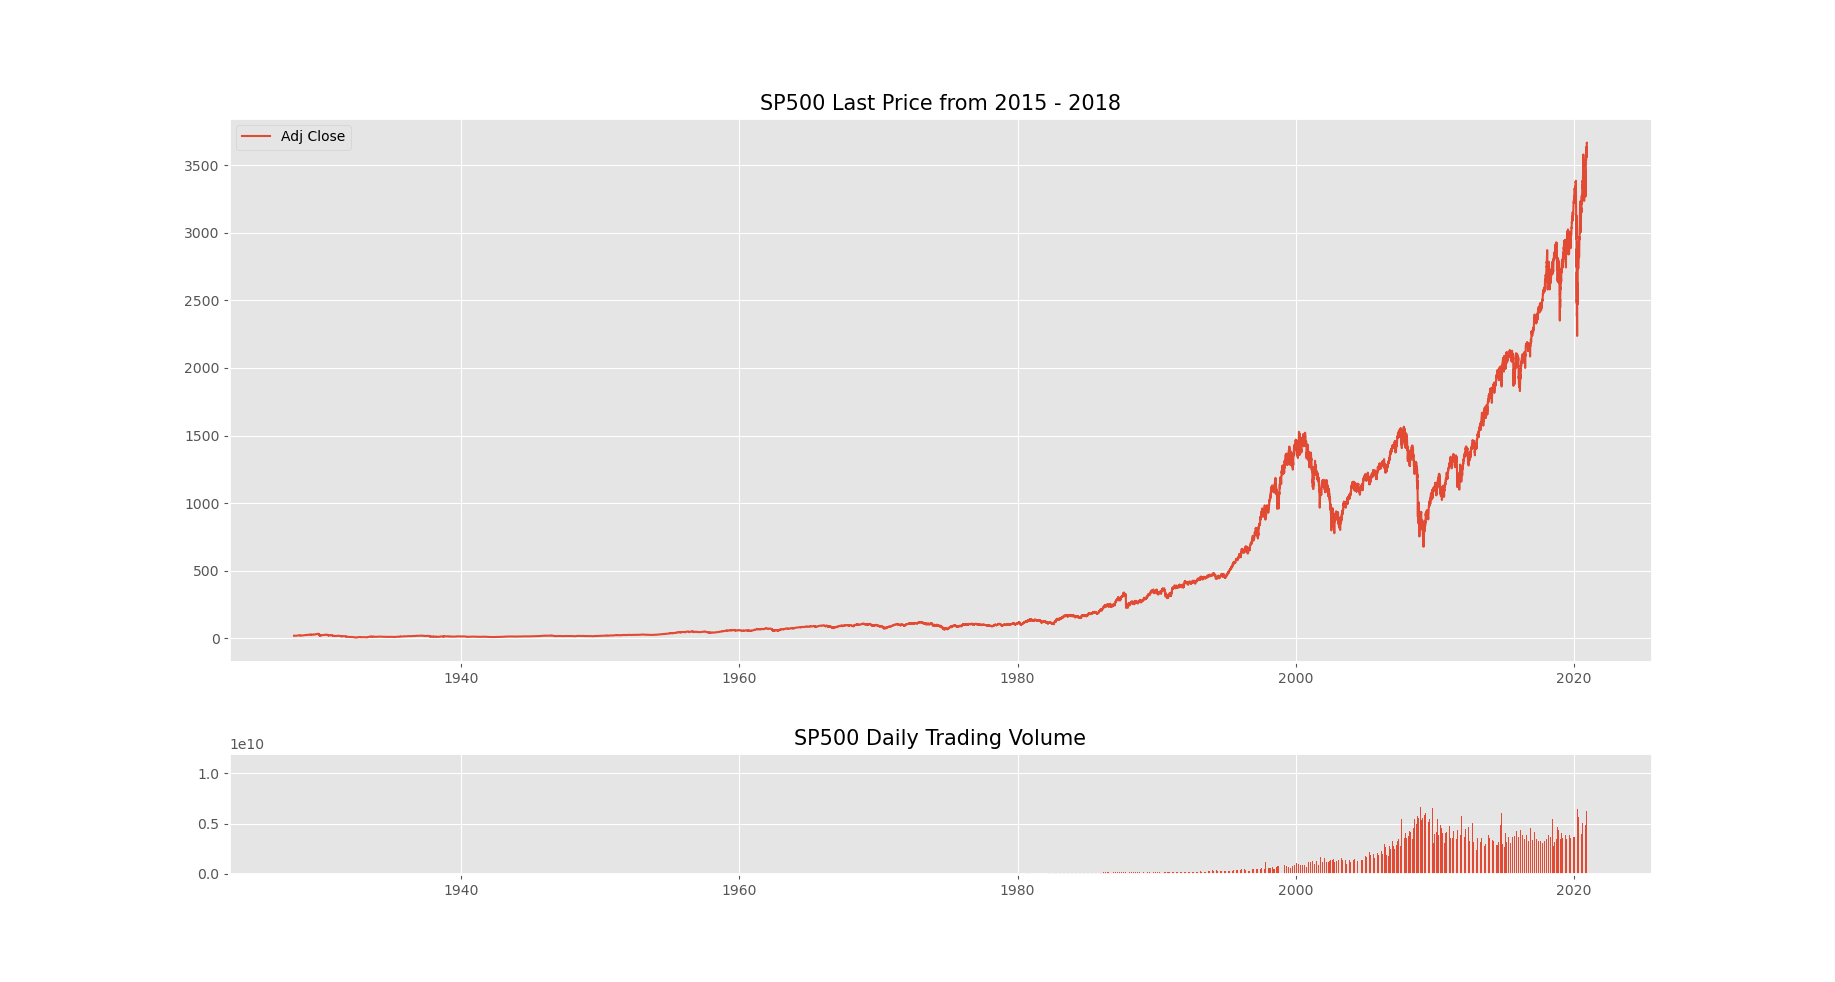

- Price movements tend to drift towards some long term mean either upwards or downwards.
- Stationary TS has constant mean/variance/autocorrelation over time
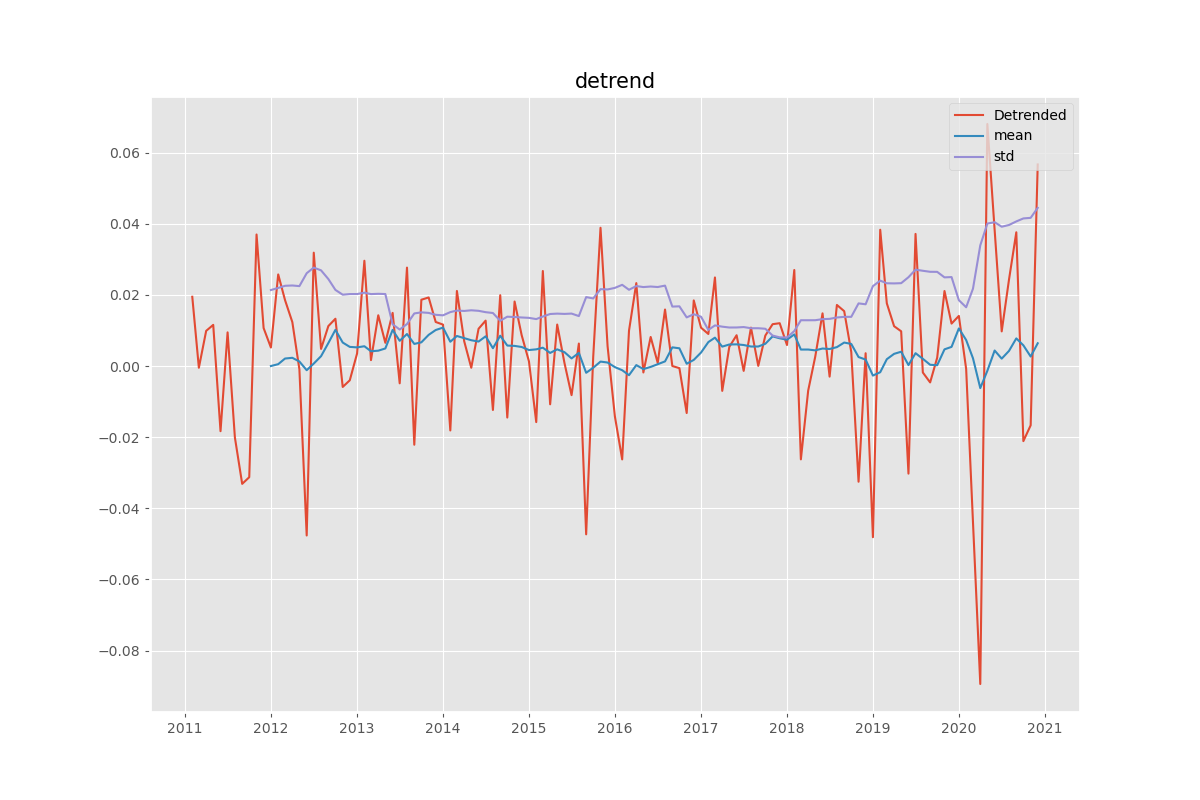
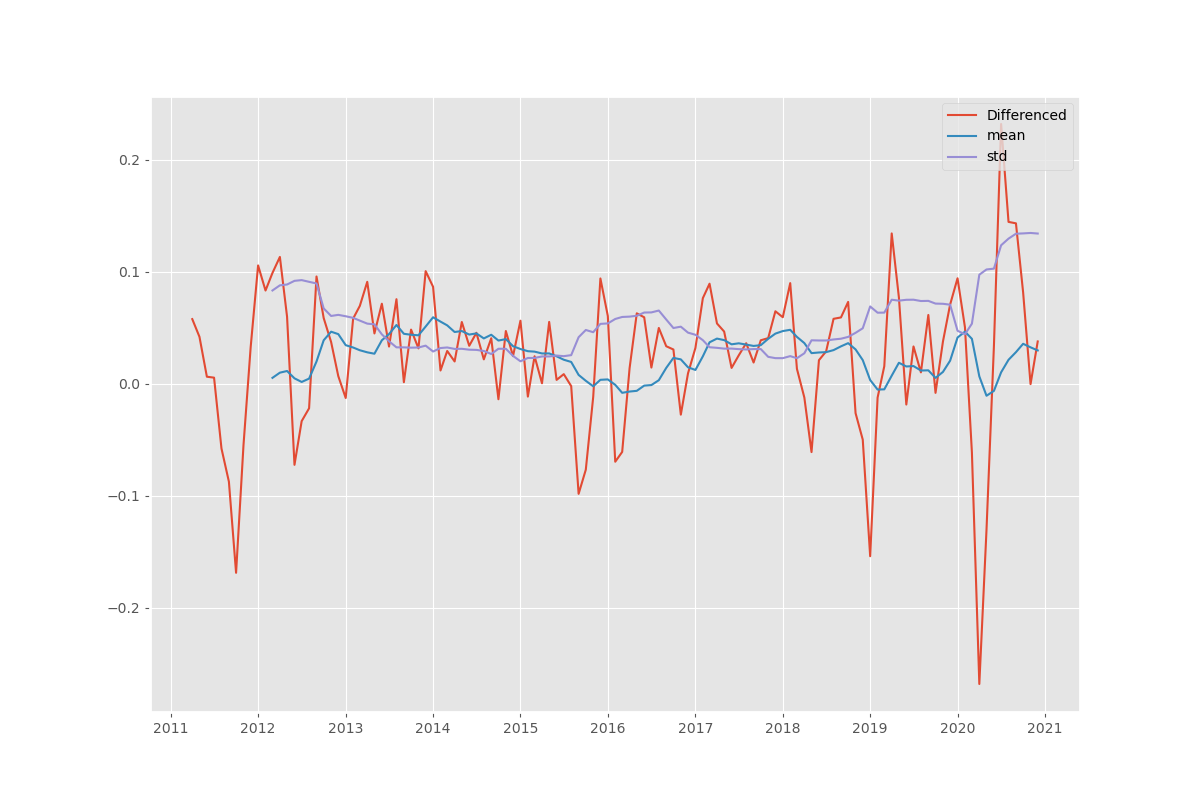


- p-value > 0.05 = reject null (nonstationary)
- p-value ≤ 0.05 = fail to reject null (stationary)
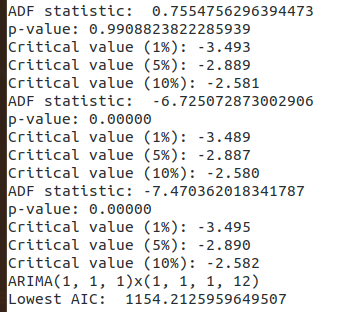

- Fit by Grid Search to find lowest AIC - Fit data to Model
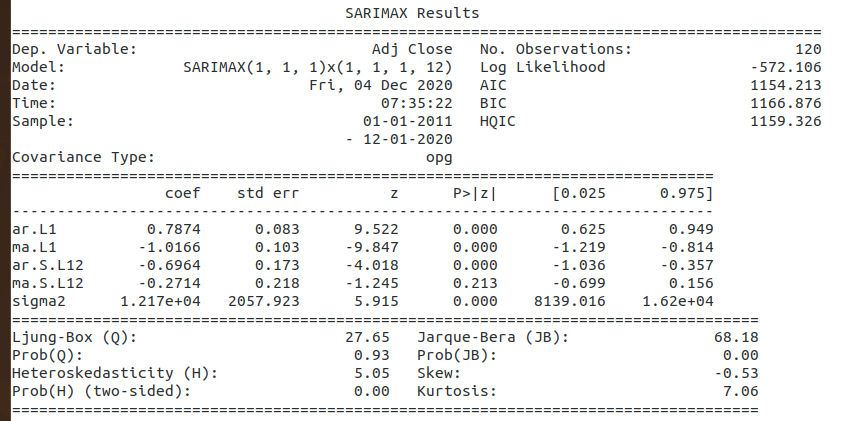
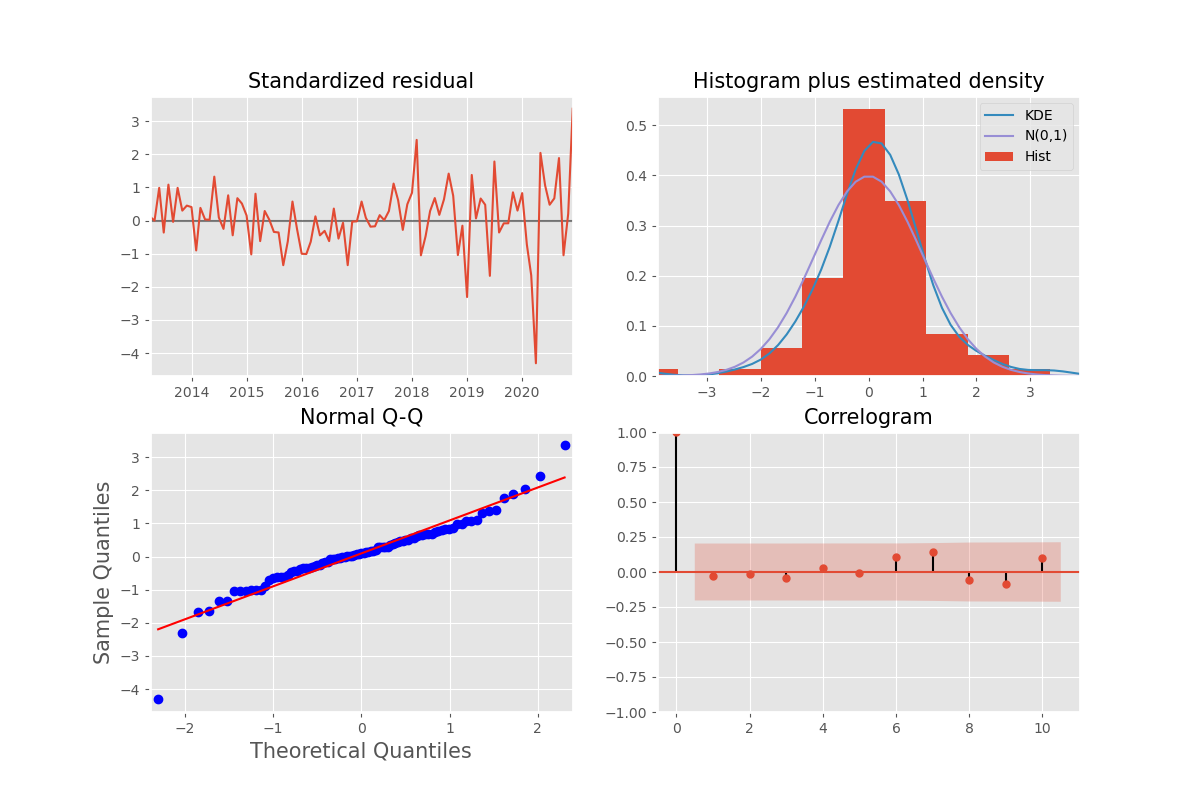


- Upper & Lower Bounds of Fitted Parameters (7 year Rolling Perdictions - Trailing)
- 95% Confidence Interval (shaded Section)
- Forcast 6 months into future
- perdiction widens to reflect loss of certainty in the market outlook
- Over time the market outperforms other assets
- Every year your money in your savings account is losing money due to inflation
- Generate portfolio from components of SP500

- Use z-score to normalize data
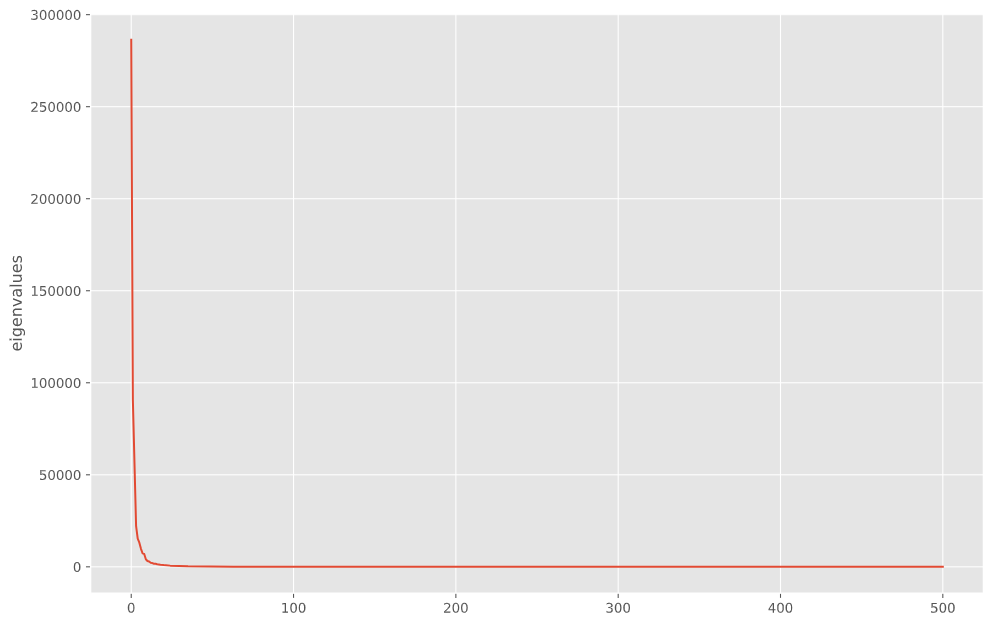
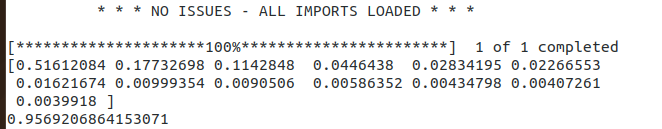
- Perform Kernel-PCA on the 505 component stocks within the S&P 500 Index
- Generate Outputs:
- EigenVectors - direction of principal component line
- EigenValues - amount of variance each component stock (eigenvector) of the S&P 500 Index generates onto the overall price fluctuations over time