strange 'emsc' displaying on axis and legend
mathieujobin opened this issue · comments

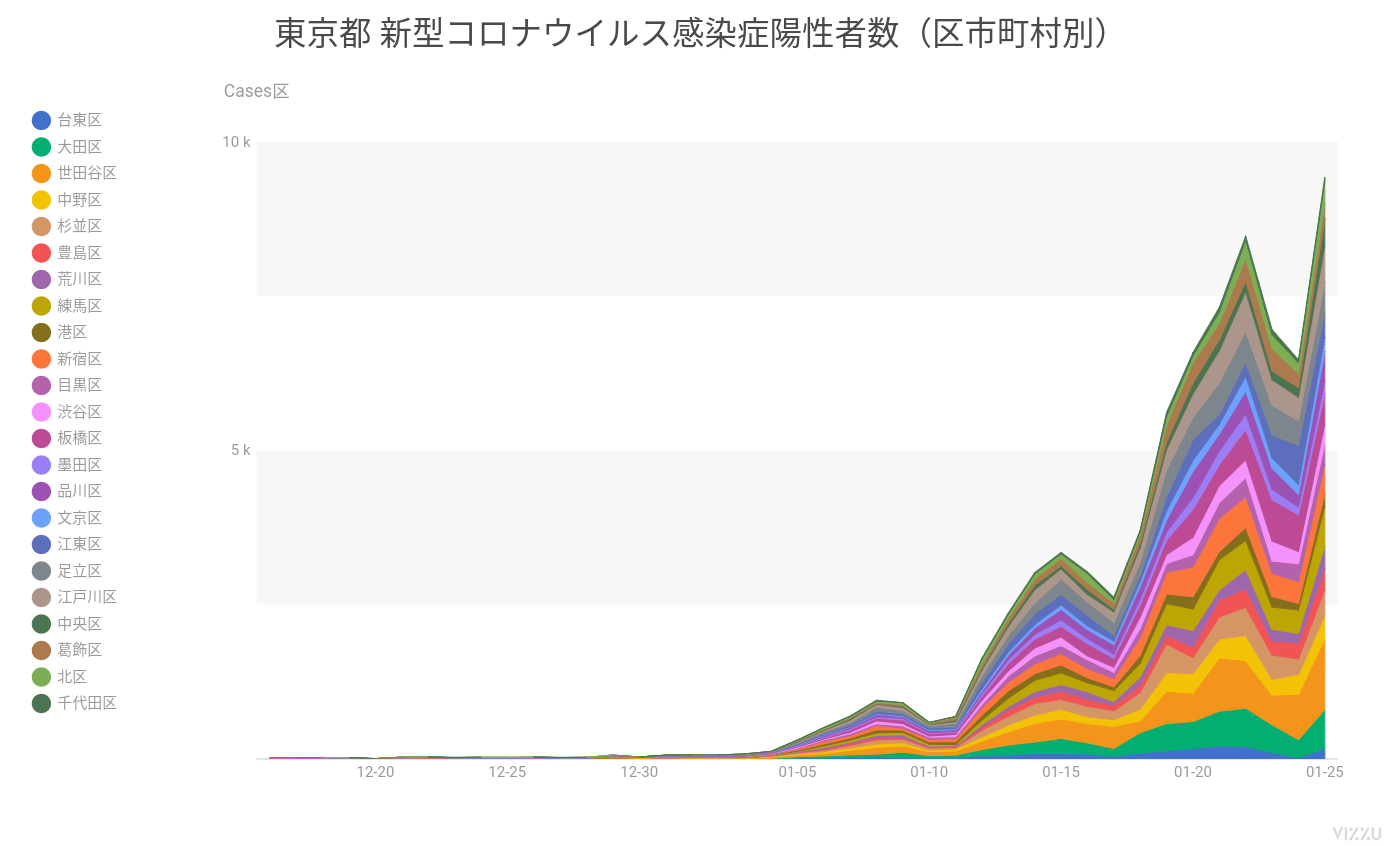
I see this emsc appearing on my legend and axis
but this isn't part of my data.

any idea where is this coming from?
Thanks

Hi, this bug should not appear in the newest version 0.4.2. Which version do you use?
looks like I am a little behind...
https://cdn.jsdelivr.net/npm/vizzu@0.3.1/dist/vizzu.min.js
can I just bump the version in there?
Thanks, I've upgraded to 0.4.2
emsc no longer appears, but the legend still shows a blank entry
https://covid19.solidcode.bz/covid/tokyo_cases_per_city
I am not seeing a hole in my data? https://covid19.solidcode.bz/covid/tokyo_cases_per_city_data.js
its a minor annoyance for me, but could be more problematic for others
I'm not seeing the blank entry on the link. Am I missing something?
Ok, I managed to reproduce the problem. Thanks for the report.
awesome to hear you found the bug with the legend !
I found another bug, I don't know if you prefer me to open a new issue, but the y-avis values disappear after doing some animation.
I'm switching data series.
please check my updated version, with more buttons to switch data
https://covid19.solidcode.bz/covid/tokyo_cases_per_city
I see, it seems to be unrelated. Could you please open another issue for it? Thanks for reporting these.
I've managed to find the problem. It is not a bug in the library. The problem is caused by the "plot-axis-label-draw" event handler, which works on both axles and filters out the labels on the Y axis.
One solution with the current version would be to check the event.data.rect object inside the event handler to detect which axis the actual label belongs to.
Thank you so much for this insight.. I'll look for a solution for this as well and post it to the relevant issue, I think #63 is where I got the hack for the axis.
Thanks to you, my y-axis problem is now solved
this issue can now be considered fixed. what is left is described in #67