ret-sync
ret-sync stands for Reverse-Engineering Tools synchronization. It's a set of plugins that help to synchronize a debugging session (WinDbg/GDB/LLDB/OllyDbg2/x64dbg) with IDA disassembler. The underlying idea is simple: take the best from both worlds (static and dynamic analysis).
From debuggers and dynamic analysis we got:
- local view, with live dynamic context (registers, memory, etc.)
- built-in specialized features/API (ex: Windbg's !peb, !drvobj, !address, etc.)
From IDA and static analysis we got:
- macro view over modules
- code analysis, signatures, types, etc.
- fancy graph view
- persistent storage of knowledge within IDBs
Keys features:
- Pass data (comment, command output) from debugger to disassembler (IDA)
- Multiple IDBs can be synced at the same time allowing to easily trace through multiple modules
- No need to deal with ALSR, addresses are rebased on-the-fly
- IDBs and debugger can be on different hosts
ret-sync is a fork of qb-sync that I developed and maintained during my stay at Quarkslab.
Content
ext_windbg/sync: WinDbg extension source files, once built:sync.dllext_gdb/sync.py: GDB pluginext_lldb/sync.py: LLDB pluginext_olly: OllyDbg v2 pluginext_x64dbg: x64dbg pluginext_ida/SyncPlugin.py: IDA plugin, receive async events from brokerext_ida/sync/broker.py:- bind a socket on a random port
- connect to dispatcher
- just a socket->stdout event pump
ext_ida/sync/dispatcher.py:- bind a TCP socket on localhost:9100 by default (see "Configuration file"),
- receive events from a debugger
- dispatch events to appropriate idb through their broker
Prerequisites
Since IDA 6.9, IDAPython moved from PySide to PyQt5. No prerequisite in that situation.
For owner of older versions, this plugin makes use of PySide (Python + Qt) binding. Depending on your version (PySide is shipped by default since IDA 6.6), you may need to look at:
- http://www.hex-rays.com/products/ida/support/download.shtml
- for installation notes see: http://www.hexblog.com/?p=333
A development environment (preferably Visual Studio 2013 or greater) is required to build the WinDbg's extension (see "Build it" section).
Python is required by various scripts. argparse is
included in Python standard libraries for release >= 2.7.
Build it
Use the Visual Studio 2013 solution provided in ext_windbg,
(see http://www.visualstudio.com/en-us/news/vs2013-community-vs.aspx if needed).
Use it
If necessary, set:
PYTHON_PATHinSyncPlugin.pyBROKER_PATHinSyncPlugin.py, by default look forbroker.pyin current plugin pathHOSTinbroker.py, localhost is the default interface.
broker.pyandsync.dllcheck for a configuration file named.syncin user's home directory. (IDA's side broker.py and dispatcher.py actually look for the configuration file in the IDB's directory first). Content of this file overwrite default values. It should respect a.inifile format:[INTERFACE] host=127.0.0.1 port=9100
(This file is not created by default)
Open IDB
In the
Debugtoolbar, click the ret-sync icon to start the plugin
You will be prompted to enter the name of the executable:
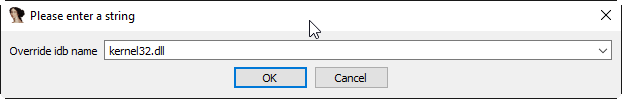
If all is well, the icon should change to blue

and the following be printed in IDA's Output windows:
[*] << broker << dispatcher not found, trying to run it
[*] << broker << dispatcher now runs with pid: 8488
[*] << broker << connected to dispatcher
[*] << broker << listening on port 2085
[*] << broker << dispatcher msg: add new client (listening on port 2085), nb client(s): 1
Launch WinDbg on target
Load extension:
0:000> .load sync
[sync.dll] DebugExtensionInitialize, ExtensionApis loaded
Sync Windbg:
0:000> !sync
[sync] No argument found, using default host (127.0.0.1:9100)
[sync] sync success, sock 0x5a8
[sync] probing sync
[sync] sync is now enabled with host 192.168.208.1
In IDA's Output window:
[*] << broker << dispatcher msg: new debugger client: dbg connect - HostMachine\HostUser

If Windbg's current module match IDA file name:

[sync] idb is enabled with the idb client matching the module name.
Use WinDbg and enjoy IDA's activity

Extra commands
!syncoff
Stop synchronization
!synchelp
Display the list of available commands with short explanation.
!cmt [-a address] <string>
Add comment at current eip in IDA::
[WinDbg]
0:000:x86> pr
eax=00000032 ebx=00000032 ecx=00000032 edx=0028eebc esi=00000032 edi=00000064
eip=00430db1 esp=0028ed94 ebp=00000000 iopl=0         nv up ei pl nz na po nc
cs=0023  ss=002b  ds=002b  es=002b  fs=0053  gs=002b             efl=00000202
image00000000_00400000+0x30db1:
00430db1 57    push    edi

0:000:x86> dd esp 8
0028ed94  00000000 00433845 0028eebc 00000032
0028eda4  0028f88c 00000064 002b049e 00000110

0:000:x86> !cmt 0028ed94  00000000 00433845 0028eebc 00000032
[sync.dll]  !cmt called

[IDA]
.text:00430DB1    push    edi             ; 0028ed94  00000000 00433845 0028eebc 00000032
!rcmt [-a address]
Reset comment at current ip in IDA::
[WinDbg]
0:000:x86> !rcmt
[sync] !rcmt called

[IDA]
.text:00430DB1    push    edi
!fcmt [-a address] <string>
Add a function comment for function in which current ip is located:
[WinDbg]
0:000:x86> !fcmt decodes buffer with key
[sync] !fcmt called

[IDA]
.text:004012E0 ; decodes buffer with key
.text:004012E0                 public decrypt_func
.text:004012E0 decrypt_func    proc near
.text:004012E0                 push    ebp
Note: calling this command without argument reset the function's comment.
!raddr <expression>
Add a comment with rebased address evaluated from expression
!rln <expression>
Get symbol from the idb for the given address
!lbl [-a address] <string>
Add a label name at current ip in IDA:
[WinDbg]
0:000:x86> !lbl meaningful_label
[sync] !lbl called

[IDA]
.text:000000000040271E meaningful_label:
.text:000000000040271E    mov     rdx, rsp
!cmd <string>
Execute a command in WinDbg and add its output as comment at current eip in IDA::
[WinDbg]
0:000:x86> pr
eax=00000032 ebx=00000032 ecx=00000032 edx=0028eebc esi=00000032 edi=00000064
eip=00430db1 esp=0028ed94 ebp=00000000 iopl=0         nv up ei pl nz na po nc
cs=0023  ss=002b  ds=002b  es=002b  fs=0053  gs=002b             efl=00000202
image00000000_00400000+0x30db1:
00430db1 57     push    edi
[sync.dll]  !cmd r edi

[IDA]
.text:00430DB1    push    edi             ; edi=00000064
!bc <||on|off|set 0xBBGGRR>>
Enable/disable path coloring in IDA. This is NOT a code tracing tool, there are efficient tools for that. Each manually stepped instruction is colored in the graph. Color a single instruction at current eip if called without argument. "set" argument is used to set path color with a new hex rgb code (reset color if called with a value > 0xFFFFFF).
!idblist
Get list of all IDB clients connected to the dispatcher::
[WinDbg]
0:000> !idblist
> currently connected idb(s):
    [0] target.exe
!syncmodauto <on|off>
Enable/disable idb auto switch based on module name::
[WinDbg]
0:000> !syncmodauto off

[IDA]
[*] << broker << dispatcher msg: sync mode auto set to off
!idbn <n>
Set active idb to the nth client. n should be a valid decimal value. This is a semi-automatic mode (personal tribute to the tremendous jj).:
[WinDbg]
0:000:> !idbn 0
> current idb set to 0
In this example, current active idb client would have been set to:
[0] target.exe.
!jmpto <expression>
Expression given as argument is evaluated in the context of the current debugger's status. IDA's view is then synced with the resulting address if a matching module is registered. Can be seen as a manual synching, relocation is automatically performed, on the fly. Especially useful for randomly relocated binary.
!jmpraw <expression>
Expression given as argument is evaluated in the context of the current debugger's status. If an idb is enable then IDA's view is synced with the resulting address. Address is not rebased and there is no idb switching. Especially useful for dynamically allocated/generated code.
!modmap <base> <size> <name>
A synthetic ("faked") module (defined using its base address and size) is added to the debugger internal list. From msdn: "If all the modules are reloaded - for example, by calling Reload with the Module parameter set to an empty string - all synthetic modules will be discarded." It can be used to more easily debug dynamically allocated/generated code.
!modunmap <base>
Remove a previously mapped synthetic module at base address.
!modcheck <||md5>
Use to check if current module really matches IDB's file (ex: module has been updated) When call without argument, pdb's GUID from Debug Directory is used. It can also use md5, but only with local debuggee (not in remote kernel debugging).
!bpcmds <||save|load|>
bpcmds wrapper, save and reload .bpcmds (breakpoints commands list) output to current idb. Display (but not execute) saved data if called with no argument. Persistent storage is achieved using IDA's netnode feature.
!ks
This command is a DML enhanced output of 'kv' command. Code Addresses are clickable (!jmpto) as well as data addresses (dc).
!translate <base> <addr> <mod>
Meant to be used from IDA (Alt-F2 shortcut), rebase an address with respect to its module's name and offset.
Address optional argument
!cmt, !rcmt and !fcmt commands support an optional address option: -a or --address.
Address should be passed as an hexadecimal value. Command parsing is based on python's
module argparse. To stop line parsing use --.:
[WinDbg]
0:000:x86> !cmt -a 0x430DB2 comment
The address has to be a valid instruction's address.
IDA bindings over Windbg commands:
Syncplugin.py also registers Windbg command wrapper hotkeys.
- F2 - Set breakpoint at cursor address
- F3 - Set one-shot breakpoint at cursor address
- Ctrl-F2 - Set hardware breakpoint at cursor address
- Ctrl-F3 - Set one-shot hardware breakpoint at cursor address
- Alt-F2 - Translate (rebase in debugger) current cursor address
- F5 - Go
- F10 - Single step
- F11 - Single trace
These commands are only available when the current idb is active. When possible they have also been implemented for others debuggers.
GNU gdb (GDB)
GDB support is experimental, however:
Load extension (see auto-load-scripts):
gdb> source sync.py
[sync] configuration file loaded 192.168.52.1:9100
[sync] commands added
Sync with host:
gdb> sync
[sync] sync is now enabled with host 192.168.52.1
<not running>

gdb> r
Starting program: /bin/ls
[Thread debugging using libthread_db enabled]
Using host libthread_db library "/lib/libthread_db.so.1".
Use commands, without "!" prefix:
(gdb) cmd x/i $pc
[sync] command output: => 0x8049ca3:    push   edi

(gdb) synchelp
[sync] extension commands help:
 > sync <host>
 > syncoff
 > cmt [-a address] <string>
 > rcmt [-a address] <string>
 > fcmt [-a address] <string>
 > cmd <string>
 > bc <on|off|>
LLDB
LLDB support is experimental, however:
Load extension (can also be added in ~/.lldbinit):
lldb> command script import sync
Sync with host:
lldb> process launch -s
lldb> sync
[sync] connecting to localhost
[sync] sync is now enabled with host localhost
[sync] event handler started
Use commands:
lldb> synchelp
[sync] extension commands help:
 > sync <host>                   = synchronize with <host> or the default value
 > syncoff                       = stop synchronization
 > cmt <string>                  = add comment at current eip in IDA
 > rcmt <string>                 = reset comments at current eip in IDA
 > fcmt <string>                 = add a function comment for 'f = get_func(eip)' in IDA
 > cmd <string>                  = execute command <string> and add its output as comment at current eip in IDA
 > bc <on|off|>                  = enable/disable path coloring in IDA
                                   color a single instruction at current eip if called without argument
lldb> cmt mooo
OllyDbg2
OllyDbg2 support is experimental, however:
- Build the plugin using the VS solution
- Copy the dll within Olly's plugin directory
- Use Plugins menu or shortcuts to enable (CTRL+s)/disable (CTRL+u) synchronization.
Due to the beta status of Olly2 API, only the following features have been implemented:
- Graph sync [use F7; F8 for stepping]
- Comment [use CTRL+;]
- Label [use CTRL+:]
x64dbg
Based on testplugin, https://github.com/x64dbg/testplugin. x64dbg support is experimental, however:
Build the plugin using the VS solution
Please note that plugin sdk is not redistributed with the solution. A copy can be found in each release of x64dbg.
Paste the "
pluginsdk" directory into "ext_x64dbg\x64dbg_sync"Copy the dll (extension is
.d32or.dp64) within x64dbg's plugin directory.Use commands to enable ("!sync") or disable ("!syncoff") synchronization.
Extend
While mostly focus on dynamic analysis, it is of-course possible to use other tools, see:
TODO
- Sure.
KNOWN BUGS/LIMITATIONS
- Tested with Python 2.7, IDA 6.4 to 6.9 (Windows, Linux and Mac OS X), GNU gdb (GDB) 7.4.1 (Debian), lldb 310.2.37.
- THERE IS NO AUTHENTICATION/ENCRYPTION or whatsoever between the parties; you're on your own.
- Self modifying code is out of scope.
With GDB:
- it seems that stop event is not called when using 'return' command.
- multi-threading debugging have issues with signals.
With Windbg:
- IDA's client plugin gets notified even though encountered breakpoint uses a command string that makes it continue ('g'). This can cause major slow-down if there are too much of these events. A limited fix has been implemented, the best solution is still to sync off temporarily.
- Possible race condition
With IDA:
- Graph window redrawing is quite slow for big graphs.
- ret-sync shortcuts conflicts in Linux environments.
LICENSE
ret-sync is free software: you can redistribute it and/or modify it under the terms of the GNU General Public License as published by the Free Software Foundation, either version 3 of the License, or (at your option) any later version.
This program is distributed in the hope that it will be useful, but WITHOUT ANY WARRANTY; without even the implied warranty of MERCHANTABILITY or FITNESS FOR A PARTICULAR PURPOSE. See the GNU General Public License for more details.
You should have received a copy of the GNU General Public License along with this program. If not, see http://www.gnu.org/licenses/.
GREETZ
Hail to Bruce Dang, StalkR, @Ivanlef0u, Damien Aumaître, Sébastien Renaud and Kévin Szkudlapski, _m00dy_ for their kindness, help, feedbacks and thoughts. Ilfak Guilfanov and Igor Skochinsky for their help with IDA's internals.