OBSERVABILITY WORKSHOP
OVERVIEW
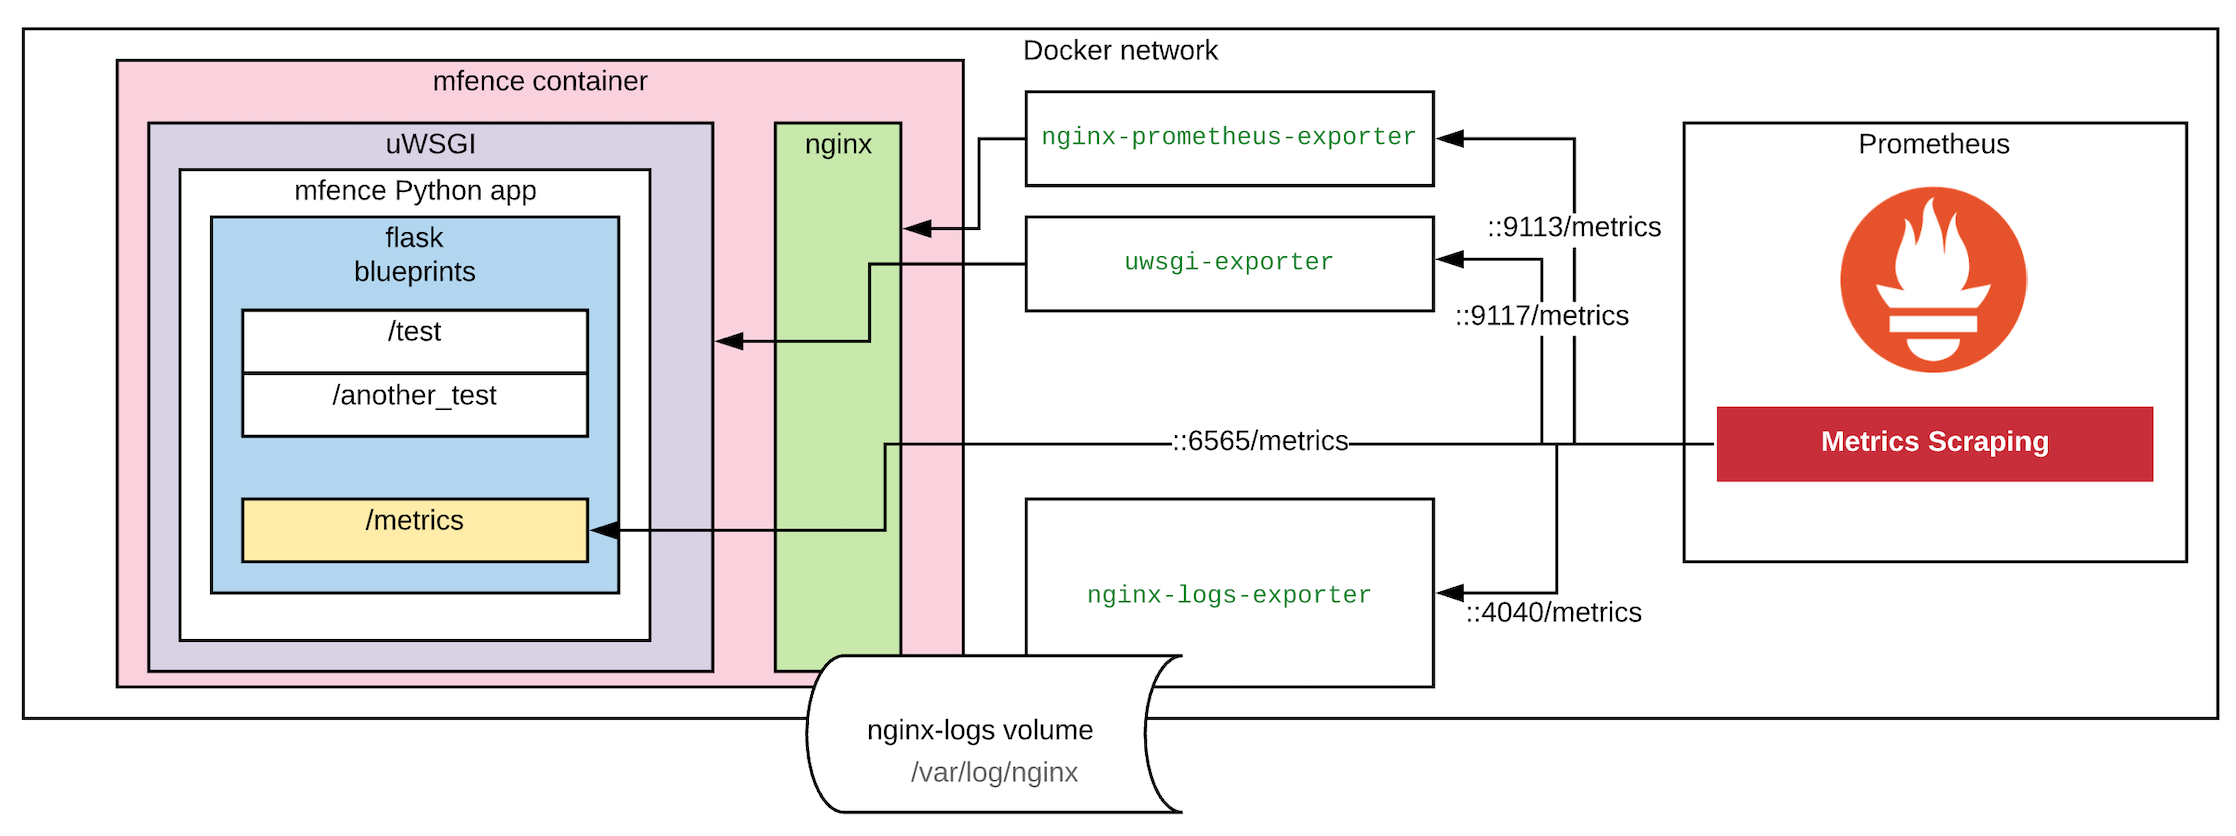
The files found in this repo comprise all the required artifacts to run a sample app and demonstrate the a few metrics' scraping scenarios. The sample app mfence is configured using the original fence app as inspiration, i.e., a single container running both Nginx (web server) and uWSGI (app server) to host a Python application that operates with Flask Blueprints.
All these 3 logical layers (nginx, uwsgi & python app) carry configuration changes and the addition of new HTTP endpoints to expose metrics, such as:
- Nginx: Number of active connections and HTTP I/O (Reading, Writing and Waiting) =
http://localhost:6565/nginx_status. - uWSGI: Workers' activity, status, data transmission, errors =
http://localhost:6565/uwsgi_status - mfence's
/metricsendpoint: This blueprint script produces fictitious metrics. The fake data illustrates what sort of application-specific metrics could be exposed to give service-owners more visibility on interesting events =http://localhost:6565/metrics/.
The following diagram illustrates how the metrics are obtained:
Other details to talk about
- Poetry
- Flask / Blueprints
- Dockerfile (and dynamic config changes in
dockerrun.sh)
Application metrics
Examine the src/mfence/blueprints/metrics.py script.
Running local test
brew install nginx
brew install uwsgi

# copy over the nginx.conf to /usr/local/etc/nginx/nginx.conf and set a diff port (e.g., 6567)

brew services restart nginx
uwsgi --socket 127.0.0.1:3031 --ini uwsgi-local-run.ini

# now just try: http://localhost:6567/
CHECK SOME STATS
pip install uwsgitop
uwsgitop http://127.0.0.1:9191
BUILDING THE DOCKER IMAGE
docker build --tag mfence:try1 .
START YOUR APP
docker run -it --rm -v $(pwd)/logs/:/var/log/nginx/ -p 6565:80 --name mfence mfence:try1
START THE NGINX METRICS EXPORTER
docker run -p 9113:9113 --rm --link mfence:mfence --name nginx-prometheus-exporter nginx/nginx-prometheus-exporter:0.8.0 -nginx.scrape-uri http://mfence/nginx_status
START THE UWSGI METRICS EXPORTER
docker run --rm -it -p 9117:9117 --link mfence:mfence --name uwsgi-exporter timonwong/uwsgi-exporter --stats.uri http://mfence/uwsgi_status
START THE NGINX LOGS METRICS EXPORTER
docker run --rm --name nginx-logs-exporter -v $(pwd)/logs:/mnt/nginxlogs/ -p 4040:4040 quay.io/martinhelmich/prometheus-nginxlog-exporter mnt/nginxlogs/access_not_json.log
START PROMETHEUS CONTAINER
debug mode enabled in case you have any metrics scraping issues
docker run --rm -it -p 9090:9090 -v $(pwd)/prometheus.yml:/etc/prometheus/prometheus.yml --link mfence:mfence --link nginx-prometheus-exporter:nginx-prometheus-exporter --link uwsgi-exporter:uwsgi-exporter --link nginx-logs-exporter:nginx-logs-exporter --name myprometheus --entrypoint sh prom/prometheus -c "/bin/prometheus --config.file=/etc/prometheus/prometheus.yml --storage.tsdb.path=/prometheus --web.console.libraries=/usr/share/prometheus/console_libraries --web.console.templates=/usr/share/prometheus/consoles --log.level=debug"
TESTING
Check the following URLs:
# your app metrics
http://localhost:6565/metrics/

# your nginx stats info (not in prometheus-scraping format)
http://localhost:6565/nginx_status

# your uwsgi stats info (not in prometheus-scraping format)
http://localhost:6565/uwsgi_status

# your nginx metrics
http://localhost:9113/metrics

# your uwsgi metrics
http://localhost:9117/metrics

# your nginx logs metrics
http://localhost:4040/metrics

# your Prometheus console
http://localhost:9090/
START GRAFANA CONTAINER
docker run -it --rm --link prometheus:prometheus --name grafana -p 3001:3000 grafana/grafana:7.1.1
STOP ALL CONTAINERS AND TRY DOCKER-COMPOSE
# start all
docker-compose up -d

# stop all
docker-compose down
DOCKER CLEANUP COMMANDS
docker stop $(docker ps -a -q)
docker rm $(docker ps -a -q)
docker rmi $(docker images | grep "<none>" | awk '{ print $3}')
Some queries
Just a few prometheus queries to play around with the metrics:
avg(cirrus_retries)
rate(uwsgi_worker_transmitted_bytes_total[5m])
rate(nginx_http_response_count_total{status="200", method="GET"}[5m])
# TODO: Add more interesting queries
# e.g., "success rate ((num_failures / total_reqs)*100 )
Screenshots
How it looks like once you put it all together: TODO: Add screenshots
