Modeling Scenarios for Covid-19
library(tidyverse)
library(tidyquant)
library(crayon)
library(kableExtra)
library(ggrepel)

theme_set(theme_tq())
# updated every ~4 hours
# cases_data <- suppressMessages(read_csv("http://hgis.uw.edu/virus/assets/virus.csv"))

latest_file <- paste0("hgis virus data/",Sys.Date()," virus.csv")
if(!file.exists(latest_file)){

  download.file("http://hgis.uw.edu/virus/assets/virus.csv", destfile = latest_file)

}

cases_data <- suppressMessages(read_csv(latest_file))


message("Data from ", min(cases_data$datetime)," to ",max(cases_data$datetime))
## Data from 2020-01-21 to 2020-03-26
max_date <-
cases_data %>%
select(datetime, `new york`) %>%
na.omit() %>% summarise(max_date = max(datetime)) %>%
pull(max_date)
ny_cases <-
cases_data %>%
select(datetime, `new york`) %>%
na.omit() %>%
separate(`new york`, into = c("Confirmed","Suspected","Cured","Deaths")
, sep = "-", extra = "warn", remove = F) %>%
mutate_at(vars(Confirmed:Deaths), as.numeric) %>%
mutate(Active = Confirmed+Suspected-Cured-Deaths) %>%
filter(datetime == max(datetime))
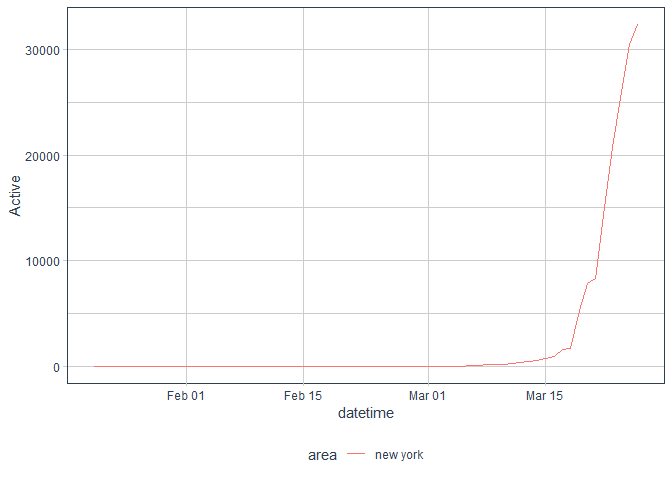
message("Number of confirmed NY cases as of ",max_date,": ", ny_cases$Confirmed,"\n")## Number of confirmed NY cases as of 2020-03-26: 32741
message("Number of active NY cases as of ",max_date,": ",ny_cases$Active)## Number of active NY cases as of 2020-03-26: 32407
source("04 - Process Case Data.R")NYC cases vs. advanced scenarios: Italy and Chinese provinces
source("00 - Recording NYC Cases.R")## # A tibble: 24 x 3
## Var value percent
## <chr> <chr> <dbl>
## 1 Total 21873 NA
## 2 Median Age (Range) 47 0
## 3 Age Group <NA> NA
## 4 - 0 to 17 470 2
## 5 - 18 to 44 9618 44
## 6 - 45 to 64 7445 34
## 7 - 65 to 74 2471 11
## 8 - 75 and over 1826 8
## 9 - Unknown 43 NA
## 10 Age 50 and over <NA> NA
## 11 - Yes 9863 45
## 12 - No 11967 55
## 13 Sex <NA> NA
## 14 - Female 9557 44
## 15 - Male 12278 56
## 16 - Unknown 38 NA
## 17 Borough <NA> NA
## 18 - Bronx 3924 18
## 19 - Brooklyn 5705 26
## 20 - Manhattan 3907 18
## 21 - Queens 7026 32
## 22 - Staten Island 1276 6
## 23 - Unknown 35 NA
## 24 Deaths 281 NA
processed %>%
  filter(Country%in%c("China","italy"), area!="hubei") %>%
  bind_rows(NYC_reports %>% mutate(Country = "NYC")) %>%
  group_by(area) %>%
  filter(Confirmed>20) %>%
  mutate(days_since_reported = 1:n()) %>%
  ggplot()+
  aes(x = days_since_reported, y = Confirmed, group = area, color = Country)+
  geom_line(size = 2, alpha = 0.6) +
  theme_tq()+
  scale_color_tq()+
  theme(legend.position = "bottom")+
  scale_y_log10()+
  labs(title = "NYC Covid-19 cases currently tracking closer to Italy than Chinese provinces"
       , y = "Log Scale Count of Confirmed Cases"
       , x = "Days since reaching 20 reported cases"
       , caption = "Source: http://hgis.uw.edu/virus/assets/virus.csv\n NYC data collected by hand")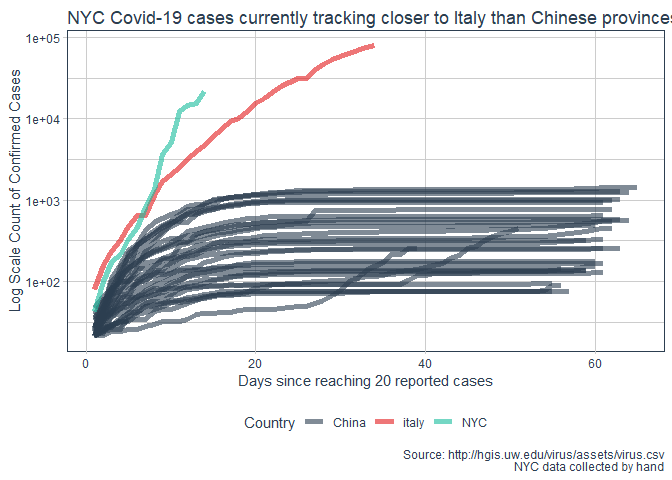
processed %>%
  filter(area%in%c("US","italy")) %>%
  bind_rows(NYC_reports %>% mutate(Country = "NYC")) %>%
  group_by(area) %>%
  filter(Confirmed>20) %>%
  mutate(days_since_reported = 1:n()) %>%
  ggplot()+
  aes(x = days_since_reported, y = Deaths, group = area, color = Country)+
  geom_line(size = 2, alpha = 0.6) +
  theme_tq()+
  scale_color_tq()+
  theme(legend.position = "bottom")+
  labs(title = "Covid-19 deaths NYC vs. Italy"
       , y = "Deceased"
       , x = "Days since reaching 20 reported cases"
       , caption = "Source: http://hgis.uw.edu/virus/assets/virus.csv\n NYC data collected by hand")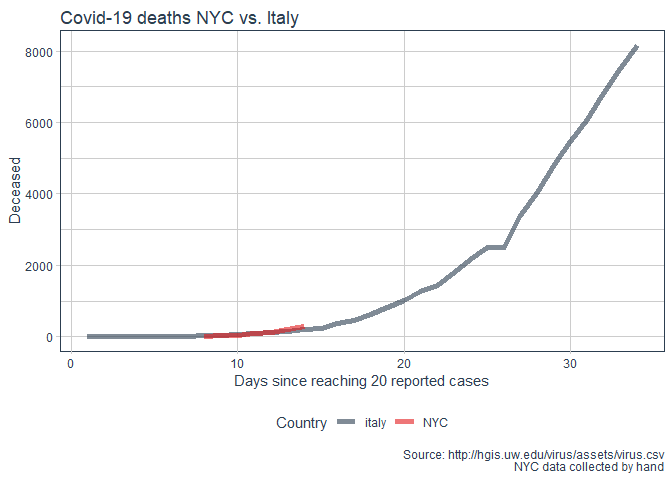
processed %>%
  filter(area%in%c("US","italy", "hubei")) %>%
  bind_rows(NYC_reports %>% mutate(Country = "NYC")) %>%
  group_by(area) %>%
  filter(Deaths>10) %>%
  mutate(days_since_reported = 1:n()) %>%
  mutate(Deaths = log(Deaths)) %>%
  ggplot()+
  aes(x = days_since_reported, y = Deaths, group = area, color = area)+
  geom_line(size = 2, alpha = 0.6) +
  theme_tq()+
  scale_color_tq()+
  #scale_y_log10()+
  theme(legend.position = "bottom")+
  labs(title = "Covid-19 deaths NYC, Italy, Wuhan"
       , y = "Deceased, log scale"
       , x = "Days since reaching 10 reported deaths"
       , caption = "Source: http://hgis.uw.edu/virus/assets/virus.csv\n NYC data collected by hand")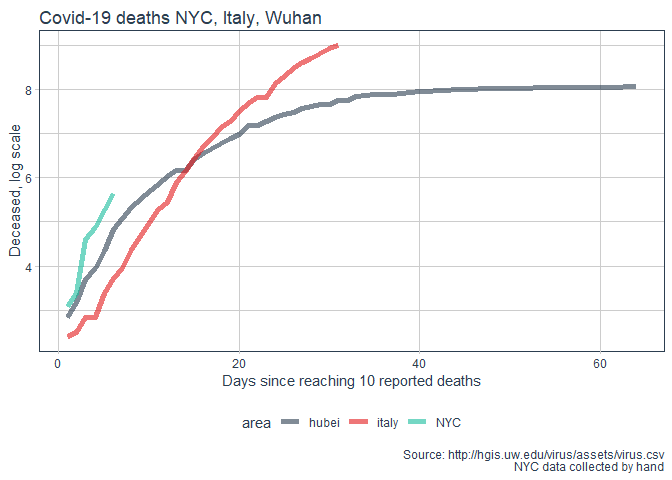
processed %>%
  filter(Country%in%c("China","italy"), area!="hubei") %>%
  bind_rows(NYC_reports %>% mutate(Country = "NYC")) %>%
  arrange(desc(Country)) %>%
  group_by(area) %>%
  filter(Confirmed>20) %>%
  mutate(days_since_reported = 1:n()) %>%
  filter(days_since_reported<20) %>%
  ggplot()+
  aes(x = days_since_reported, y = Confirmed, group = area, color = Country)+
  geom_line(size = 2, alpha = 0.5) +
  theme_tq()+
  scale_color_tq()+
  theme(legend.position = "bottom")+
 labs(title = "NYC Covid-19 cases days 1-20"
       , y = "(Actual) Count of Confirmed Cases"
       , x = "Days since reaching 20 reported cases"
       , caption = "Source: http://hgis.uw.edu/virus/assets/virus.csv\n NYC data collected by hand")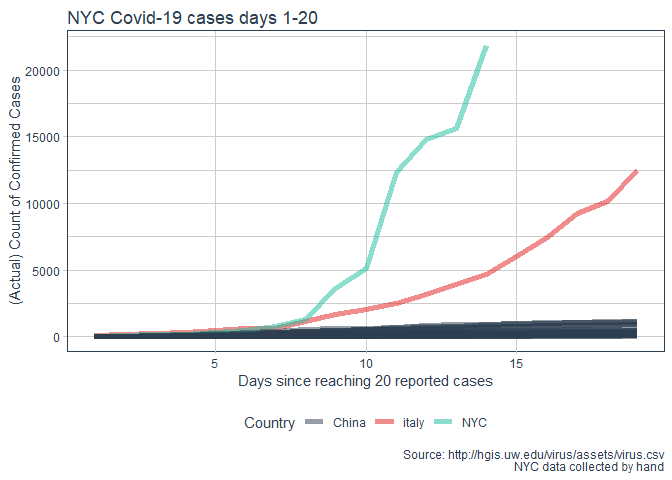
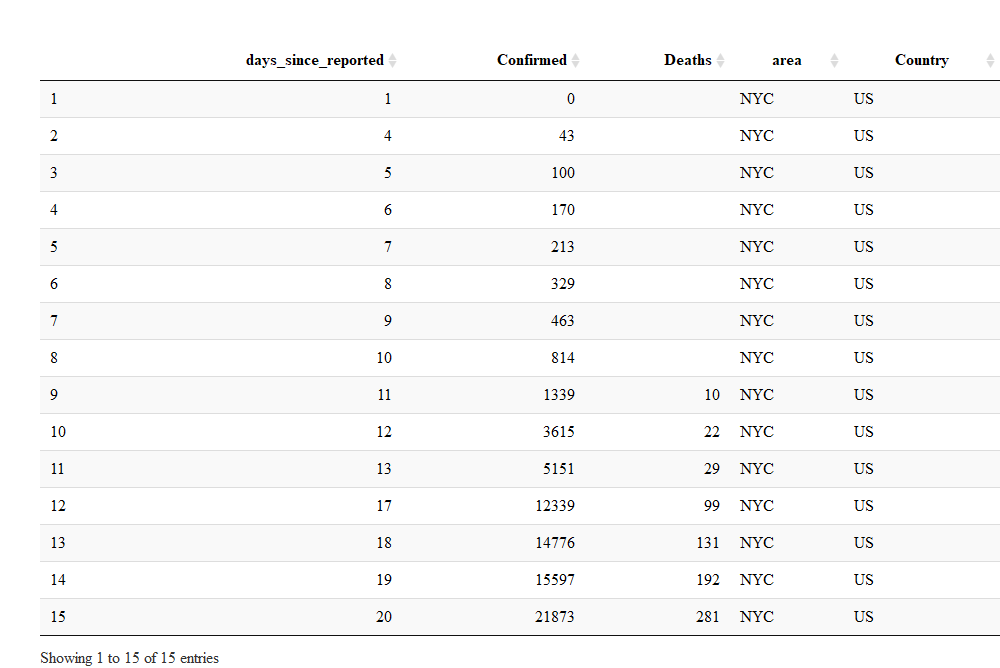
library(DT)
NYC_reports %>%
  datatable(options = list(paging = F, searching = F))
processed %>%
  filter(area%in% us_state_names) %>%
  group_by(area) %>%
  filter(Confirmed>20) %>%
  mutate(days_since_reported = 1:n()) %>%
   mutate(label = if_else(days_since_reported == max(days_since_reported) & Confirmed>1000
                         , as.character(area), NA_character_)) %>%
  ggplot()+
  aes(x = days_since_reported, y = Confirmed, color = area)+
  geom_line(size = 1)+
  geom_label_repel(aes(label = label),
                   nudge_x = 1,
                   na.rm = TRUE) +
  theme_tq()+
  theme(legend.position = "none")+
  scale_color_tq(theme = "light")+
  labs(x = "Days since reaching 20 cases"
       , y = "Confirmed Cases")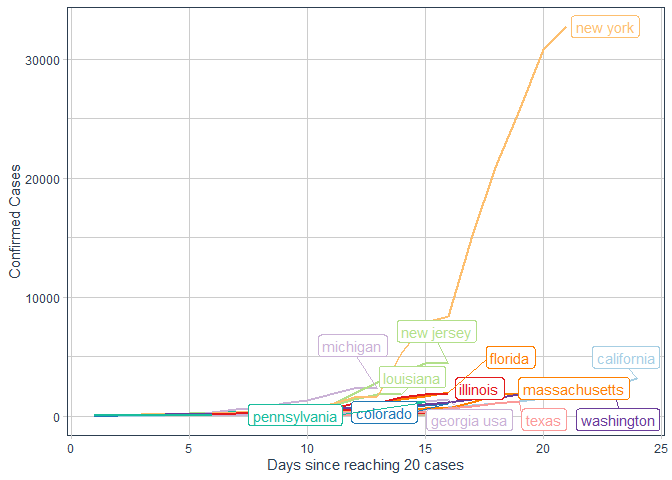
processed %>%
  filter(area%in% us_state_names) %>%
  group_by(area) %>%
  filter(Confirmed>20) %>%
  mutate(days_since_reported = 1:n()) %>%
  ggplot()+
  aes(x = days_since_reported, y = Confirmed, color = area)+
  geom_line(size = 1)+
  theme_tq()+
  scale_color_tq(theme = "light")+
  scale_y_log10()+
  labs(x = "Days since reaching 20 cases"
       , y = "Confirmed Cases log scale")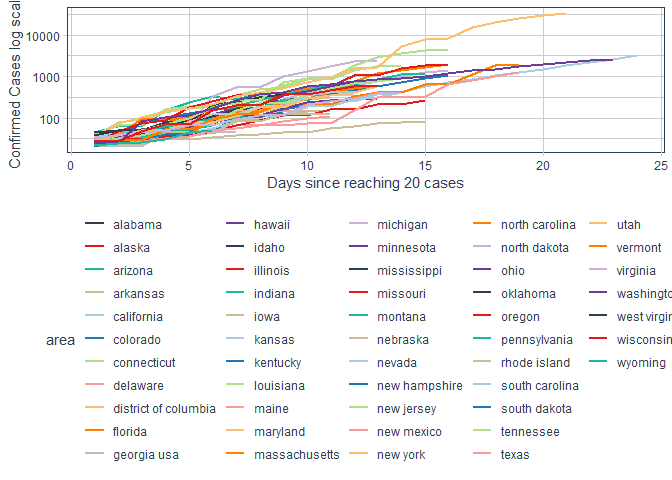
processed %>%
  filter(Country!="Other") %>%
  filter(Active>20) %>%
  group_by(area) %>%
  mutate(days_since_reported=1:n()) %>%
  mutate(label = ifelse(days_since_reported==max(days_since_reported) &
                            Active>2000, area, NA_character_)) %>%
  ggplot()+
  aes(x = days_since_reported, y = Active, group = area, label = area, color = Country)+
  geom_line()+

  geom_text(aes(label = label))+
  scale_color_tq()+
  theme_tq()+
  theme(plot.title.position = "plot")+
  labs(title = "Active Cases Worldwide"
       , x = "days since reacing 20 active cases")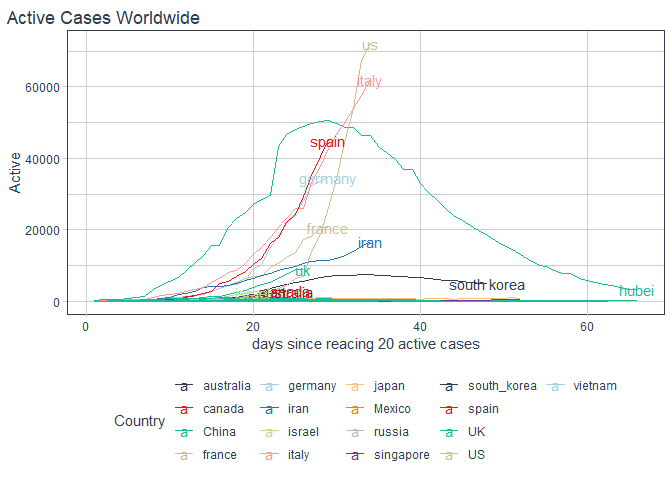
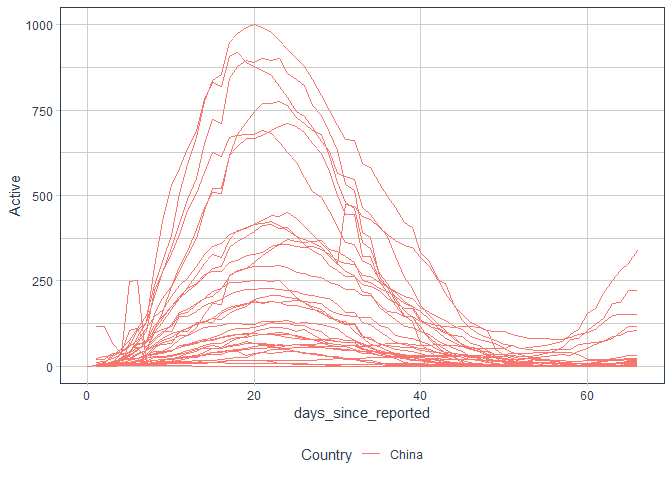
Most advanced cases - Chinese Provinces
processed %>%
  filter(Country=="China", area!="hubei") %>%
  ggplot()+
  aes(x = days_since_reported, y = Active, group = area, label = area, color = Country)+
  geom_line()
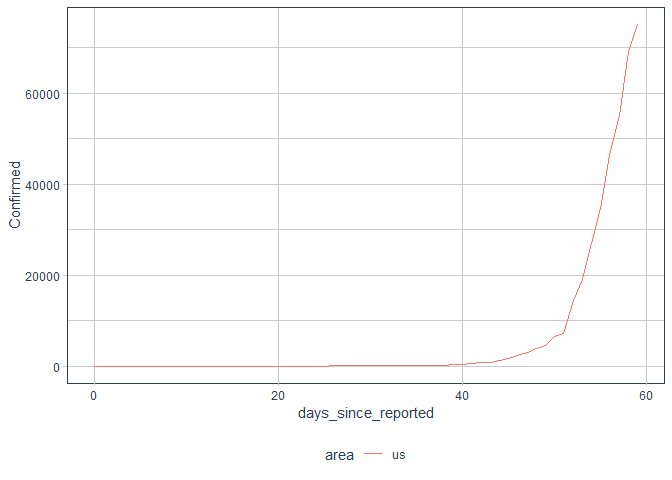
processed %>%
  filter(Country=="US") %>%
  ggplot()+
  aes(x = days_since_reported, y = Confirmed, color = area)+
  geom_line()
processed %>%
  filter(area%in% c("us","italy","canada","france","australia"
                    ,"germany","israel","uk","greece","spain")) %>%
  group_by(area) %>%
  filter(Confirmed>20) %>%
  mutate(days_since_reported = 1:n()) %>%
  mutate(label = if_else(days_since_reported == max(days_since_reported)
                         , as.character(area), NA_character_)) %>%
  ggplot()+
  aes(x = days_since_reported, y = Active, color = area)+
  geom_line()+
  geom_label_repel(aes(label = label),
                   nudge_x = 1,
                   na.rm = TRUE) +
  theme_tq()+
  scale_color_tq()+
  labs(x = "Days since reaching 20 cases"
       , y = "Active Cases")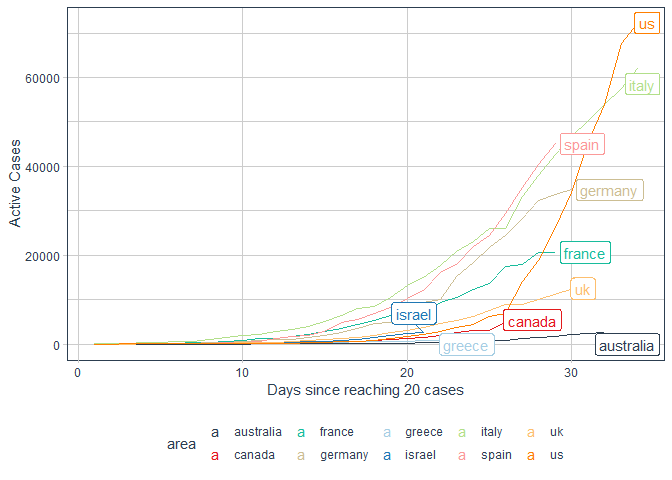
processed %>%
  filter(area%in% c("us","canada","france","australia","germany","israel","spain","italy")) %>%
  group_by(area) %>%
  filter(Confirmed>20) %>%
  mutate(days_since_reported = 1:n()) %>%
  mutate(label = if_else(days_since_reported == max(days_since_reported) #& Active>500
                         , as.character(area), NA_character_)) %>%
  ggplot()+
  aes(x = days_since_reported, y = Active, color = area)+
  geom_line()+
  geom_label_repel(aes(label = label),
                   nudge_x = 1,
                   na.rm = TRUE) +
  theme_tq()+
  scale_color_tq()+
  scale_y_log10()+
  labs(x = "Days since reaching 20 cases"
       , y = "Active Cases Log Scale")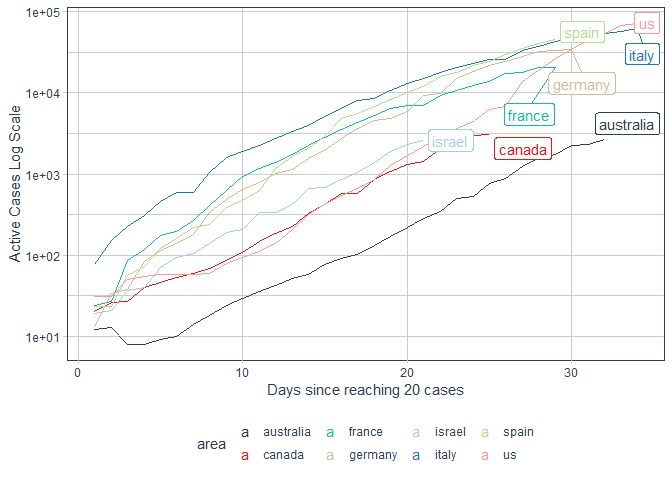
processed %>%
  filter(area %in% "new york") %>%
  ggplot()+
  aes(x = datetime, y = Active, color = area)+
  geom_line()