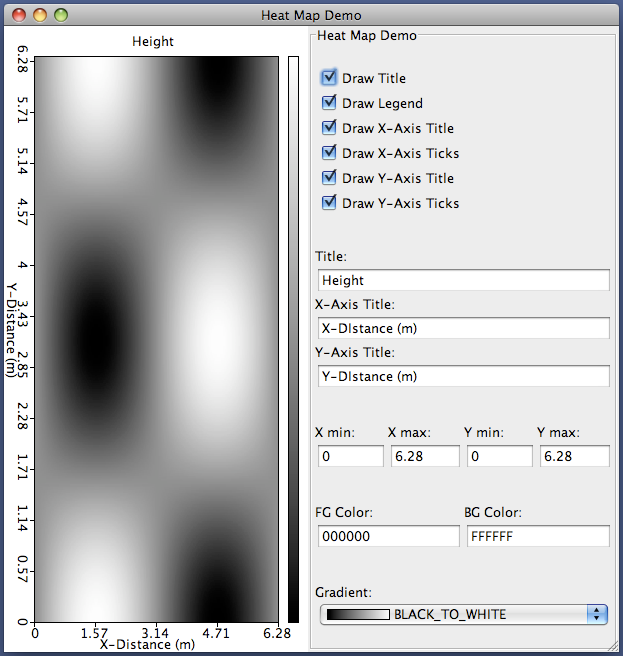
A Heat Map is a common visualization method for viewing the values of a two-dimensional map. There are numerous ways to do three-dimensional graphing and charting, but in my humble opinion, at times it can be difficult to see all the essential details without being able to rotate the 3D chart. I like heat maps for visualizing this kind of data, as the top-down, color-based view doesn't hide any information.
I (along with the help of a few others) have created an easy-to-use Java class that draws heat maps in a JPanel. It should be easy to add into another project of your own. The range of X- and Y-coordinates are only used when drawing the labels on the axis, and do not affect the range of data that is plotted. All data in the array is plotted. You can turn on and off the title, both axis' labels, and the legend. There are a number of color gradients available, and you can always create your own by specifying an array of Color objects.
Data is provided to the HeatMap code in the form of a 2-dimensional array of doubles. The code is configurable to accept data with the y=0 row at either the top or bottom of the display, depending on if you prefer the computer graphics coordinate system, or the standard mathematical coordinate system.
A simple GUI application has been created (HeatMapDemo) that demonstrates the features of the HeatMap, and can be used to play around with most of the different options for the HeatMap. This demo program is included with the source code.
Javadoc of the API is located here: http://www.mbeckler.org/heatMap/javadoc/index.html?HeatMap.html
