Grafana dashboards for measuring MySQL performance with Prometheus and InfluxDB
This is a set of Grafana dashboards to be used with Prometheus and InfluxDB datasources for MySQL and system monitoring.
The dashboards rely on alias label in the Prometheus config and on the small patch applied on Grafana 2.6.
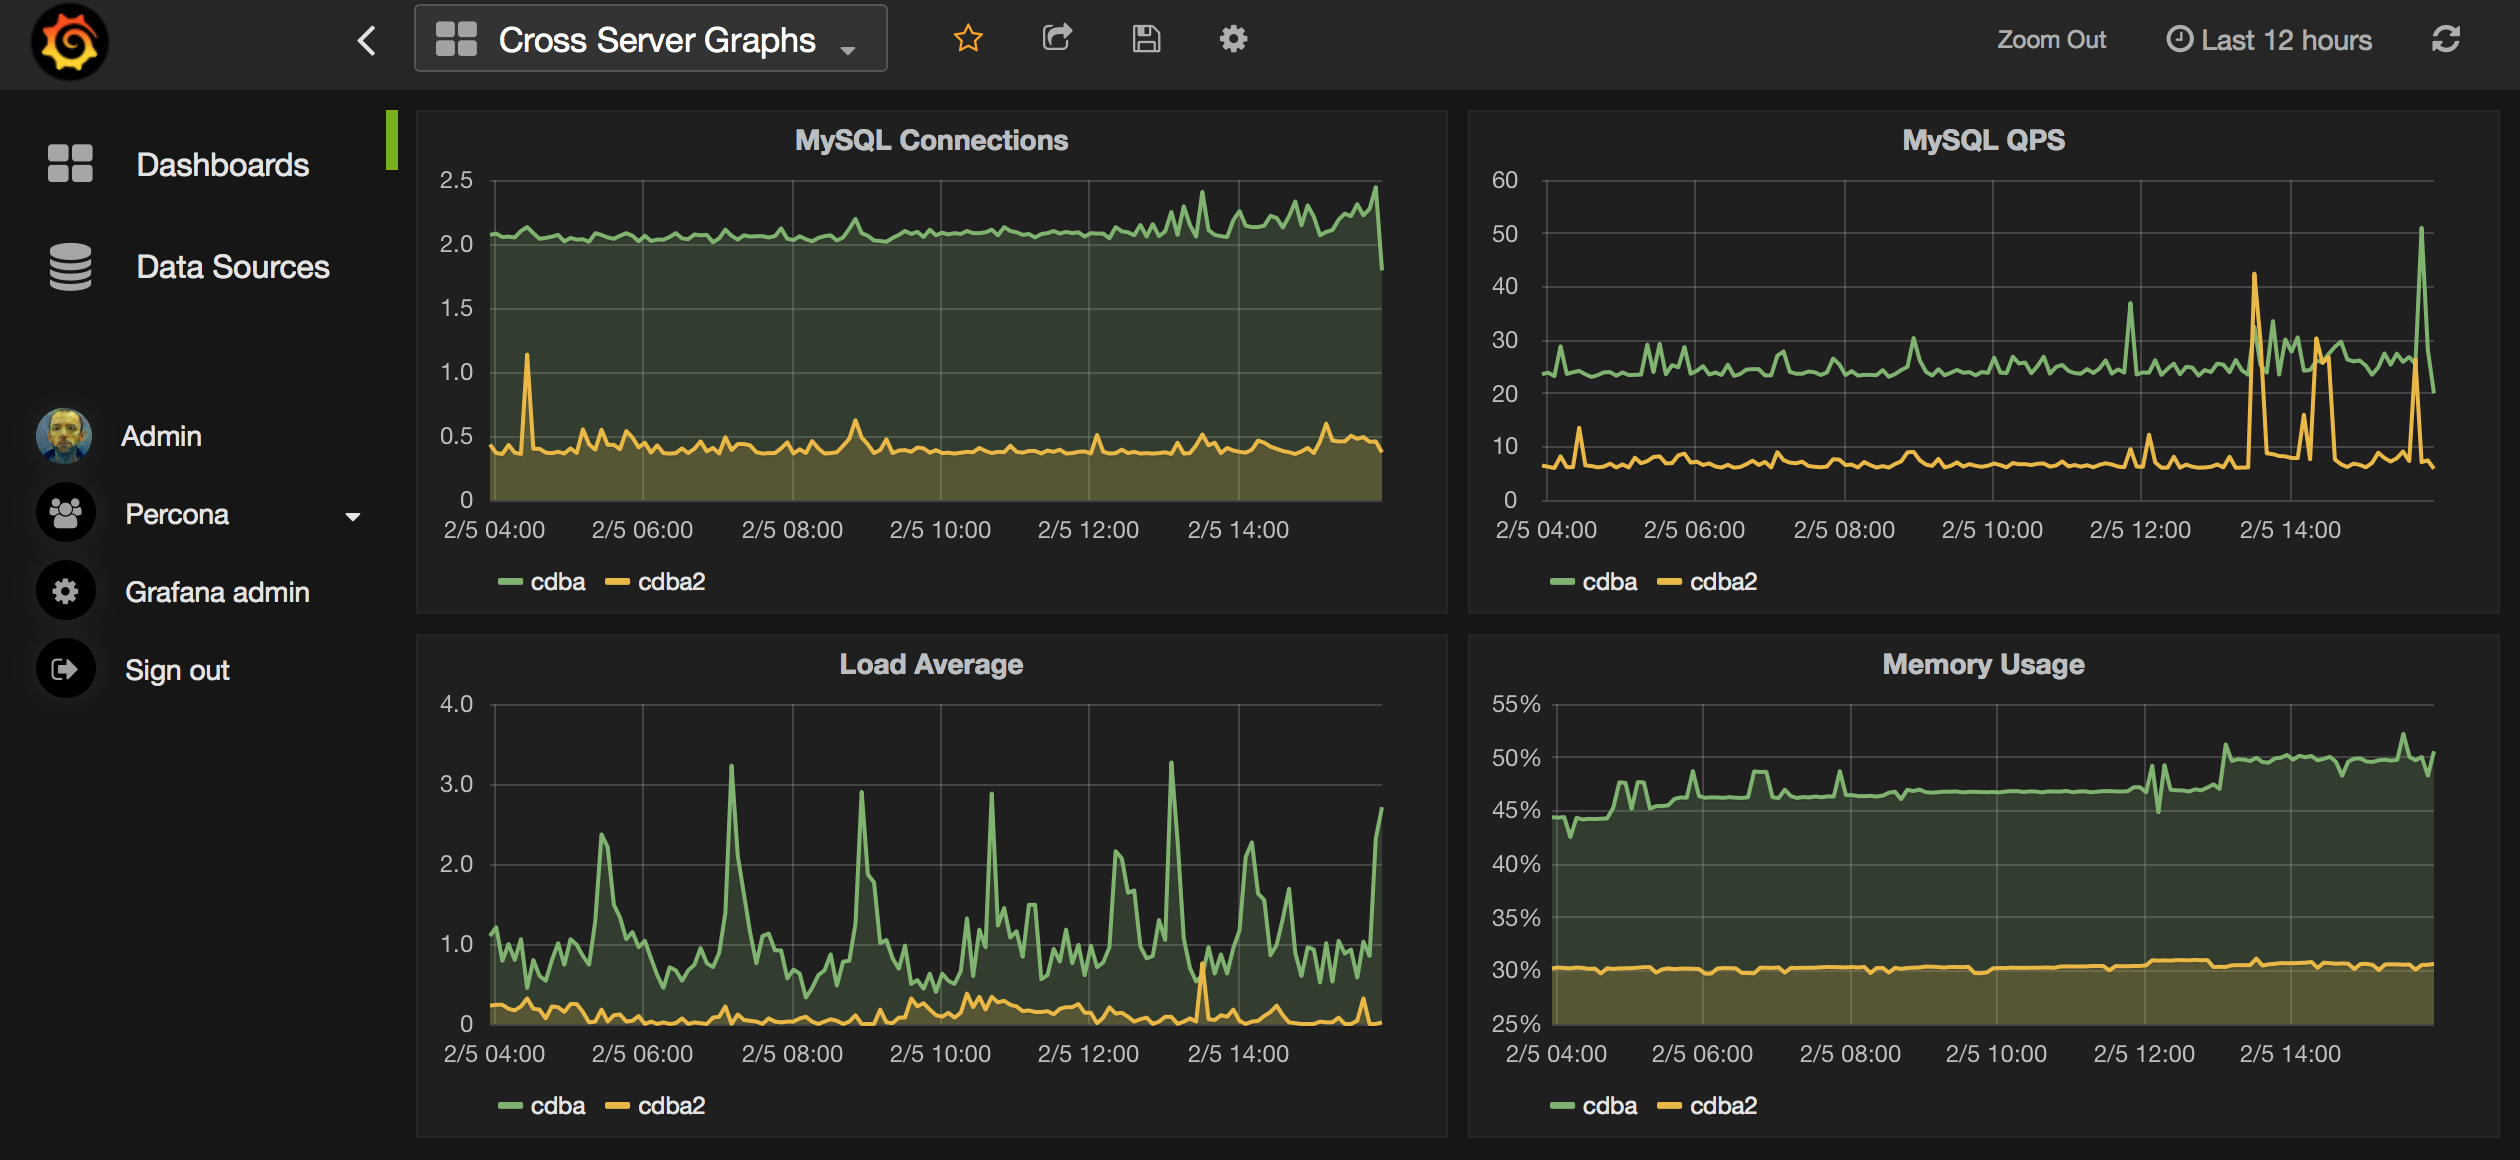
- Cross Server Graphs
- Disk Performance
- Galera Graphs
- MySQL InnoDB Metrics
- MySQL MyISAM Metrics
- MySQL Overview
- MySQL Performance Schema
- MySQL Query Response Time
- MySQL Replication
- MySQL Table Statistics
- MySQL User Statistics
- Prometheus
- Summary Dashboard
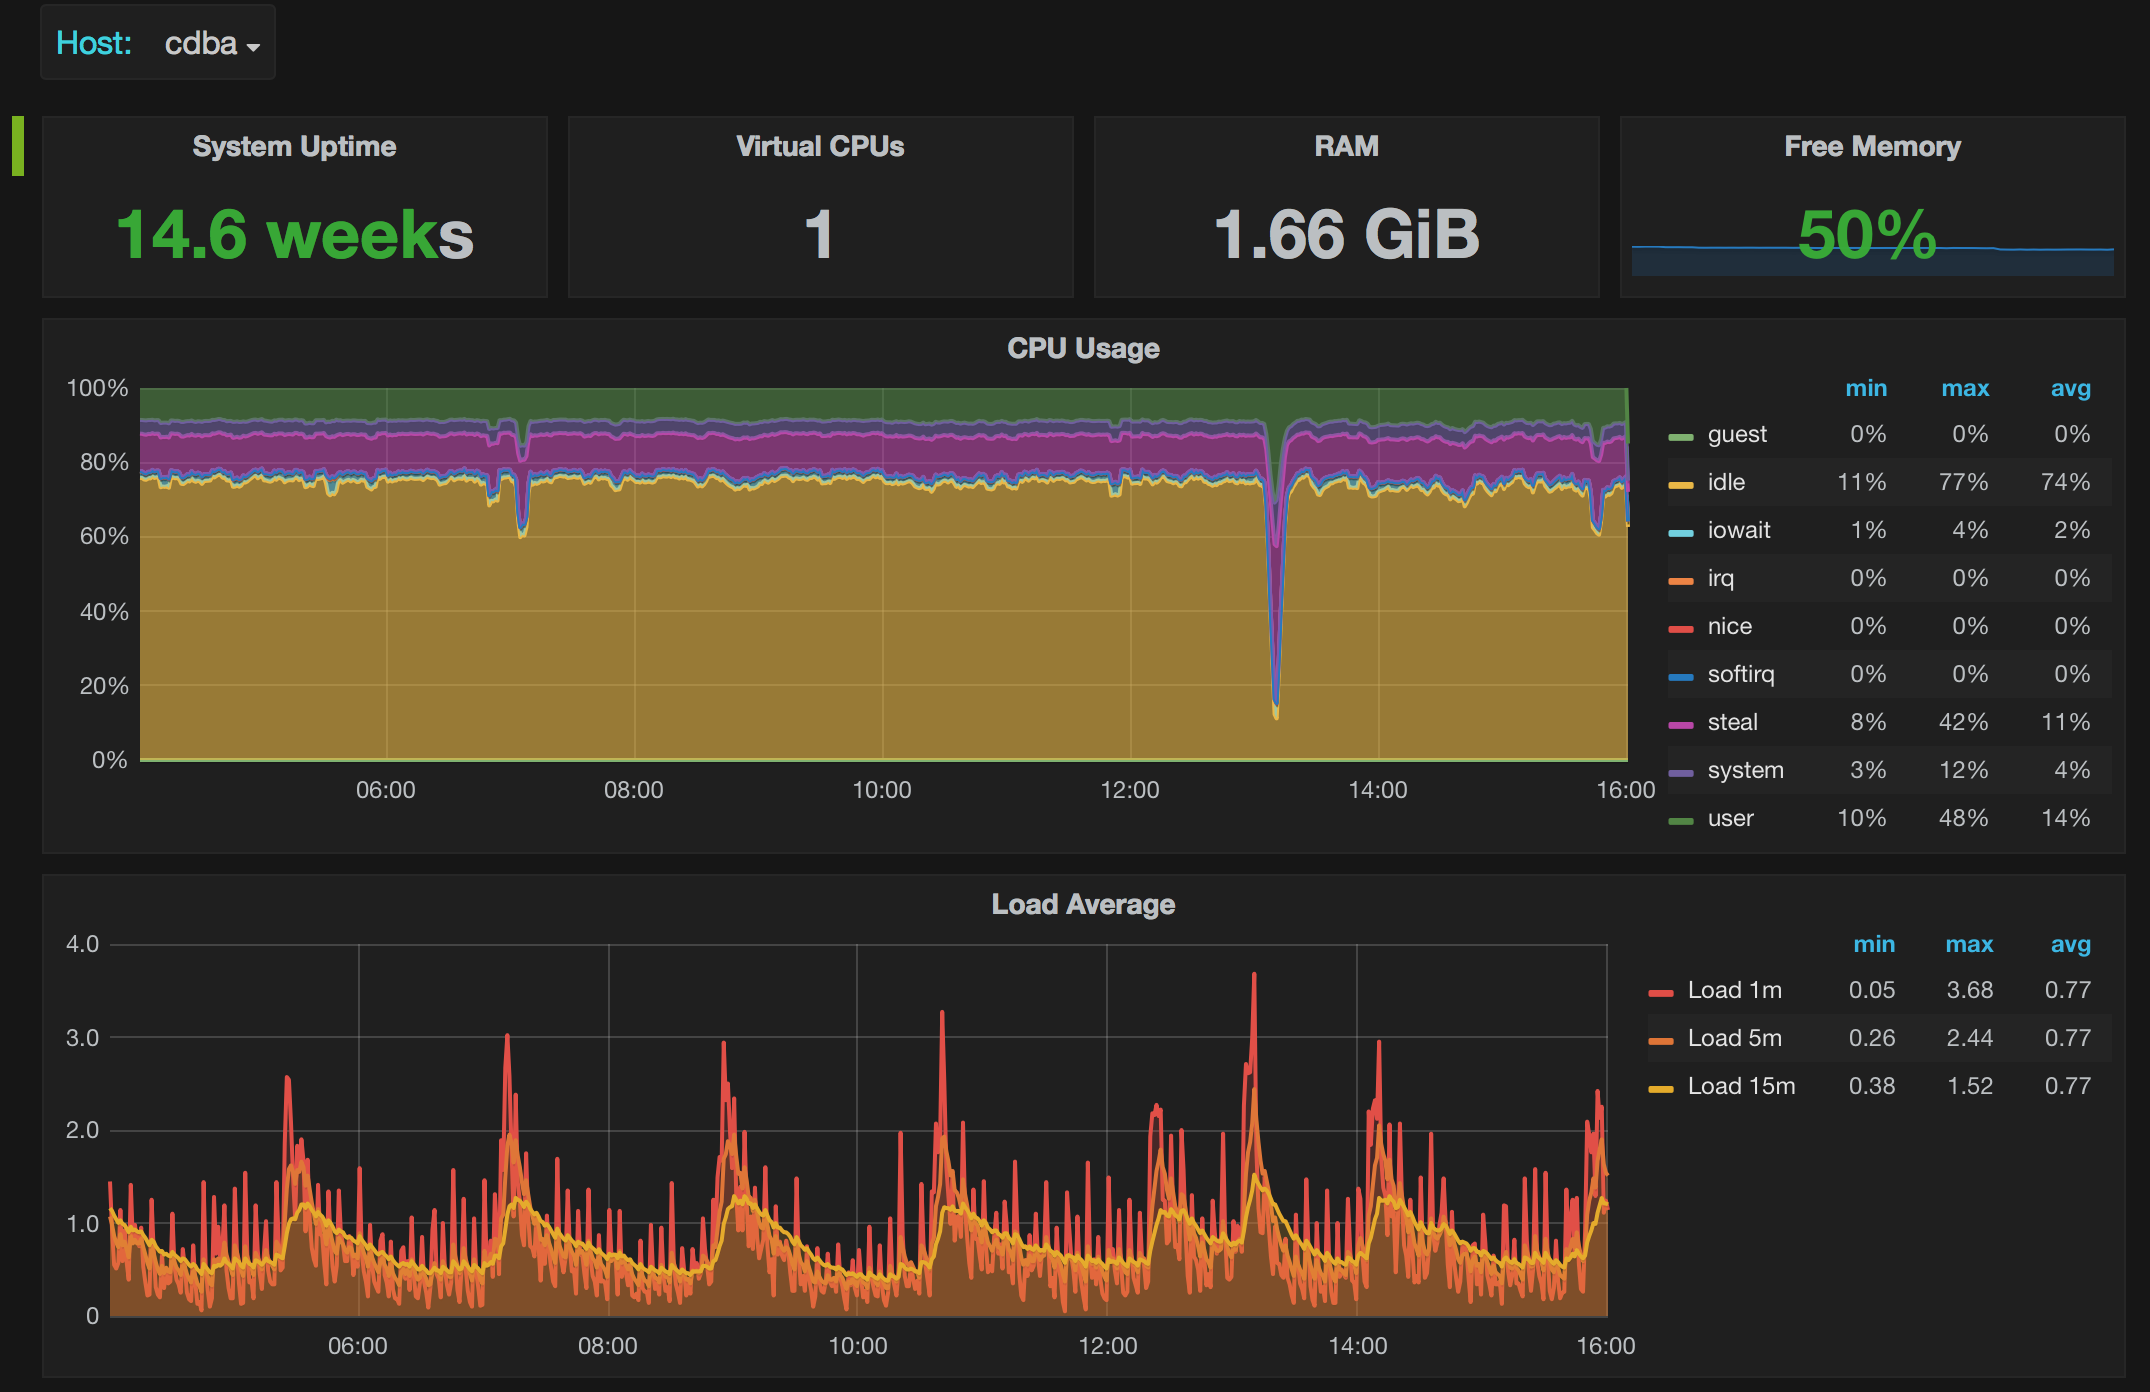
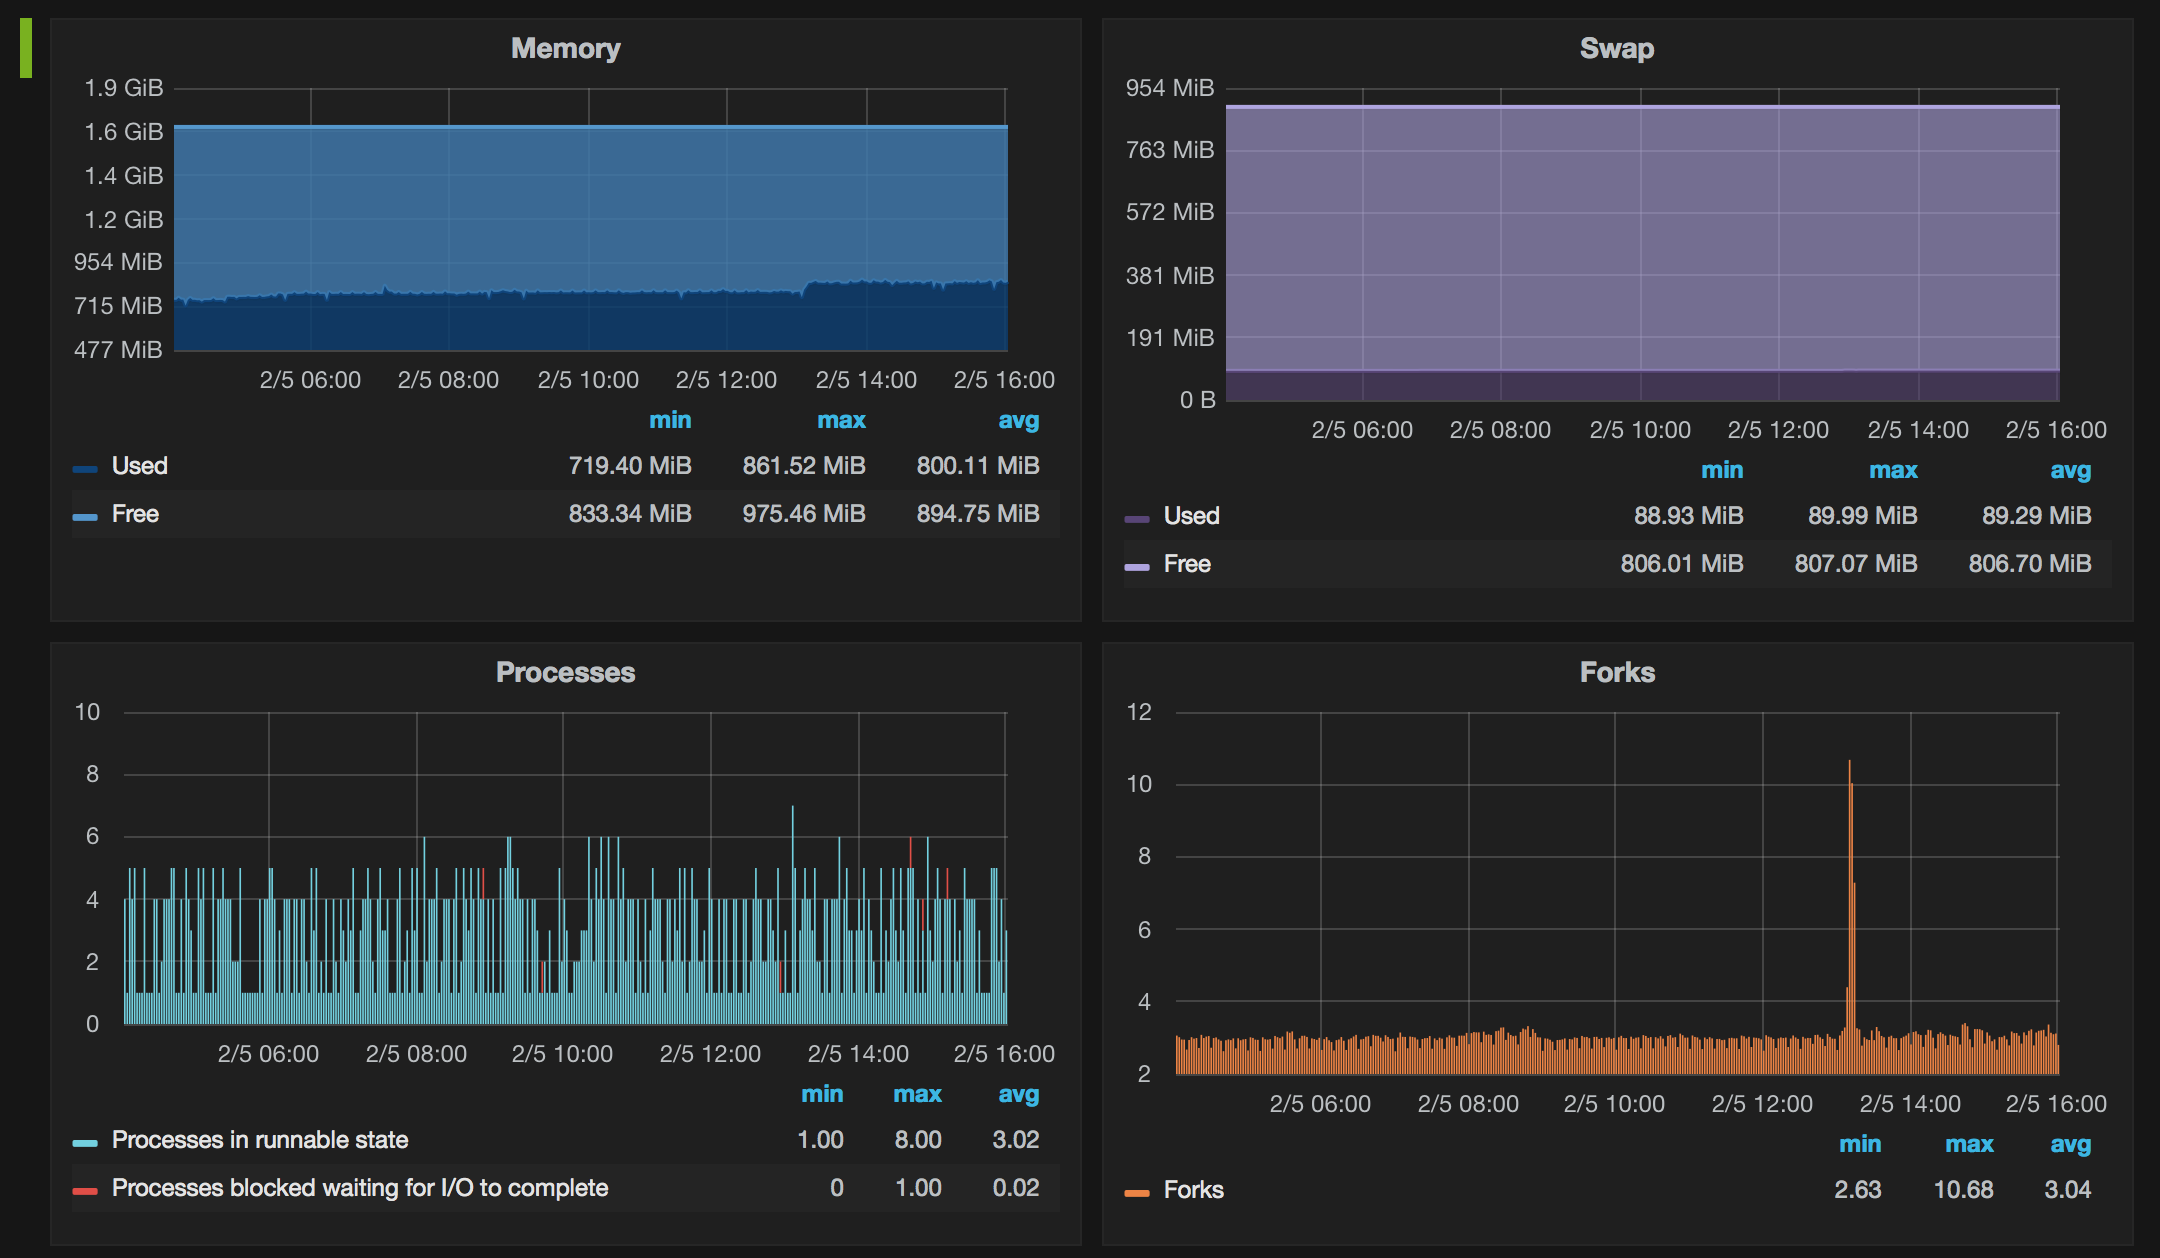
- System Overview
- TokuDB Graphs
- Trends Dashboard
- [InfluxDB] 1h downsample
- [InfluxDB] 5m downsample
For trending dashboards to work you need to create the continuous queries in InfluxDB, see the instructions.
Setup instructions
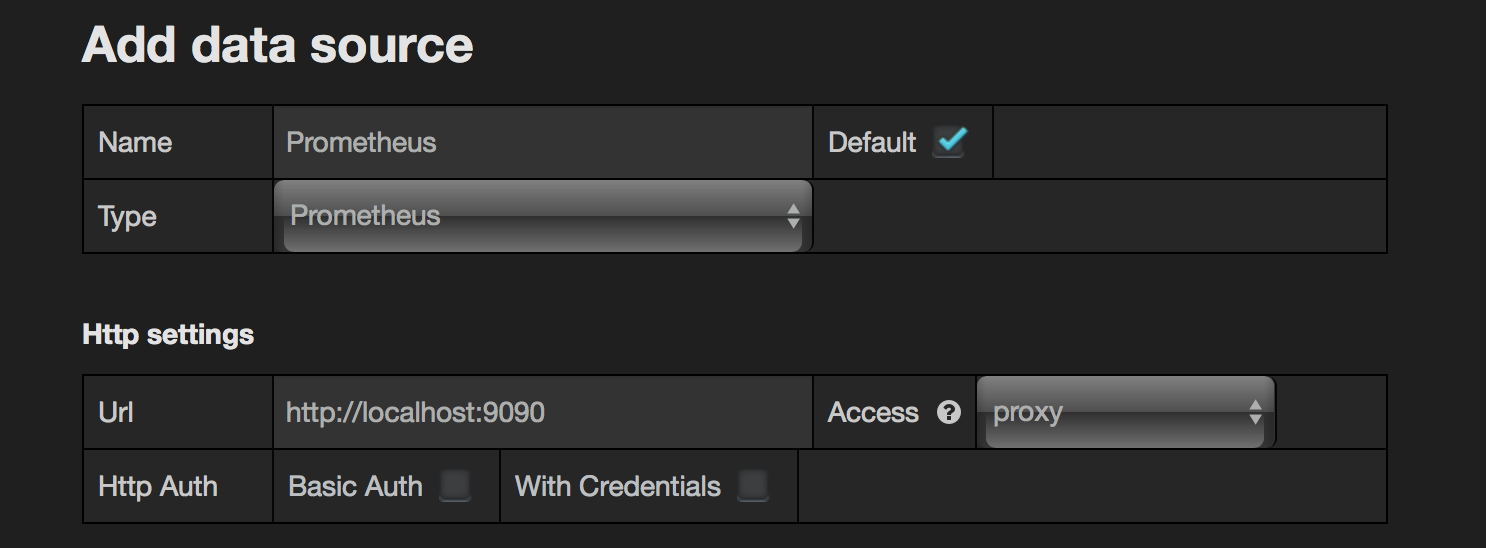
Add datasource in Grafana
Edit Prometheus config
The dashboards use alias label to work with individual hosts.
Ensure you have alias defined for each of your targets.
For example, if you want to monitor 192.168.1.7 the excerpt of the config will be look like this:
scrape_configs:
  - job_name: prometheus
    target_groups:
      - targets: ['localhost:9090']

  - job_name: linux
    target_groups:
      - targets: ['192.168.1.7:9100']
        labels:
          alias: db1

  - job_name: mysql
    target_groups:
      - targets: ['192.168.1.7:9104']
        labels:
          alias: db1
Note, adding a new label to the existing Prometheus instance will introduce a mess with the time-series.
So it is recommended to start using alias from scratch.
How you name jobs is not important. However, "Prometheus" dashboard assumes the job name is prometheus.
Also it is assumed that the exporters are run with this minimal set of options:
- node_exporter:
-collectors.enabled="diskstats,filesystem,loadavg,meminfo,netdev,stat,time,uname,vmstat" - mysqld_exporter:
-collect.binlog_size=true -collect.info_schema.processlist=true
Edit Grafana config
Enable JSON dashboards by uncommenting those lines in grafana.ini:
[dashboards.json]
enabled = true
path = /var/lib/grafana/dashboards
If you wish you may import the individual dashboards via UI and ignore this and the next steps.
Apply Grafana patch
It is important to apply the following minor patch on your Grafana in order to use the interval template variable to get the good zoomable graphs. The fix is simply to allow variable in Step field on Grafana graph editor page. For more information, take a look at PR#3757 and PR#4257. We hope the last one will be released with the next Grafana version.
sed -i 's/step_input:""/step_input:c.target.step/; s/ HH:MM/ HH:mm/; s/,function(c)/,"templateSrv",function(c,g)/; s/expr:c.target.expr/expr:g.replace(c.target.expr,c.panel.scopedVars)/' /usr/share/grafana/public/app/plugins/datasource/prometheus/query_ctrl.js
sed -i 's/h=a.interval/h=g.replace(a.interval, c.scopedVars)/' /usr/share/grafana/public/app/plugins/datasource/prometheus/datasource.js
Those changes are idemportent and do not break anything.
Install dashboards
git clone https://github.com/percona/grafana-dashboards.git
cp -r grafana-dashboards/dashboards /var/lib/grafana/
Restart Grafana
service grafana-server restart
Update instructions
Simply copy the new dashboards to /var/lib/grafana/dashboards and restart Grafana.
Graph samples
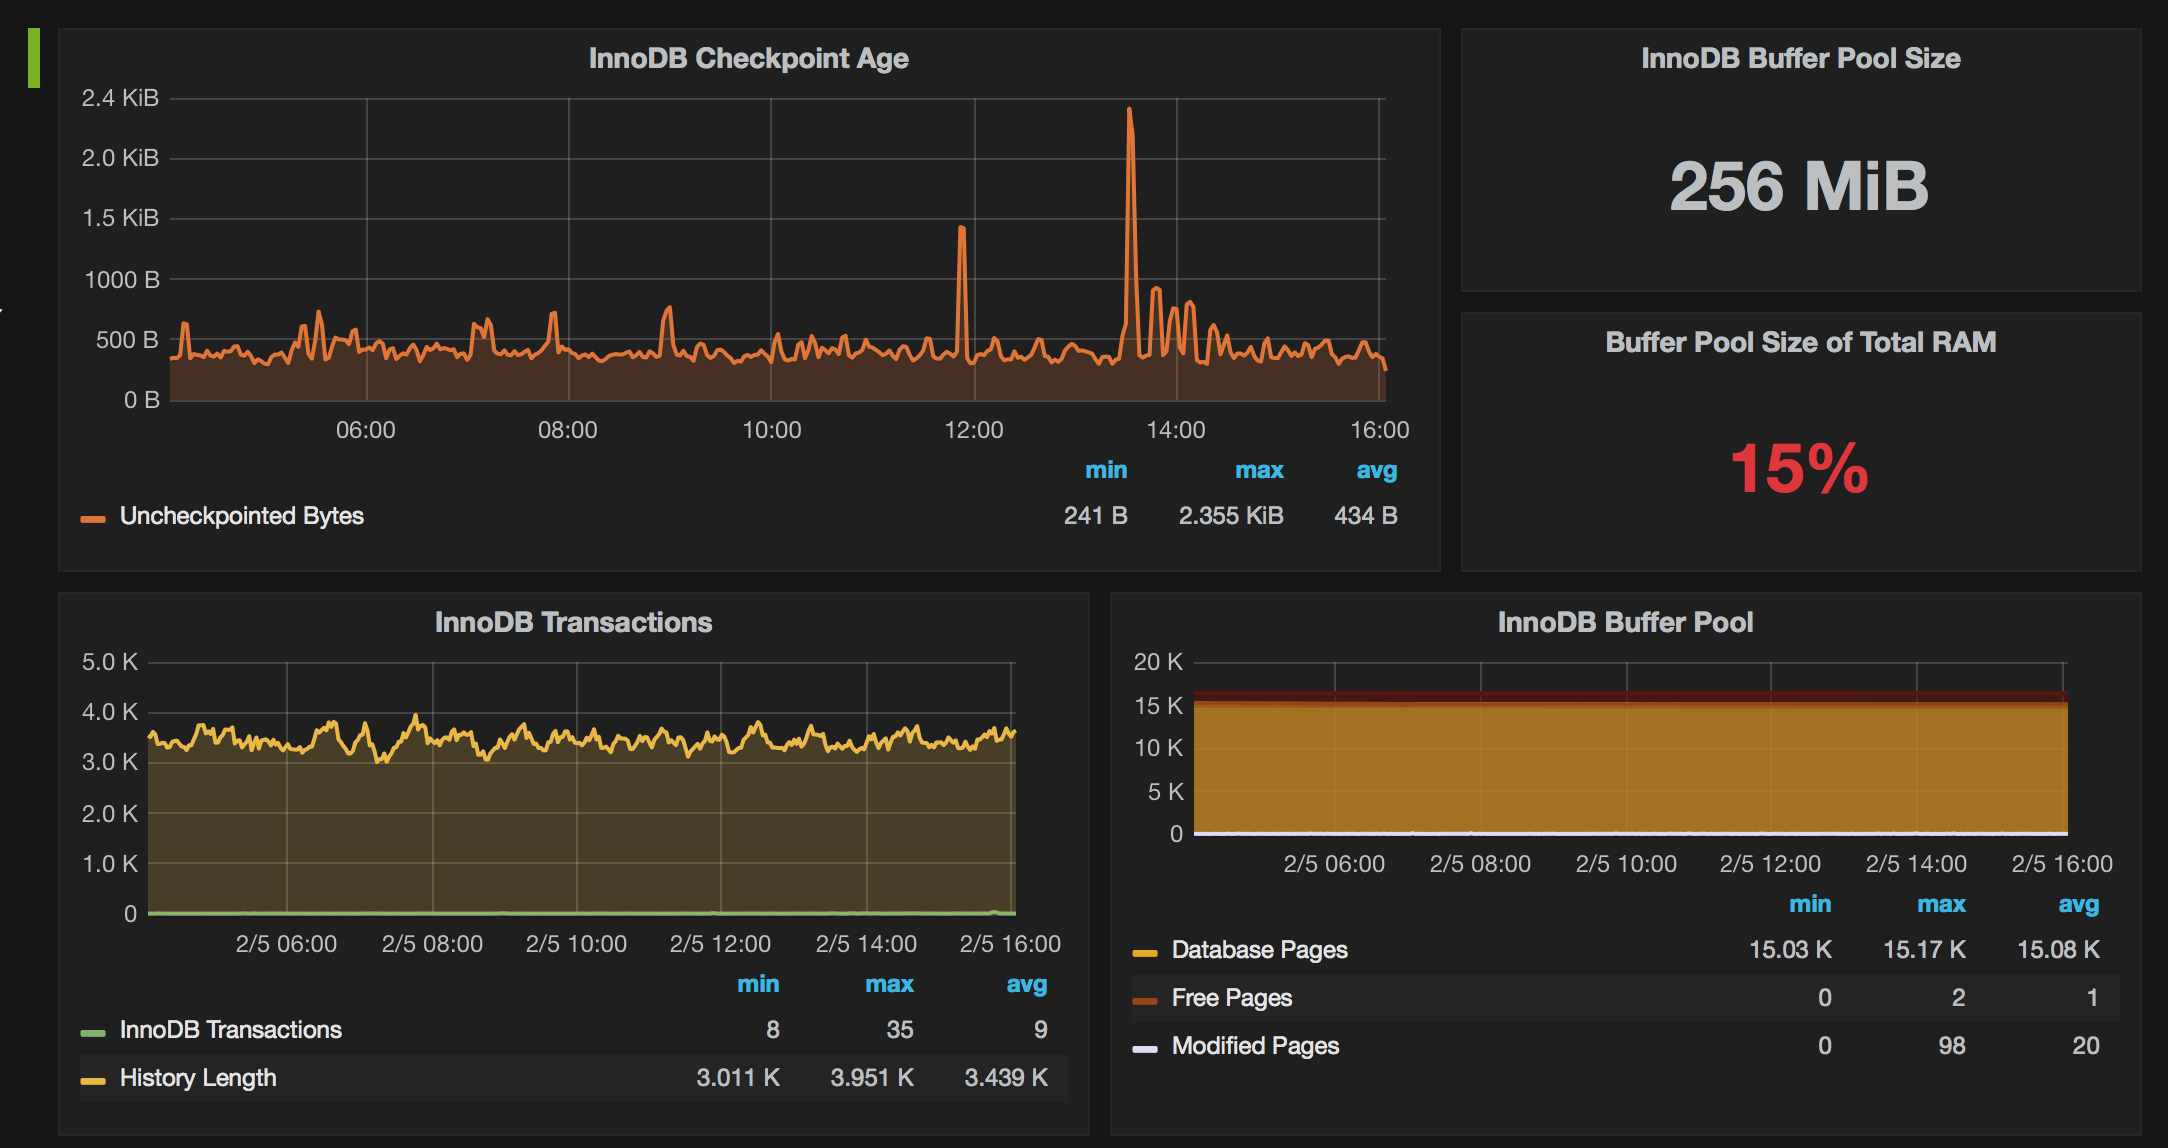
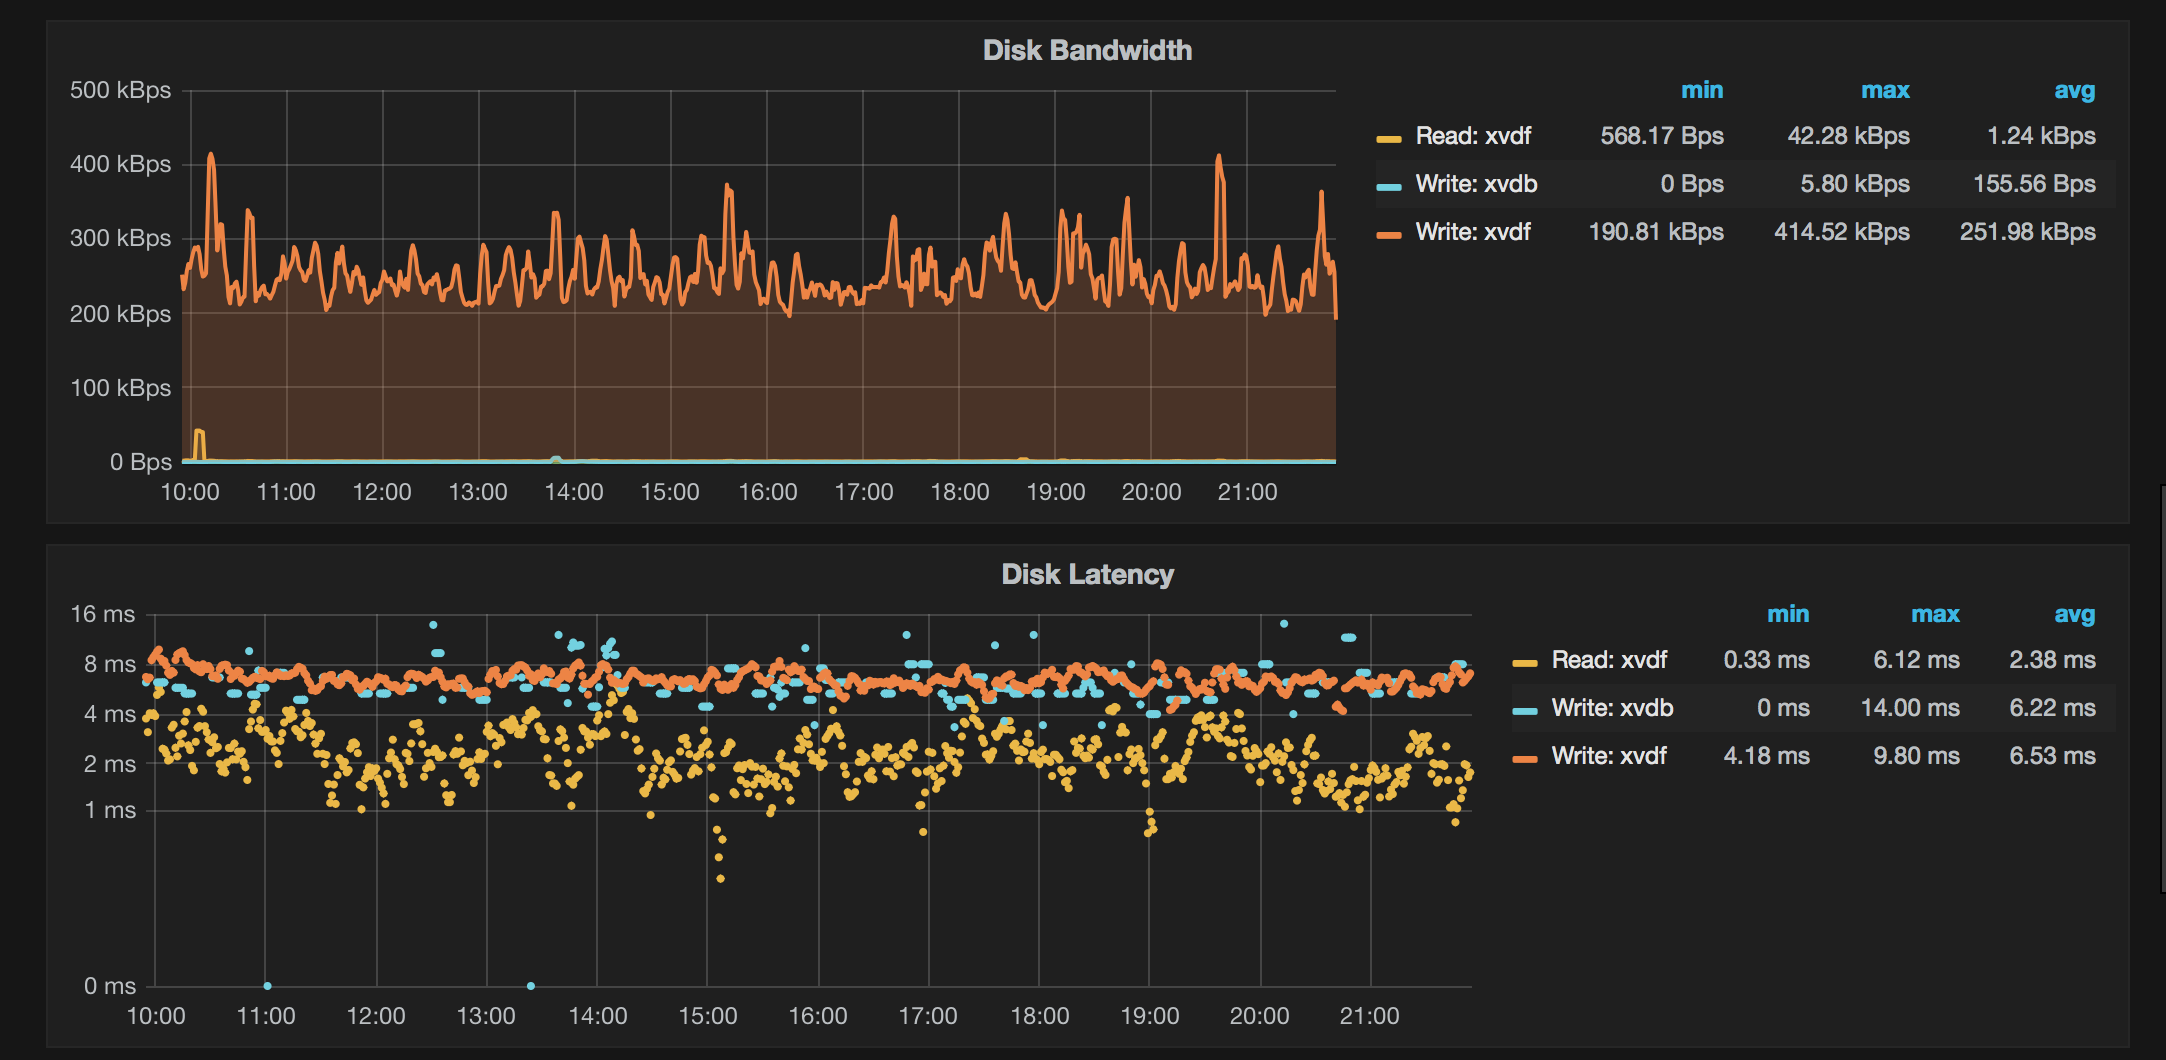
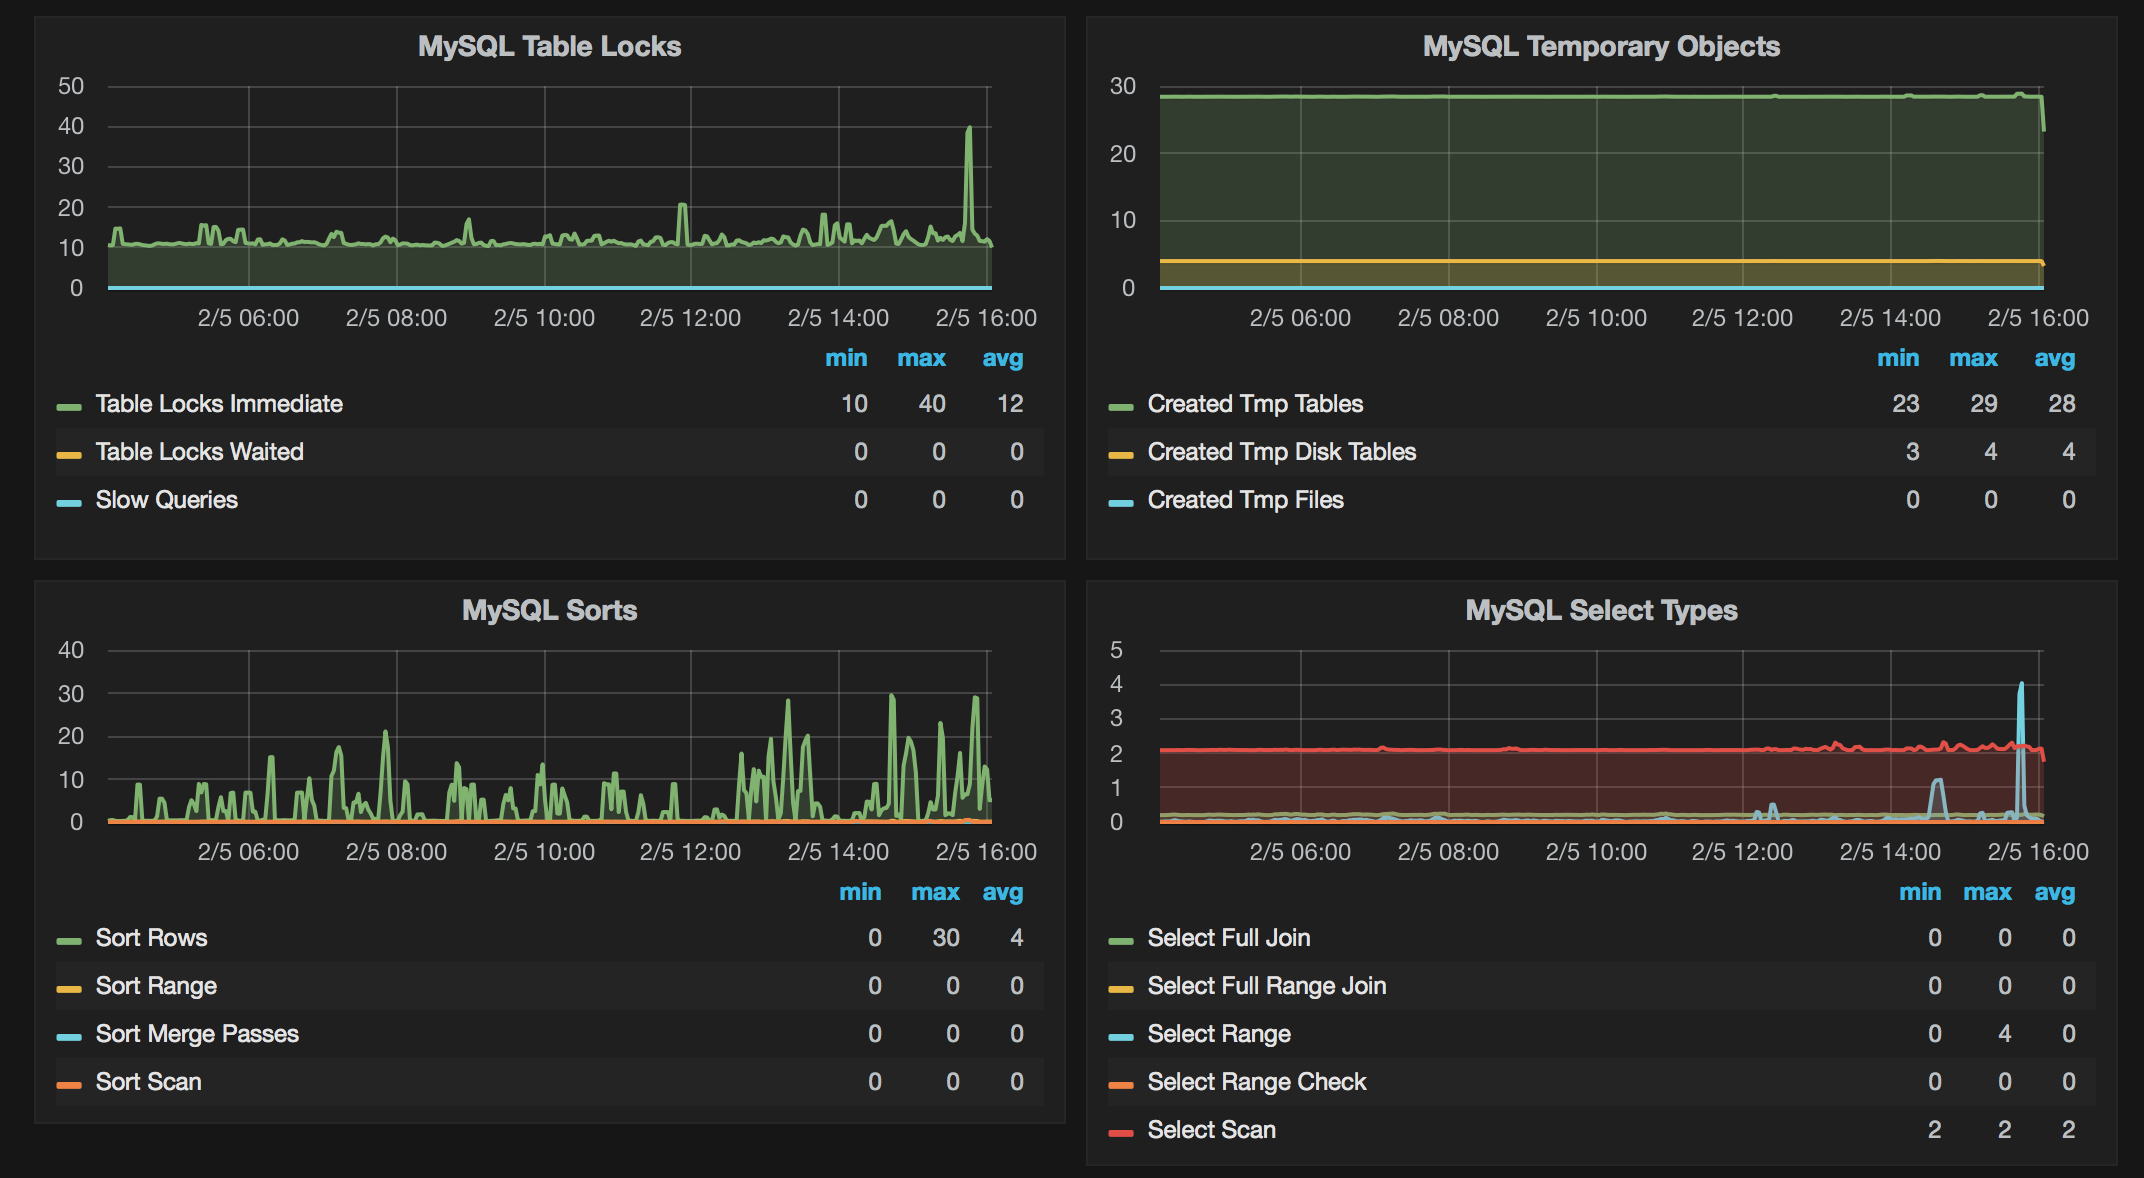
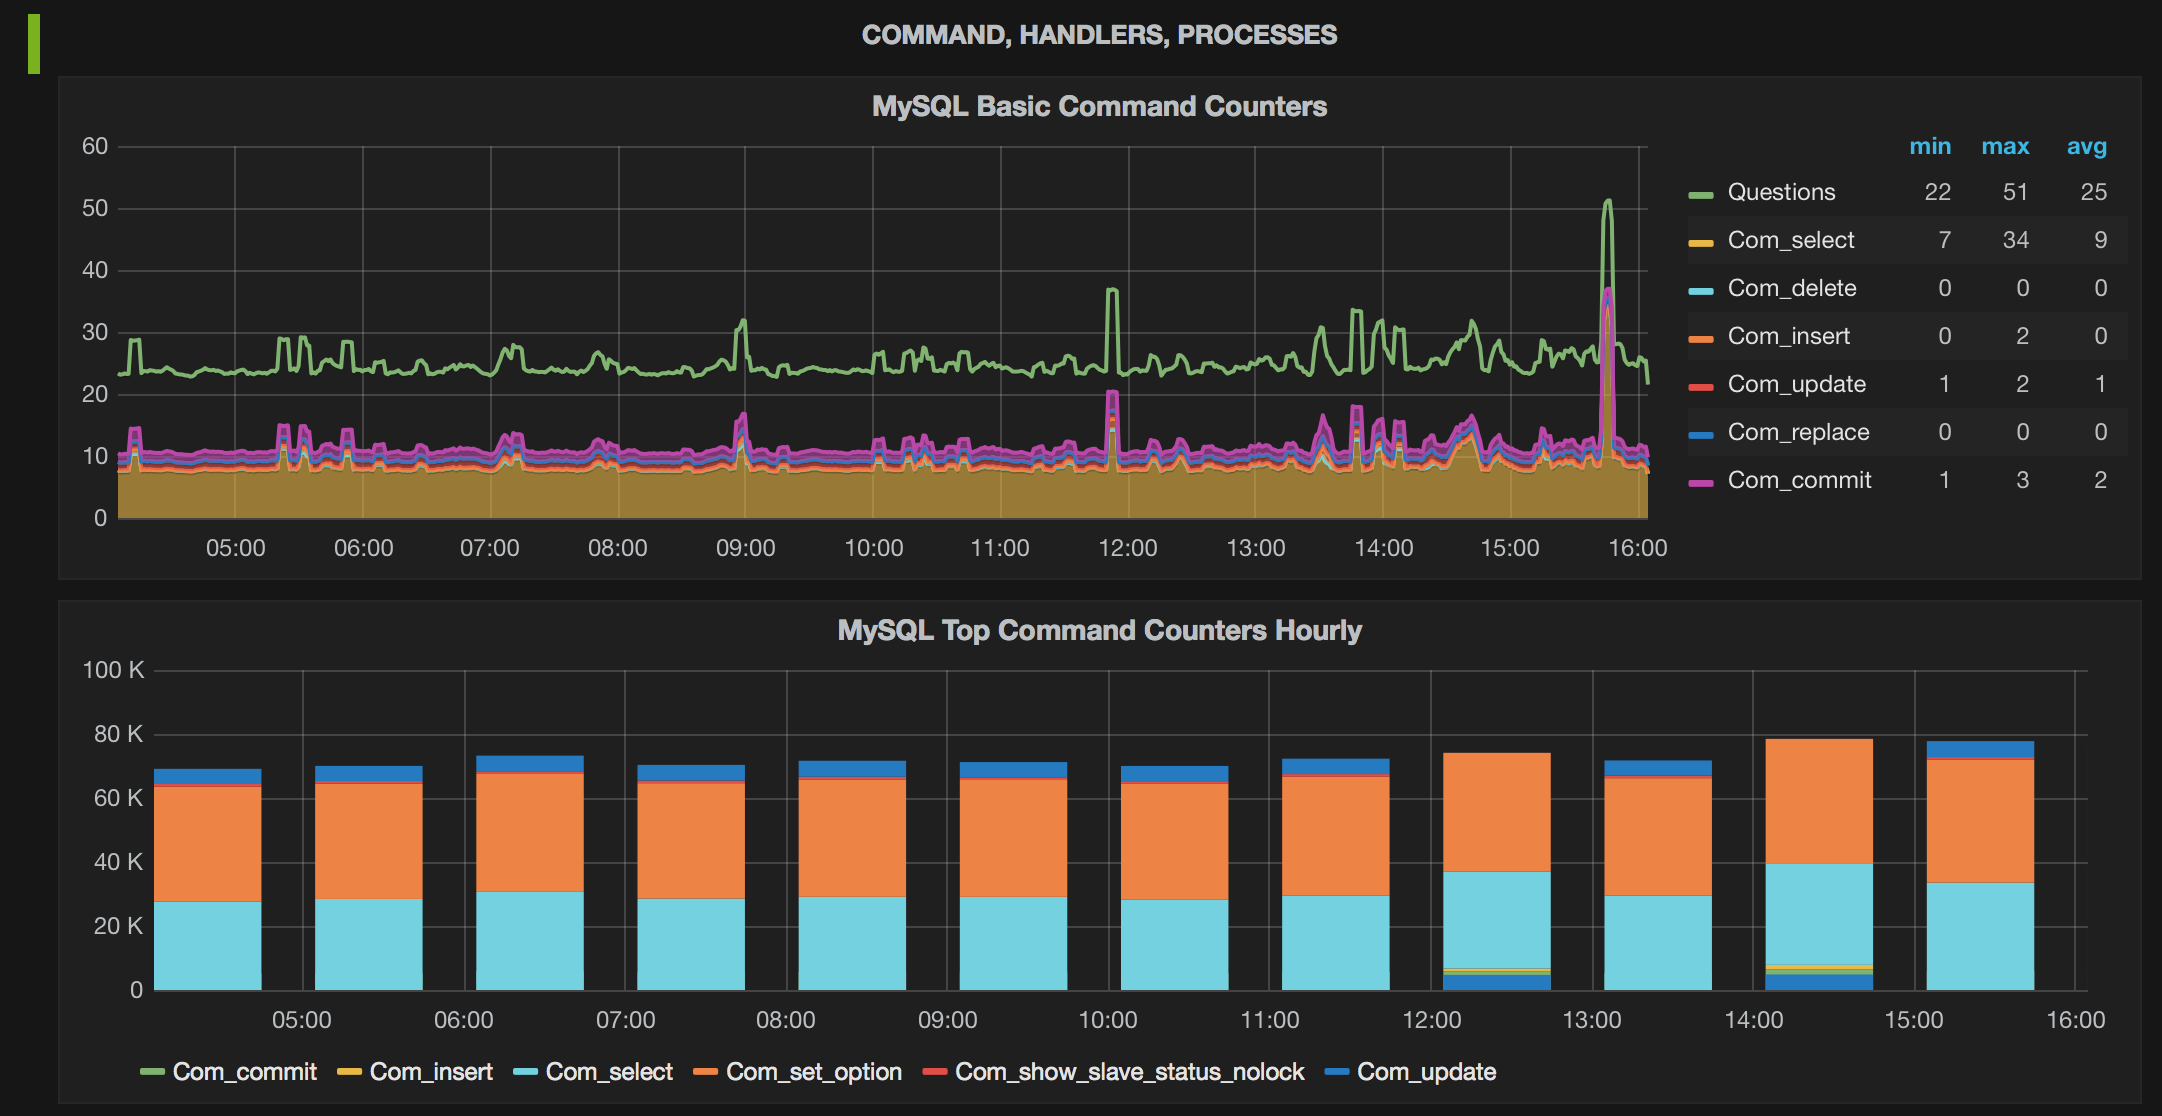
Here is some sample graphs.
