 A starting point for the installation, maintenance, operation, and monitoring of your highly-available Docker swarm-based containerized applications. Features a modern DevOps toolset (Prometheus / Alertmanager / Grafana) for monitoring and alerting. Optional: Docker swarm node management including automatic installation of Docker swarm nodes or onboarding of existing swarms, stable highly-available persistent storage for your containers, firewall management, HTTPS by default, LDAP and web-proxied network support, dynamic swarm service discovery and monitoring using swarm service labels, and other HA features that your applications can take advantage of. Installation requires only cut and paste of a few commands and editing some documented files.
- swarmstack introduction video
- FEATURES
- WHY?
- REQUIREMENTS
- INSTALLATION
- MONITORING ALERTING AND LOGGING
- SCALING
- NETWORK URLs
- SCREENSHOTS
- Caddy Link Dashboard
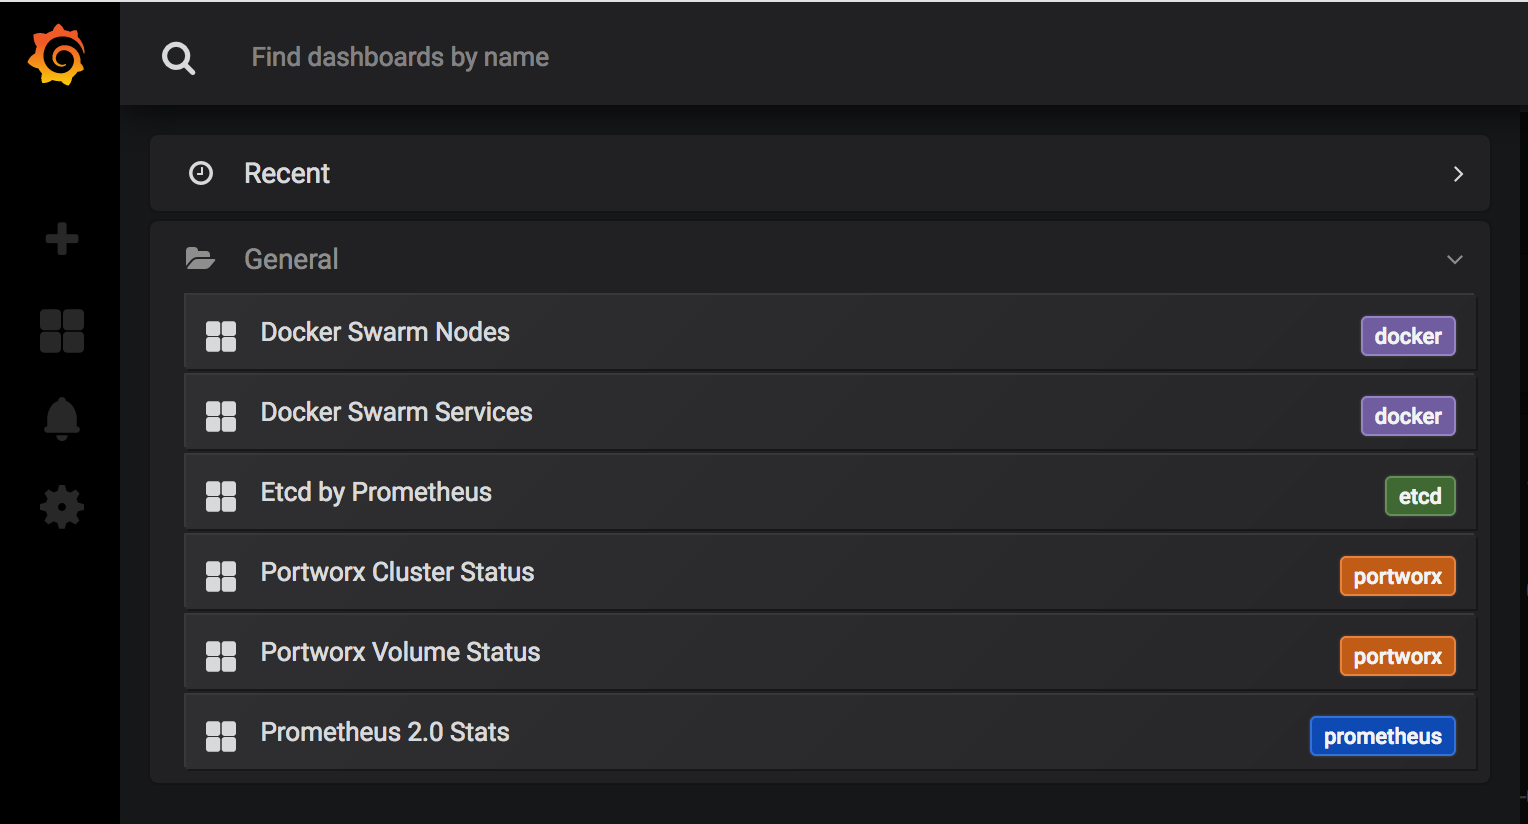
- Grafana Dashboards List
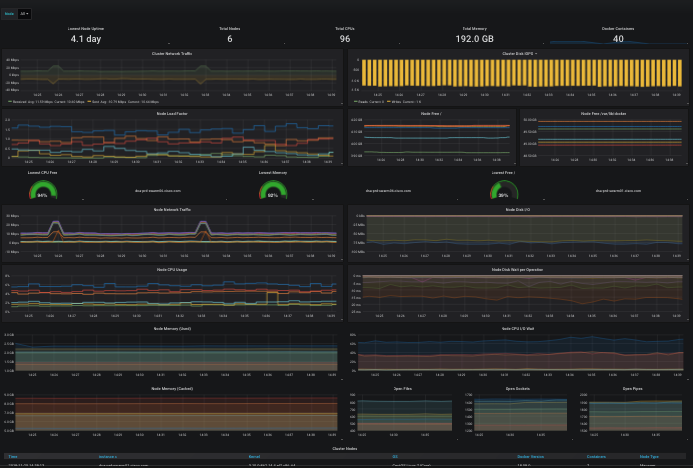
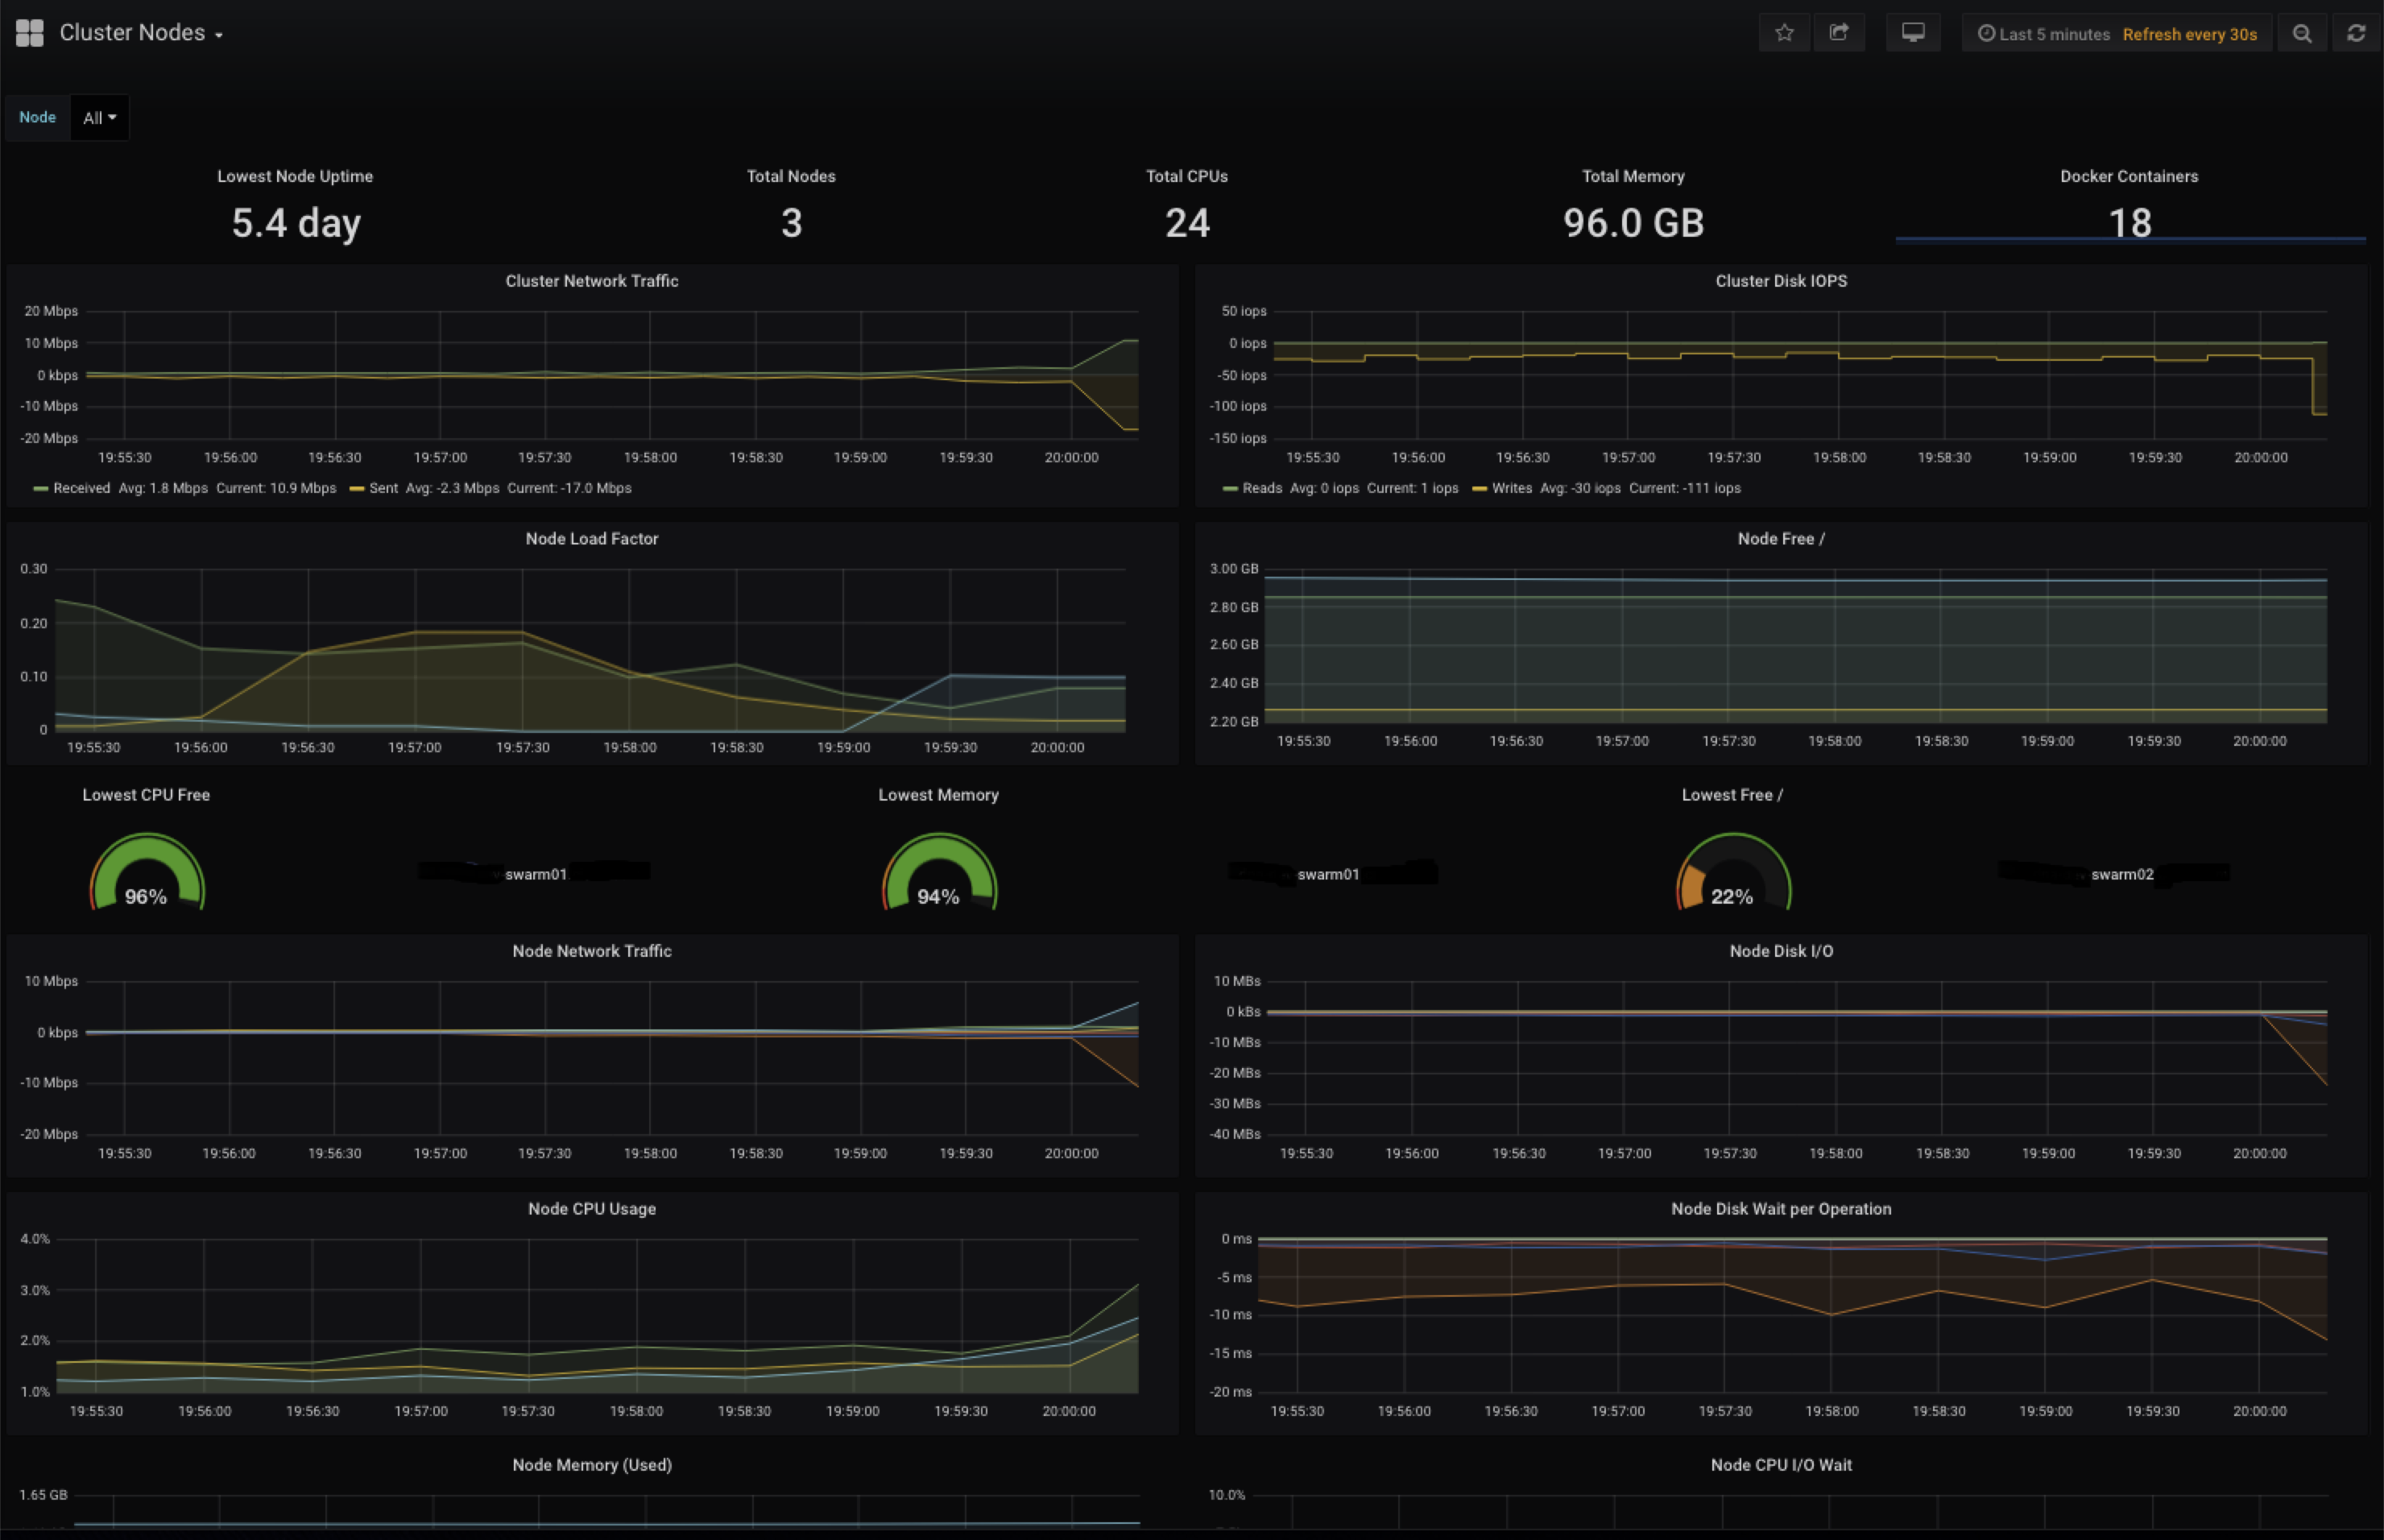
- Grafana - Docker Swarm Nodes
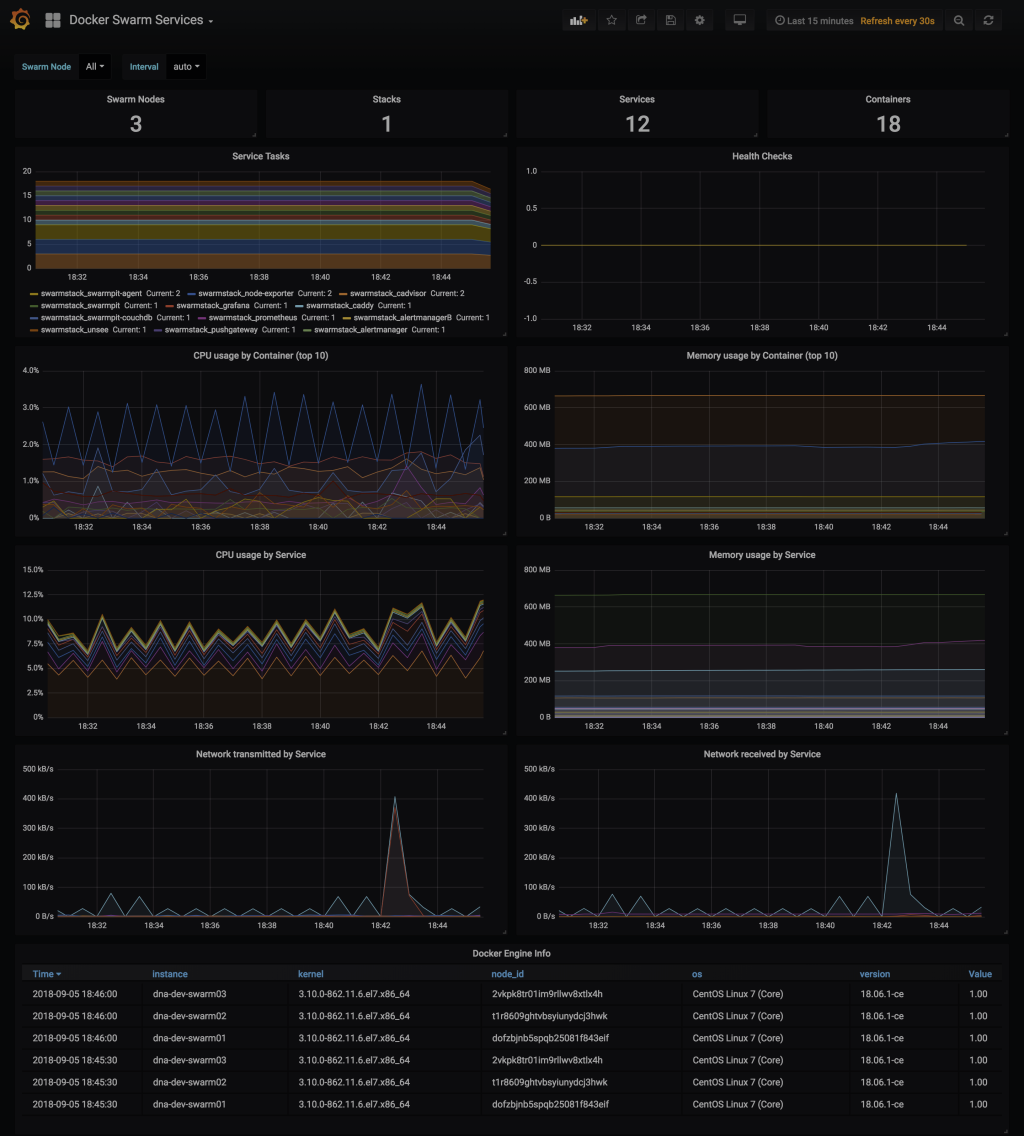
- Grafana - Docker Swarm Services
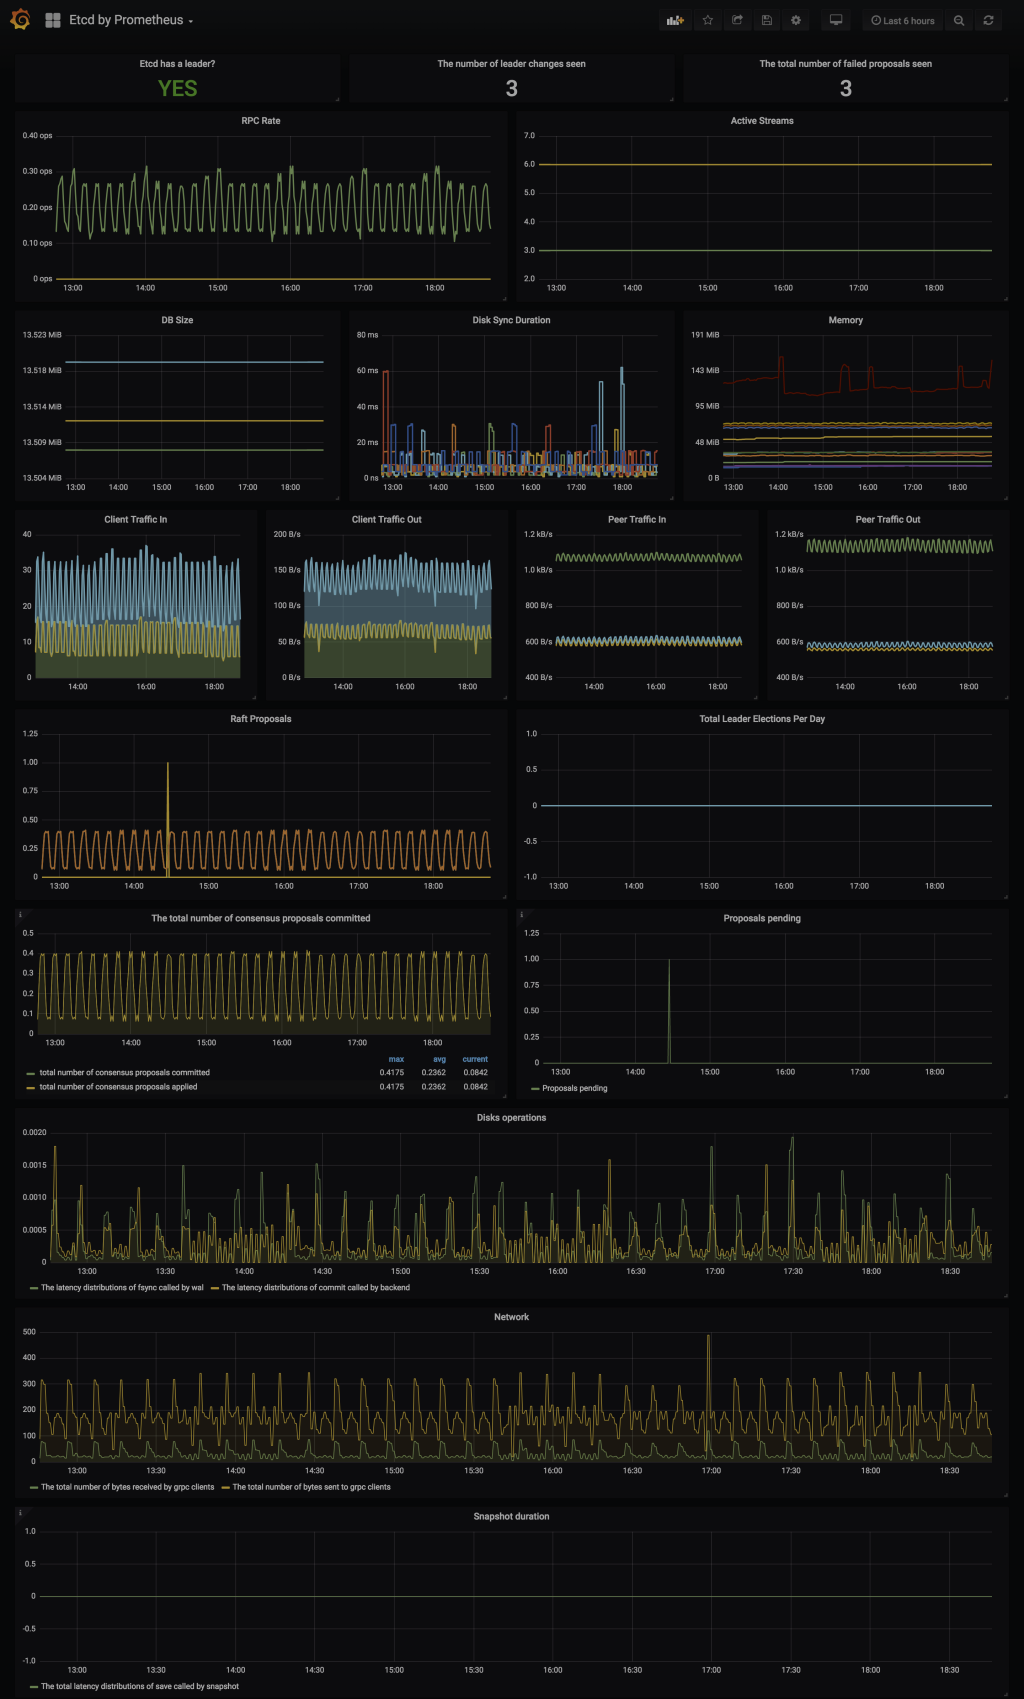
- Grafana - etcd
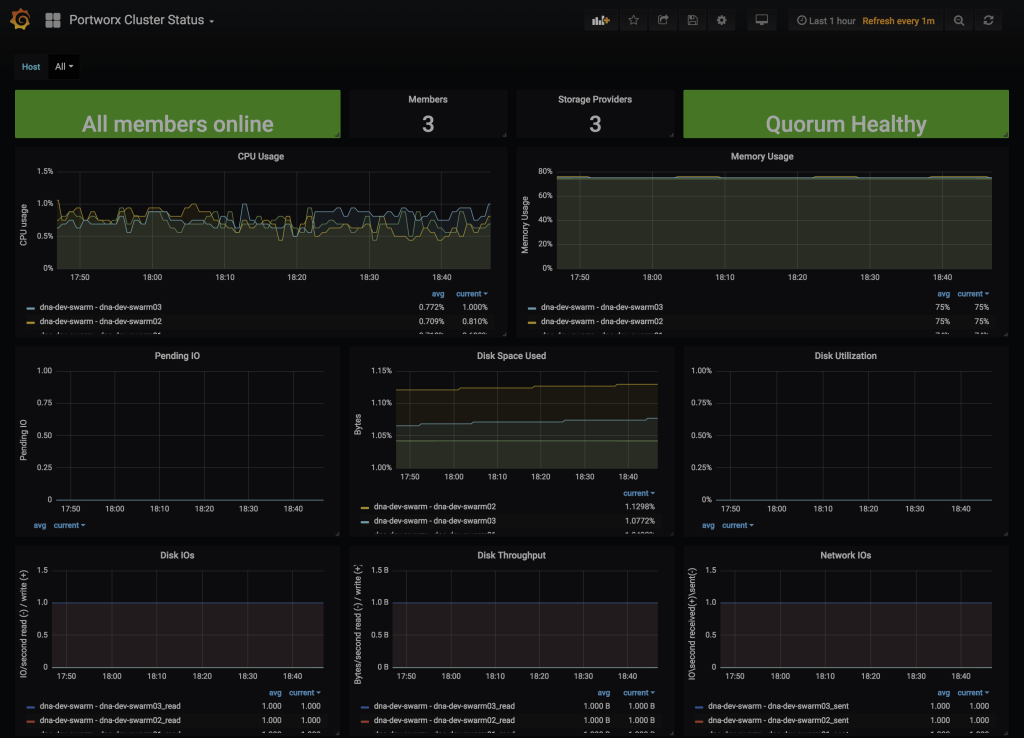
- Grafana - Portworx Cluster Status
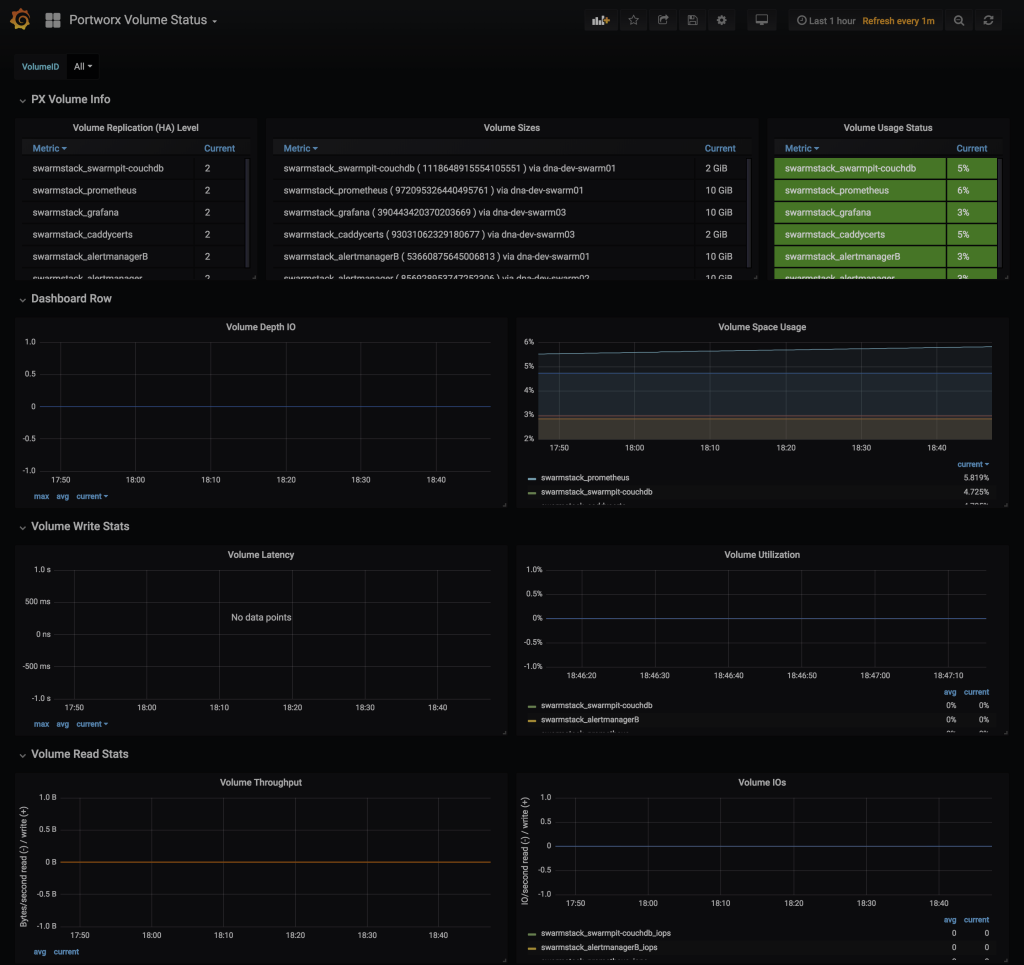
- Grafana - Portworx Volume Status
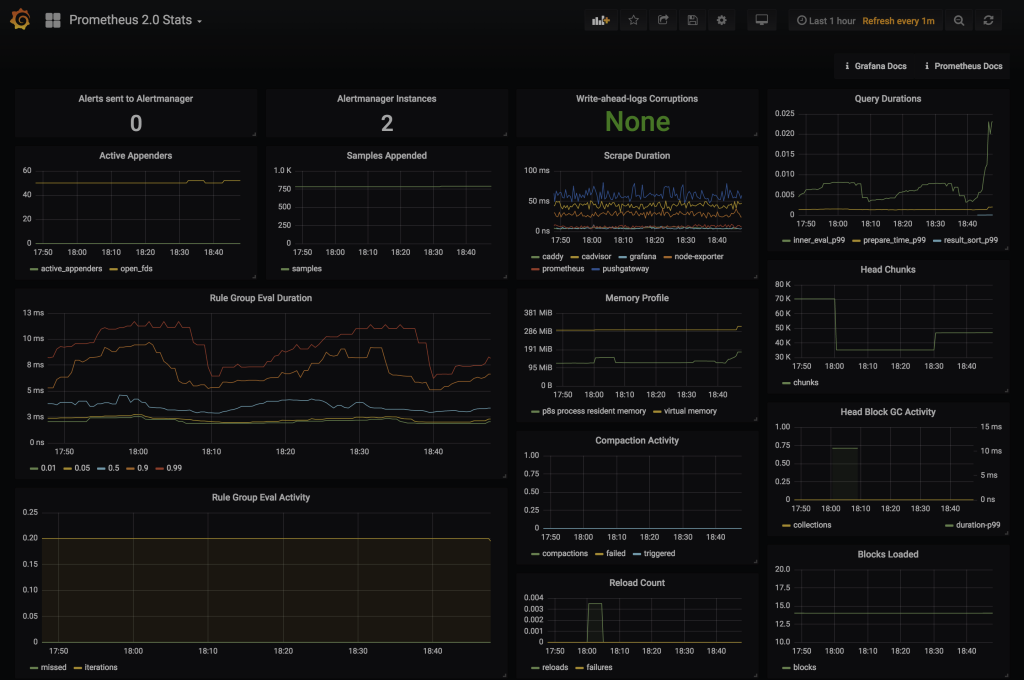
- Grafana - Prometheus Stats
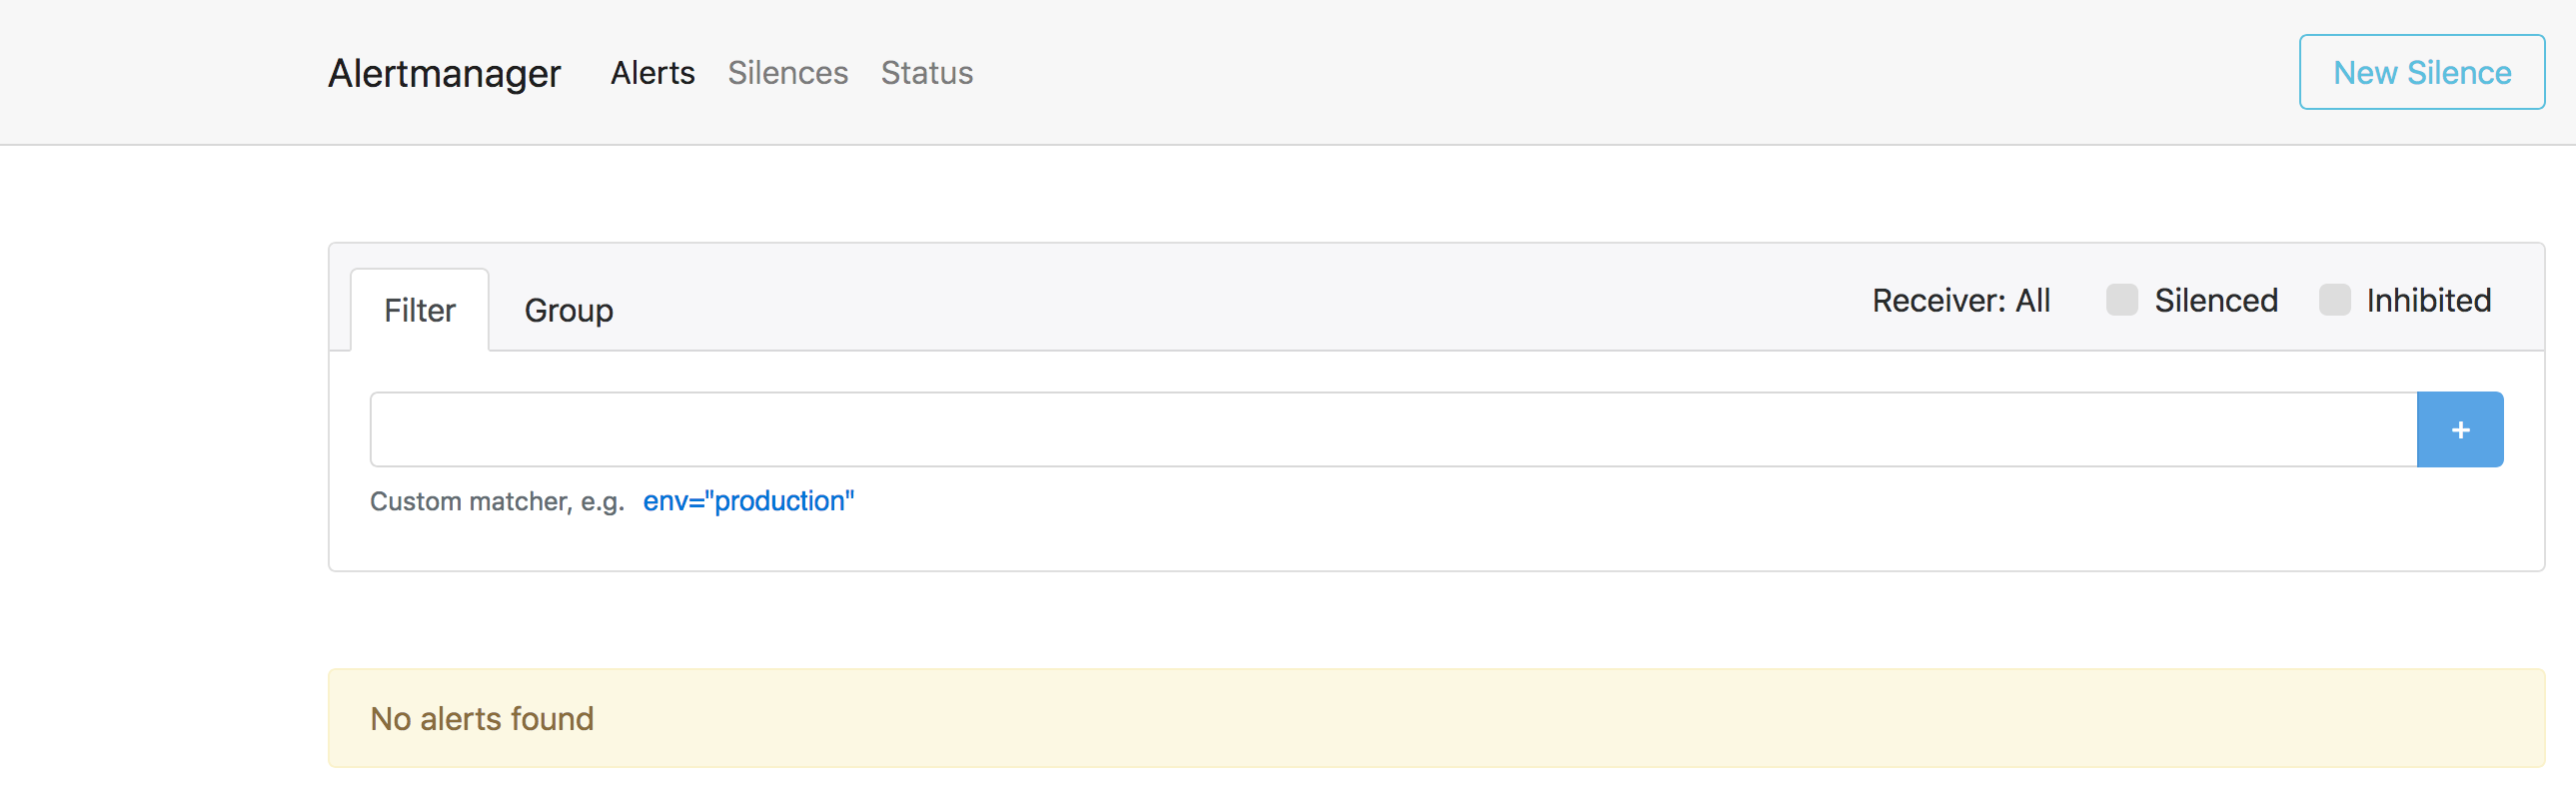
- Alertmanager
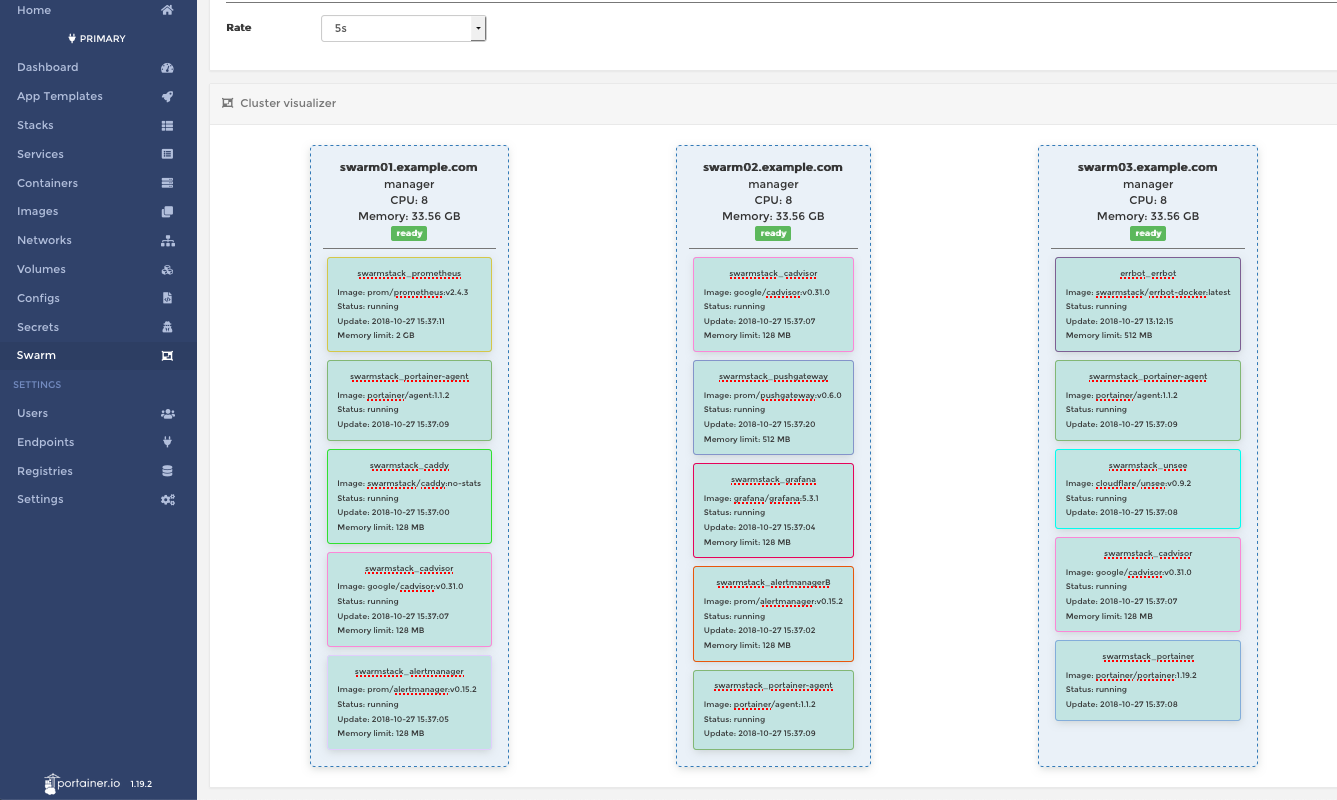
- Portainer - Cluster Visualizer
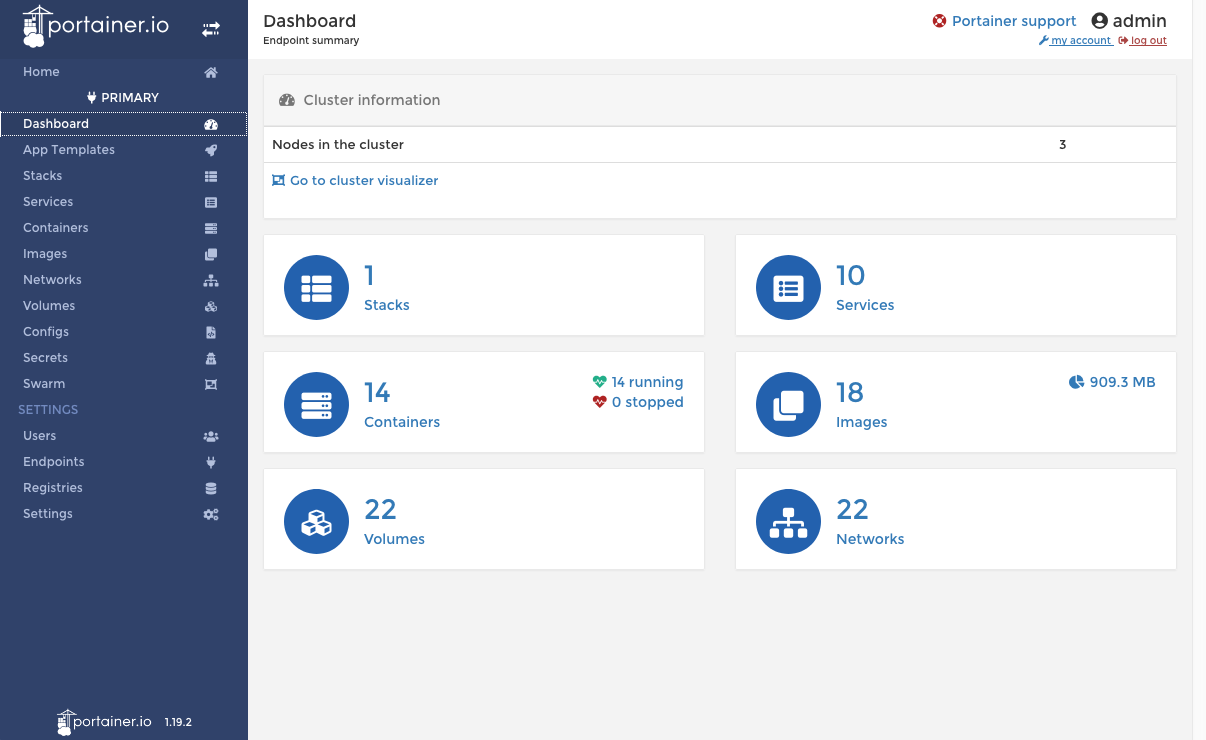
- Portainer - Dashboard
- Portainer - Stacks
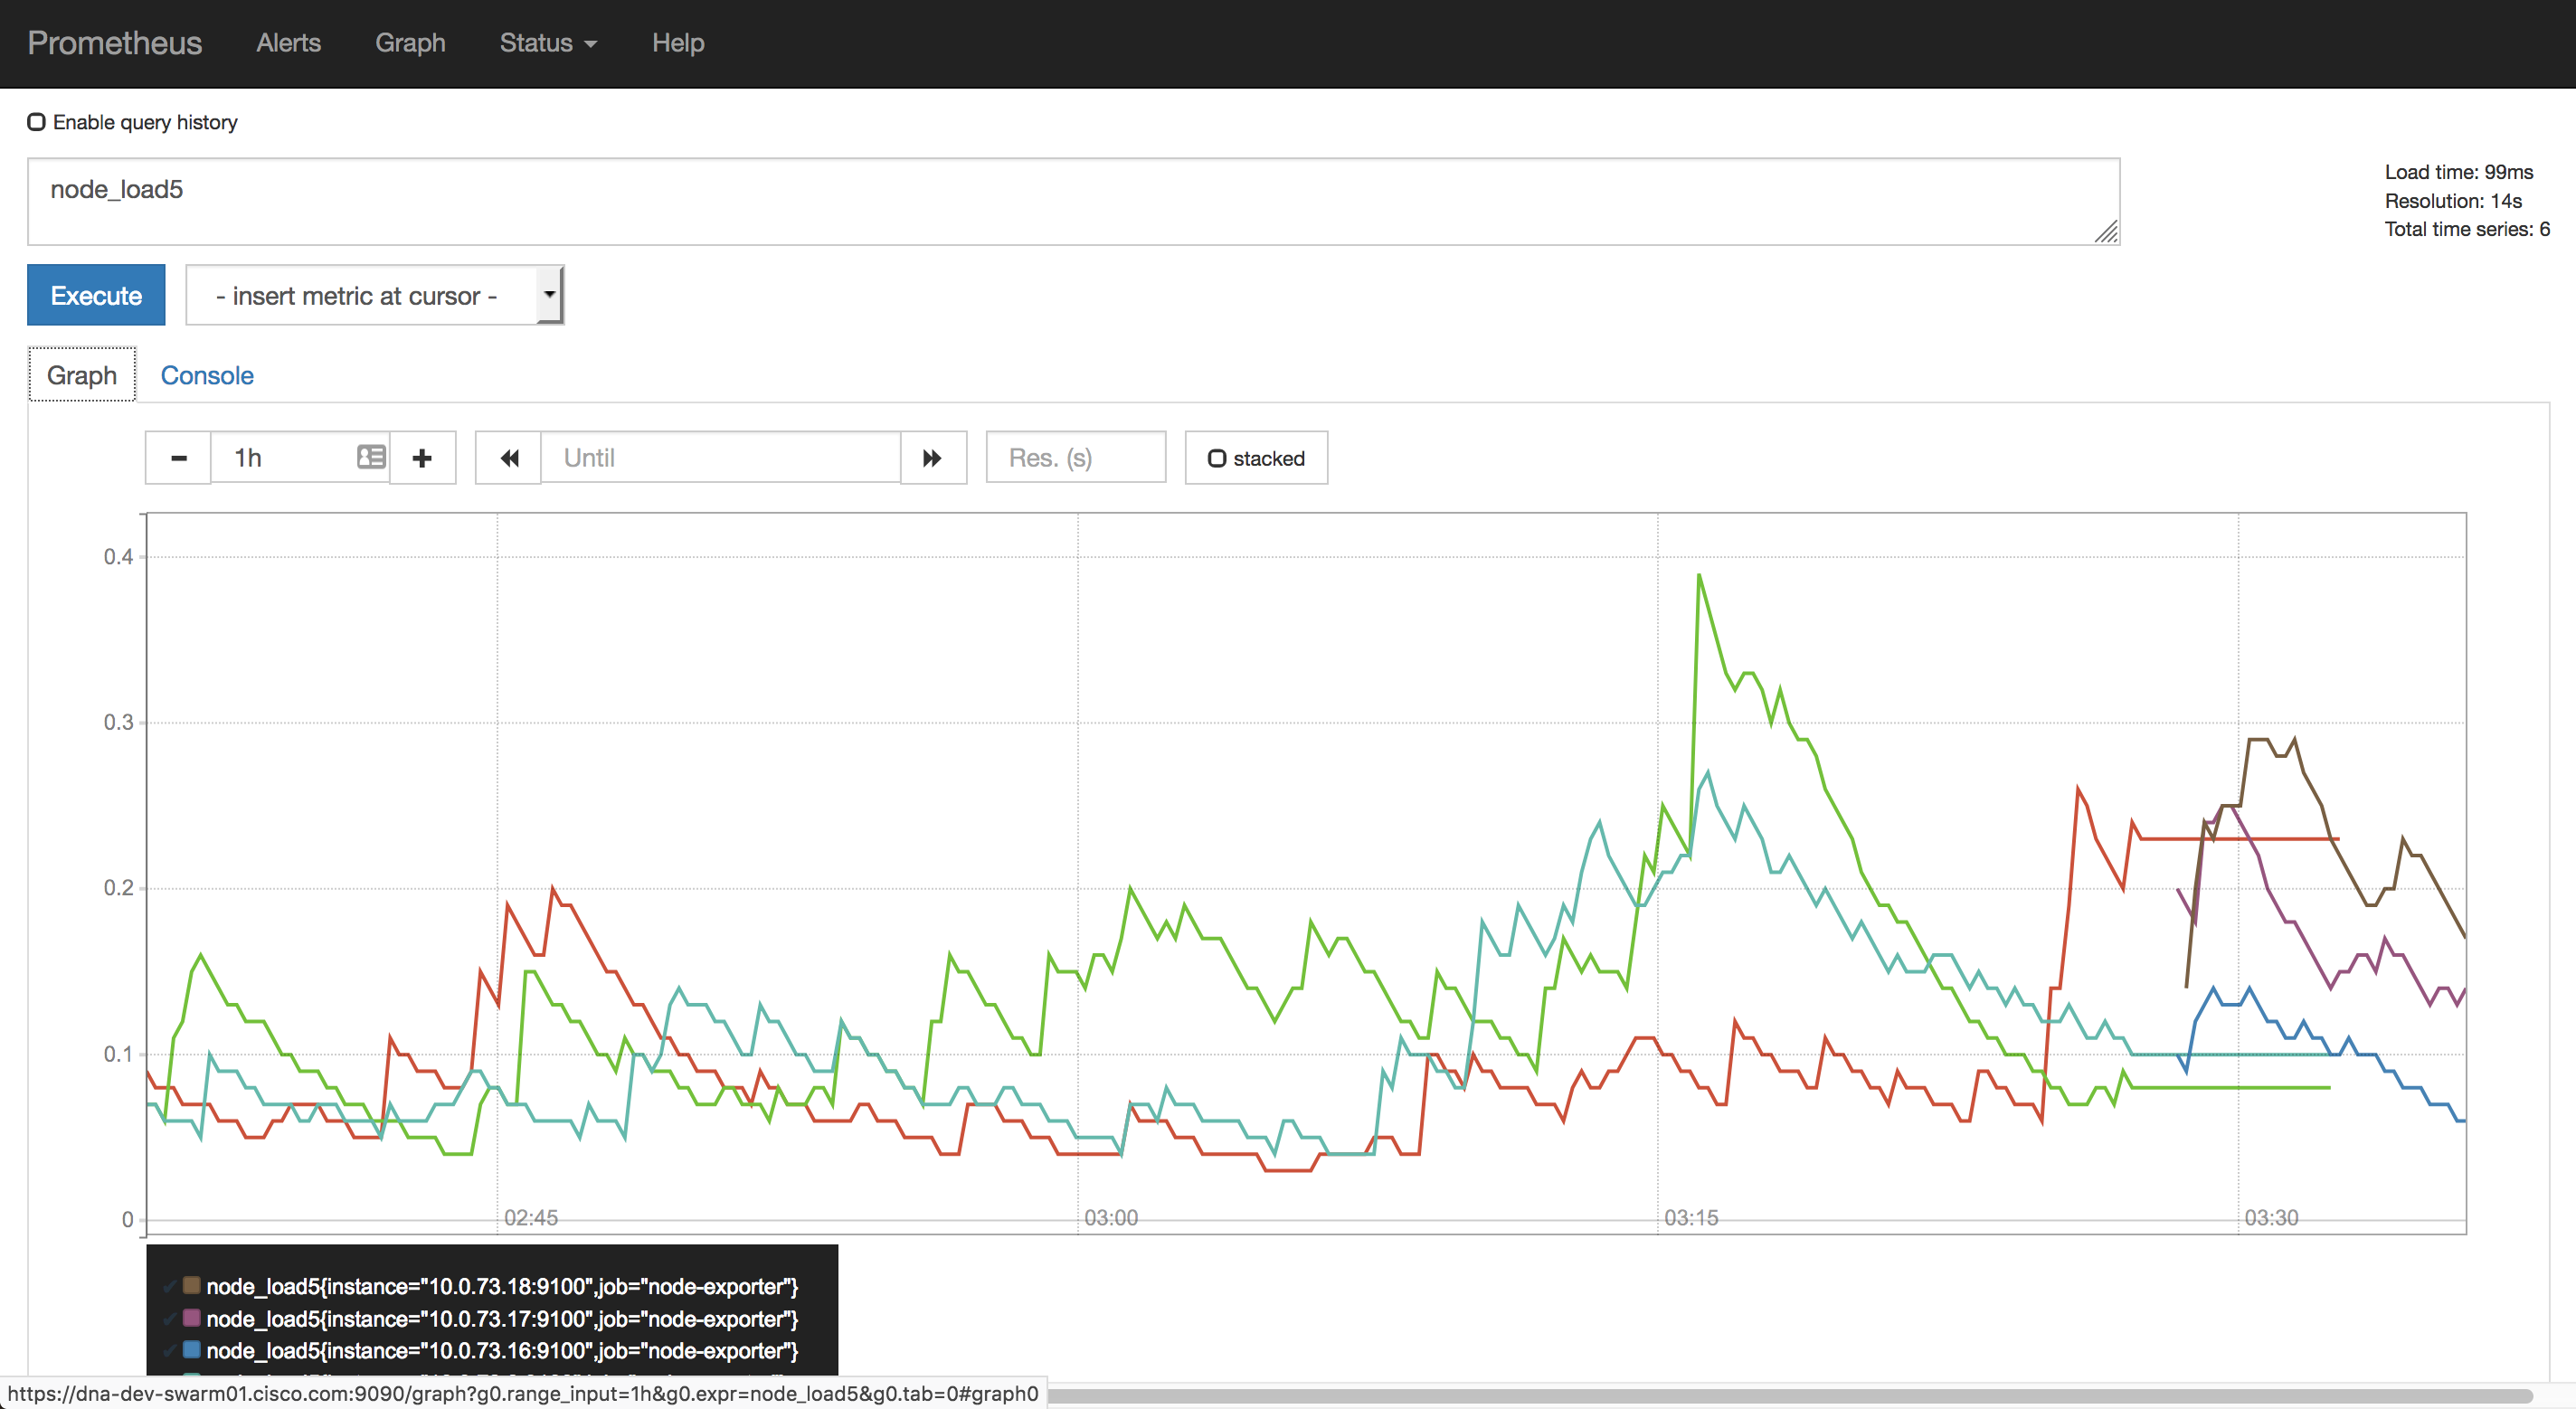
- Prometheus - Graphs
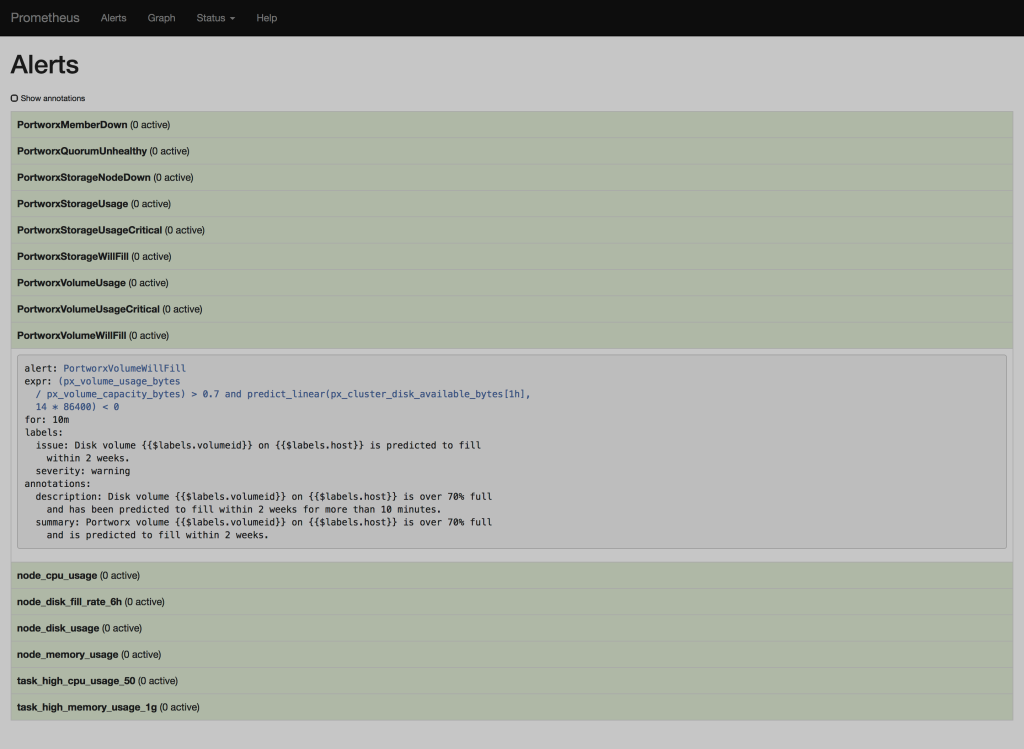
- Prometheus - Alerts
- Prometheus - Targets
- VIDEOS
- CREDITS
Easily deploy and update Docker swarm nodes as you scale up from at least (3) baremetal servers, AWS/GCE/etc instances, virtual machine(s) or just a single macOS laptop if you really need to, which will host your monitored containerized applications.
Manage one or more Docker swarm clusters via ansible playbooks that can (optionally) help you install and maintain Docker swarm clusters and their nodes, automatically install Portworx Developer or Enterprise persistent storage for your application's HA container volumes replicated across your swarm nodes, and also automatically update firewall configurations on all of your nodes.
swarmstack includes a modern DevOps workflow for monitoring and alerting about your containerized applications running within Docker swarms, including monitoring and alerting of the cluster health itself as well as the health of your own applications. swarmstack installs and updates Prometheus + Grafana + Alertmanager. swarmstack also provides an optional installation of Portworx for persistent storage for containers such as databases that need storage that can move to another Docker swarm node instantly, or bring your own persistent storage layer for Docker (e.g. RexRay, or use local host volumes and add placement constraints to docker-compose.yml)
The included Grafana dashboards will help you examine the health of the cluster, and the same metrics pipeline can easily be used by your own applications and visualized in Grafana and/or alerted upon via Prometheus rules and sent to redundant Alertmanagers to perform slack/email/etc notifications.
For an overview of the flow of metrics into Prometheus, exploring metrics using the meager PromQL interface Prometheus provides, and ultimately using Grafana and other visualizers to create dashboards while using the Prometheus time-series database as a datasource, watch Monitoring, the Prometheus way, read at Prometheus: Monitoring at SoundCloud and watch How Prometheus Revolutionized Monitoring at SoundCloud.

A set of ansible playbooks and a docker-compose stack that:
- Tunes EL7 sysctls for optimal network performance
- (optional: Docker) Installs and configures a 3+ node Docker swarm cluster from minimal EL7 hosts (or use existing swarm)
- (optional: etcd) Installs and configures a 3-node etcd cluster, used by Portworx for cluster metadata
- (optional: Portworx) Installs and configures 1 or several 3-node Portworx high availability storage clusters across your nodes. Default: px-dev (px-developer free license) (licensing), 5M+ pulls and exceptionally stable
- (DevOps: swarmstack) Configures and deploys the swarmstack tool chain, including Prometheus and Pushgateway, redundant Alertmanager instances, Grafana, karma, and Portainer containers, and also installs NetData under systemd on each host. All tools are secured using HTTPS by a Caddy reverse-proxy.
Optional
- Errbot - Connect alerts to social rooms to not already natively supported by Alertmanager
- InfluxDB - [deprecated] Useful for longer-term Prometheus storage/retrieval in certain workloads
- Loki - Like Prometheus but for logs
- TeamPass - Secure collaborative team management for shared credentials
- Trickster - In-memory Prometheus data cache for frequently re-requested tsdb blocks (accelerator for Grafana if you have popular dashboards)
- VictoriaMetrics - Fast, cost-effective and scalable time series database, long-term remote storage for Prometheus
A modern data-driven monitoring and alerting solution helps even the smallest of DevOps teams to develop and support containerized applications, and provides an ability to observe how applications perform over time, correlated to events occuring on the platform running them as well. Data-driven alerting makes sure the team knows when things go off-the-rails via alerts, but Prometheus also brings with it an easier way for you and your team to create alerts for applications, based on aggregated time-aware queries. For example:
alert: node_disk_fill_rate_6h
expr: predict_linear(node_filesystem_free{mountpoint="/"}[1h],
  6 * 3600) * on(instance) group_left(node_name) node_meta < 0
for: 1h
labels:
  severity: critical
annotations:
  description: Swarm node {{ $labels.node_name }} disk is going to fill up in 6h.
  summary: Disk fill alert for Swarm node '{{ $labels.node_name }}'
Learn how to add your own application metrics and alerts here: How to Export Prometheus Metrics from Just About Anything - Matt Layher, DigitalOcean or head straight to the existing Prometheus client libraries.
Grafana lets you visualize the metrics being collected into the Prometheus TSDB. You can build new chart/graph/table visualizations of your own application metrics using the same Prometheus data-source. Some default visualizations in Grafana are provided to help your team stay aware of the Docker swarm cluster health, and to dig into and explore what your containers and their volumes are doing:
Portworx provides a high-availability storage solution for containers that seeks to eliminate "ERROR: volume still attached to another node" situations that can be encountered with block device pooling storage solutions, situations can arise such as RexRay or EBS volumes getting stuck detaching from the old node and can't be mounted to the new node that a container moved to. Portworx replicates volumes across nodes in real-time so the data is already present on the new node when the new container starts up, speeding service recovery and reconvergence times.

There is a docker-compose-singlebox.yml stack that can be used to evaluate swarmstack on a single Docker swarm host without requiring etcd and Portworx or other persistent storage. Please see the INSTALLATION section for instructions on installing this singlebox version of swarmstack.
3 or more Enterprise Linux 7 (RHEL 7/CentOS 7) hosts (baremetal / VM or a combination), with each contributing (1) or more additional virtual or physical unused block devices or partitions to the Portworx storage cluster that swarmstack will install. More devices usually equals better performance. If bringing your own existing Docker swarm, 17.12.0+ is required by the swarmstack compose file (version 3.5). swarmstack will install or upgrade all defined [swarm] nodes to the latest stable version of Docker and will attempt to join all [swarm] hosts in the cluster to the SWARMJOIN defined host. You can change the Docker version installed, including using bleeding-edge repos if desired, by altering the docker.yml playbook.
Using the free Portworx PX-Developer version by default, swarmstack will install a storage cluster for each set of (3) hosts added to the cluster, which must provide a minimum 40GB (needed by swarmstack) up to the Portworx developer version limits of 1TB of persistent storage for up to 40 volumes across those 3 nodes. Adding 1TB drives/partitions from each node would be optimal to fill out the 1TB of replicated space. You can contribute unused block device(s) or partition(s), adding more smaller NMVe/SSDs on bare-metal or cloud-provider high-IOPS block devices would provide Portworx faster storage, but Portworx functions even across 3 VMs on the same machine each contributing storage from a single shared USB2 NAS, so scale your storage depending on your expected persistent-storage workloads. Block devices or partitions larger than 1TB can be contributed, but only 1TB of persistent storage will be available without licensing the PX-Enterprise version.
When deploying the default Portworx PX-Developer version, you'll add nodes in multiples of 3 and use constraints such as - node.label.storagegroup == RED to pin your individual services requiring persistent storage to one particular group of 3 hosts within the larger swarm cluster (e.g. nodes 1 2 3, nodes 4 5 6, etc). When choosing Portworx PX-Enterprise during installation, or when bringing another storage solution, these limitations may no longer apply and a single larger storage cluster could be made available simultaneously to many more swarm nodes without regard to pinning storage to groups of 3 nodes as px-dev supports. Only a subset of your application services will generally require persistent storage and will require a decision on which 3-node cluster to pin a service to. The remainder of the Portworx storage space is available for your applications to use. Containers not requiring persistent storage can be scheduled across the entire swarm cluster.
-
Before proceeding, make sure your hosts have their time in sync via NTP
-
For manual swarmstack installation instructions, see Manual swarmstack installation.md
-
When installing behind a required web proxy, see Working with swarmstack behind a web proxy.md
-
Instructions for updating swarmstack are available at Updating swarmstack.md
-
To deploy and monitor your own applications on the cluster, see Adding your own applications to monitoring.md
-
To manually push ephemeral or batch metrics into Prometheus, see Using Pushgateway.md
-
For reference on what swarmstack configures when enabling LDAP, see Using LDAP.md
-
Some basic commands for working with swarmstack and Portworx storage are noted in Notes.md
-
Open an issue. How do I use this project?
You may want to perform installation from a host outside the cluster, as running the docker.yml playbook may reboot hosts if kernels are updated (you can re-run it in the future to keep your hosts up-to-date). You can work around this by performing a 'yum update kernel' and rebooting if updated on one of your swarm hosts first and then running the ansible playbooks from that host.
# yum -y install epel-release && yum install git ansible

# cd /usr/local/src/

# git clone https://github.com/swarmstack/swarmstack

# rsync -aq --exclude=.git --exclude=.gitignore swarmstack/ localswarmstack/

# cd localswarmstack/ansible
There is a docker-compose-singlebox.yml stack that can be used to evaluate swarmstack on a single Docker swarm host without requiring etcd and Portworx or other persistent storage. This stack will save persistent named volumes to the single swarm host instead. Please see the file for installation instructions and skip all other steps below.
| Edit these (4) files: | |
|---|---|
| clusters/swarmstack | Configure all of your cluster nodes and storage devices |
| alertmanager/conf/alertmanager.yml | Optional: Configure where the Alertmanagers send notifications |
| roles/swarmstack/files/etc/swarmstack_fw/rules/cluster.rules | Used to permit traffic to the hosts themselves |
| roles/swarmstack/files/etc/swarmstack_fw/rules/docker.rules | Used to limit access to Docker service ports |
All of the playbooks below are idempotent, will only take actions on hosts where necessary, and can be safely re-run as needed, such as when changing cluster parameters or adding storage or additional nodes.
After execution of the swarmstack.yml playbook, you'll log into most of the tools as 'admin' and the ADMIN_PASSWORD set in ansible/clusters/swarmstack. You can update the ADMIN_PASSWORD later by executing docker stack rm swarmstack (persistent data volumes will be preserved) and then re-deploy the swarmstack docker-compose.yml
Instances such as Grafana and Portainer will save credential configuration in their respective persistent data volumes. These volumes can be manually removed if required and would be automatically re-initialized the next time the swarmstack compose file is deployed. You would lose any historical information such as metrics if you choose to initialize an application by executing docker volume rm swarmstack_volumename before re-running the swarmstack.yml playbook.
ansible-playbook -i clusters/swarmstack playbooks/firewall.yml -k
- (optional but HIGHLY recommended) you can run and re-run this playbook to manage firewalls on all of your nodes whether they run Docker or not.
ansible-playbook -i clusters/swarmstack playbooks/docker.yml -k
- (optional) Use this playbook if you haven't already brought up a Docker swarm, or just need to add swarm nodes to a new or existing Docker cluster. This playbook can also be used to maintain your Docker swarm nodes, and will serially work through each [swarm] node in the cluster to update all packages using yum (edit /etc/yum.conf and set 'exclude=' if you want to inhibit certain packages from being upgraded, even kernels), and will only drain then later reactivate each node if Docker or kernel updates are available and will be applied. You should develop a process to run this maintenance on your hosts regularly by simply running this playbook again.
ansible-playbook -i clusters/swarmstack playbooks/etcd.yml -k
- (optional) Used by Portworx to store storage cluster metadata in a highly-available manner. Only 3 nodes need to be defined to run etcd, and you'll probably just need to run this playbook once to establish the initial etcd cluster (which can be used by multiple Portworx clusters).
ansible-playbook -i clusters/swarmstack playbooks/portworx.yml -k
- (optional) Installs Portworx in groups of 3 nodes each. If you are instead bringing your own persistent storage, be sure to update the pxd driver in docker-compose.yml. Add new groups of 3 hosts later as your cluster grows. You can add 1 or more additional Docker swarm hosts in the [swarm] group but not in the [portworx] group; these extra hosts can absorb load across the cluster from containers not requiring persistent storage.
ansible-playbook -i clusters/swarmstack playbooks/swarmstack.yml -k
- This deploys or redeploys the swarmstack DevOps monitoring stack to the Docker swarm cluster. This includes installing or updating NetData on each node in order for Prometheus to collect metrics from it.
If you make changes to the local service configuration files in /usr/local/src/localswarmstack/, such as altering Prometheus configuation or rules, you can run the up script which will cause swarm to update only the services where configuration changes are detected. There is a similar script up-singlebox for these users as well.
The included Grafana dashboards will help you pin-point issues, and provides good visual indicators if something goes off the rails, but your DevOps team will want to keep an eye on karma (which watches both Alertmanager instances in one place), or your pager/email/IM channels, and you'll receive links back to the Prometheus rules being alerted on. Advanced Prometheus users might add runbook links to alert messages, possibly using a ChatOps process through a bot and attempt automatic remediation of the Prometheus condition or dimension being alerted on (reboot the host, kill the container, signal the application, etc).
Various Prometheus exporters are available for common services such as PostgreSQL. Client libraries are also available to help quickly expose Prometheus-compatible metrics from your own applications.
To attach your own applications into Prometheus monitoring, you'll need to make sure you deploy your services to attach to the swarmstack monitoring network in your own docker-compose files. See swarmstack/errbot-docker/docker-compose-swarmstack.yml for an example Docker compose service attaching to swarmstack_net to be monitored:
version: "3.5"

networks:
  default:
    external: true
    name: swarmstack_net
If you have an existing attachable encrypted Docker swarm network, replace the network stanza in docker-compose.yml with your own.
You'll need to expose your metrics in a Prometheus-compatible format on an HTTP port (traffic on the swarmstack_net overlay network is encrypted), and add the following labels to your service so that Prometheus will quickly start to scrape it. See swarmstack/swarmstack/docker-compose.yml for examples of services announcing they wish to be monitored by Prometheus:
    deploy:
      mode: replicated
      replicas: 1
      labels:
        prometheus.enable: "true"
        prometheus.port: "9093"
        prometheus.path: "/metrics"
You can use PromQL expressions within Grafana and Prometheus alike to create graphs and also Prometheus alert rules based on the same expressions, such as to alert when the availability status of some of your critical persistent volumes falls below 2. Try these:
px_volume_capacity_bytes
px_volume_capacity_bytes{volumename="my_volumename"}
netdata_
count(up)
See Querying Prometheus for the basics of PromQL syntax. The limited video playlist in the VIDEOS section of this page is an excellent resource to understand the tools deeper.
You can configure the Alertmanager instances to send emails or other notifications whenever Prometheus fires an alert to them. Alerts will be sent to both Alertmanager instances, and de-duplicated using a gossip protocol between them. Please see Alertmanager Configuration to understand it's built-in delivery mechanisms.
You can configure the routes and receivers for the swarmstack Alertmanager instances by editing /usr/local/src/localswarmstack/alertmanager/conf/alertmanager.yml
If you need to connect to a service that isn't supported natively by Alertmanager, you have the option to configure it to fire a webhook towards a target URL, with some JSON data about the alert being sent in the payload. You can provide the receiving service yourself, or consume cloud services such as https://www.built.io/.
One option would be to configure a bot listening for alerts from Alertmanager instances (you could use it also as an alerting target for your code as well). Upon receiving alerts via a web server port, the bot would then relay them to an instant-message destination. swarmstack builds a Docker image of Errbot, one of many bot programs that can provide a conduit between receiving a webhook, processing the received data, and then connecting to something else (in this case, instant-messaging networks) and relaying the message to a recipient or a room's occupants. If this sounds like the option for you, please see the following project:
https://github.com/swarmstack/errbot-docker
There is an adjunct https://github.com/swarmstack/loki project that can be used to quickly turn up an instance of Grafana Loki, which your swarmstack or other Grafana instance can configure as a data source. By default, this project will feed the stdout and stderr of all of your Docker swarm containers into Loki (using the loki-docker-driver Docker plugin on each node). Loki can also be fed directly by your own applications, via Fluentd / Fluent Bit, or via other logging facilities.
The data retention period for Prometheus is defaulted to 48 hours within the docker compose files, and a default 10GB Prometheus data volume will be created for HA swarmstack users. Prometheus itself is not designed for long-term storage and retrieval of time-series data, but can work with several storage back-ends as remote-read and remote-write targets. If you find that you need to perform queries on metrics data older than a few days, you should explore deploying other options for long-term storage and retrieval of Prometheus data. Prometheus can optionally replicate metrics stored within it's own internal time-series database (TSDB) out to one or more external TSDB such as VictoriaMetrics, and supports efficient remote-write capabilities for replicating data into these longer-term storage sources.
VictoriaMetrics can be used to persist metrics data in a way that Prometheus-compatible applications (such as Grafana) can consume it. Other storage back-ends for Prometheus are also available. The project swarmstack/victoria-metrics can help swarmstack users quickly bring up an optional VictoriaMetrics remote-write back-end for hosting longer-term metrics. See Remote Write Storage Wars for more information.
You might instead choose to scale your Prometheus using a federated architecture across multiple Prometheus shards using Thanos, see PromCon 2018: Thanos - Prometheus at Scale
If you want to centralize your Prometheus data-sources rather than federating them, scalable designs such as Cortex are available for self-hosting. Commerical offerings such as GrafanaCloud - Hosted Metrics, InfluxDB with HA, and Weave Cloud are also available.
By default, Grafana will query the Prometheus data source directly. As you add dashboards that might require (re)querying hundreds of metrics per refresh period, per viewer, this can lead to high load on your Prometheus database. There is an adjunct project https://github.com/swarmstack/trickster that can act as cache for Prometheus metrics for (typically) lower-resolution dashboards or other software where caching and coalescing of metrics data may be acceptable. Useful for cases where operating a more performant storage/retrieval backend for your Prometheus data (such as VictoriaMetrics) isn't desired.
As your needs for this stack grow, you may find yourself replacing some of the services within this stack with your own tools. Hope this got you or your team heading in a great direction running applications at scale. Kubernetes is also your friend, and should be used where needed to scale parts that need to scale beyond several dozen swarm nodes (story link). You might just choose to deploy some applications (such as Cortex) on Kubernetes, and also run some of your services or development on Docker swarm. Both can be used together to solve your needs.
Below is mainly for documentation. After installing swarmstack, just connect to https://swarmhost of any Docker swarm node and authenticate with your ADMIN_PASSWORD to view the links:
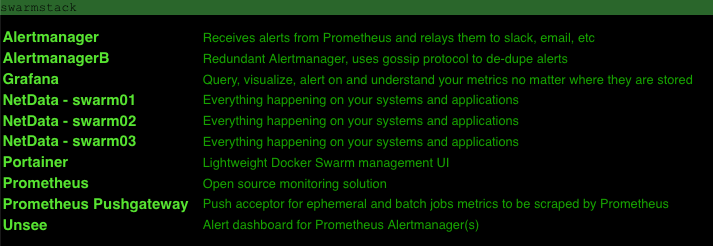
| DevOps Tool | Browser URL (proxied by Caddy) |
Purpose |
|---|---|---|
| Alertmanager | https://swarmhost:9093 https://swarmhost:9095 |
Receives alerts from Prometheus and relays them to slack, email, etc |
| karma | https://swarmhost:9094 | Alert dashboard for Prometheus Alertmanager(s) |
| Grafana | https://swarmhost:3000 | Query, visualize, alert on and understand your metrics no matter where they are stored |
| NetData | https://swarmhost:19998/hostname/ | Everything happening on your systems and applications |
| Portainer | https://swarmhost:9000 | Lightweight Docker Swarm management UI |
| Prometheus | https://swarmhost:9090 | Open-source monitoring solution |
| Prometheus Pushgateway | https://swarmhost:9091 | Push acceptor for ephemeral and batch jobs metrics to be scraped by Prometheus |
| Security | Notes | Source / Image |
|---|---|---|
| Caddy | Reverse proxy - see above for URLs | Source:https://github.com/swarmstack/caddy Image:https://hub.docker.com/r/swarmstack/caddy no-stats |
| Docker Garbage Collection | Removes unused and expired Docker images, containers, and volumes | Source: https://github.com/clockworksoul/docker-gc-cron Image:https://hub.docker.com/r/clockworksoul/docker-gc-cron latest |
| Fail2ban | Brute-force prevention | ansible/playbooks/firewall.yml |
| iptables | Firewall management | ansible/playbooks/firewall.yml |


- swarmstack introduction video
- How to Export Prometheus Metrics from Just About Anything - Matt Layher, DigitalOcean
- Monitoring, the Prometheus way
- How Prometheus Revolutionized Monitoring at SoundCloud.
- Prometheus Monitoring for DevOps teams playlist
Credit is due to the excellent DevOps stack proposed and maintained by Stefan Prodan and his project swarmprom.
Thank you Carl Bergquist for Grafana golang updates.
Thank you Guillaume Binet and the Errbot community for assistance with plugins.
Thanks Łukasz Mierzwa for karma fixes and updates.
Thanks to Mark Sullivan at Cisco for his work on the Cisco Webex Teams backend for Errbot.
Thanks goes to the team at Portworx for their excellent storage product and support.
Thanks to Shannon Wynter for Caddy re-authentication fixes for LDAP.
Thanks to Nils Laumaillé for TeamPass - Managing passwords in a collaborative way - swarmstack/teampass