关于prometheus无法采集服务指标的问题总结
superleeyom opened this issue · comments

名词解析
context-path
对应的 Spring Boot 后台服务,如果增加了 server.servlet.context-path 配置,则会指定项目路径,是构成 url 地址的一部分,比如,在没有加此配置前,我们获取用户列表接口是这样访问:
http://127.0.0.1:8090/user/list
设定项目路径,server.servlet.context-path=demo,则用户访问接口路径变为:
http://127.0.0.1:8090/demo/user/list
prometheus
中文名称叫「普罗米修斯」,普罗米修斯主要用于事件监控和警告,它可以和 Spring Boot 的子项目 Spring Boot Actuator 进行整合,它为应用提供了强大的监控能力,目前网上有很多的整合的示例,本文不在这里细讲了:
- Spring Boot 2.x监控数据可视化(Actuator + Prometheus + Grafana手把手)
- SpringBoot集成prometheus
- 使用 Prometheus & Grafana 监控你的 Spring Boot 应用
- 基于Prometheus搭建SpringCloud全方位立体监控体系
起因
在 SkyWalking 上监控到,有很多服务的普罗米修斯监控请求,出现了 404:

后面经过排查,就是由于应用设置了 context-path的原因造成的,由于普罗米修斯监控站点走的是
http://${host}:${port}/actuator/prometheus这种 url,但是实际我们的服务都是加了context-path,也就是
http://${host}:${port}/${context-path}/actuator/prometheus,就导致普罗米修斯在 fetch 的时候,直接404,无法获取监控信息。
解决方案
由于 prometheus 是通过 Eureka 发现服务的,观察 prometheus 的配置文件 prometheus.yml:
scrape_configs:
  - job_name: 'eureka-prometheus'
    # 采集的路径
    metrics_path: '/actuator/prometheus'
    # eureka 注册中心地址
    eureka_sd_configs:
      - server: http://192.168.100.93:8761/eureka
由于后台服务都是注册在 Eureka 上的,比如我们查看某个服务在 Eureka 上的注册信息,浏览器访问:http://192.168.100.93:8761/eureka/apps/${application-name},例如这个服务返回的注册信息:
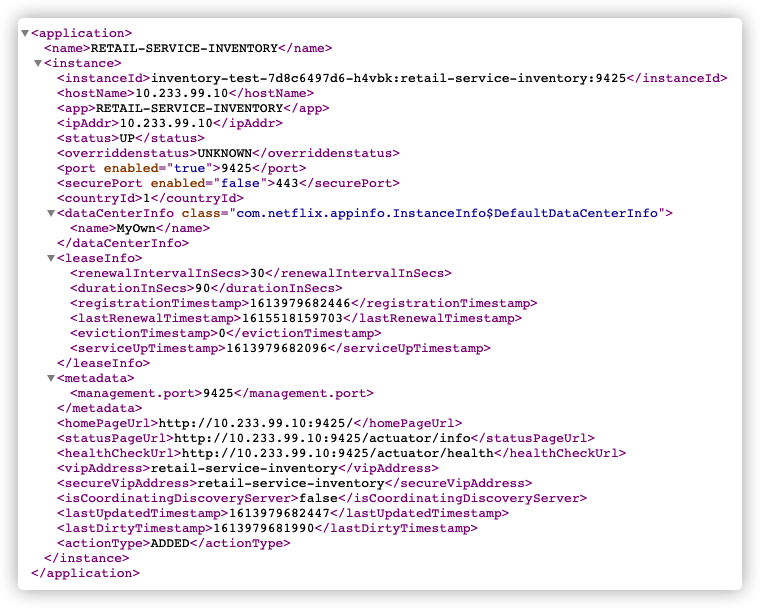
可以看出我们并没有将服务的指标路径(抓取路径)写入到 Eureka 的元数据(metadata) 中,所以 prometheus 最终发起的获取监控信息请求是http://ip:port+metrics_path:,比如:http://10.233.99.10:9425/actuator/prometheus,那假设这个服务没有设置 context-path,它肯定是可以正常返回监控信息:

如果设置了 context-path,它最终依旧还是以 http://10.233.99.10:9425/actuator/prometheus 去访问,那肯定就会提示 404 了。
加了server.servlet.context-path以后,抓取的路径就不再是 http://10.233.99.10:9425/actuator/prometheus了,而是变成了 http://10.233.99.10:9425/inventory/actuator/prometheus了。之前我们 prometheus.yml 文件里静态配置抓取目标的 metrics_path是/actuator/prometheus,但是现在不能这样写了,因为加了应用上下文路径,而且每个服务都不一样,所以为了能够根据各服务动态自定义指标路径,需要如下处理:
-
在服务的
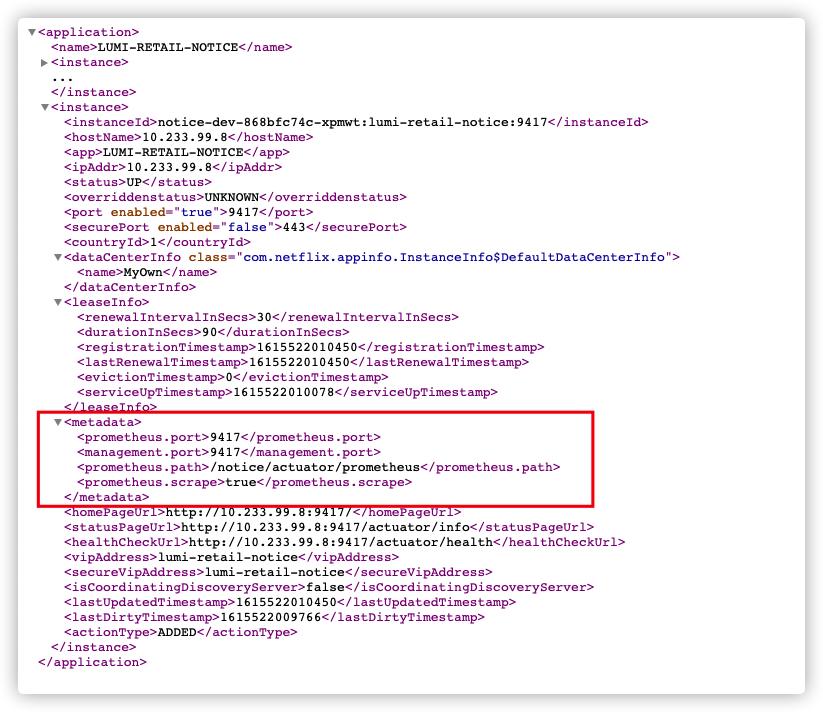
application.yml文件里,增加如下的配置:eureka: instance: metadata-map: "prometheus.scrape": "true" "prometheus.path": "${server.servlet.context-path}/actuator/prometheus" "prometheus.port": "${server.port}"
prometheus 是通过 Eureka 发现服务的,因此只有将服务的指标路径(抓取地址)写到 Eureka 里,prometheus 才能拿到,换言之,只有服务在注册的时候,将自己暴露的端点(endpoint)以元数据的方式写到 Eureka 中, prometheus 才能正确的从目标抓取数据。
-
修改
prometheus.yml,去掉指定的metrics_path, 改为通过 Eureka 获取抓取目标:scrape_configs: - job_name: 'eureka-prometheus' eureka_sd_configs: - server: http://192.168.100.93:8761/eureka relabel_configs: - source_labels: [__meta_eureka_app_instance_metadata_prometheus_path] action: replace target_label: __metrics_path__ regex: (.+)
-
重启对应的后台服务,不出意外,prometheus 就能正常的获取监控信息了。