AR/MA model experiments
AR(p) and MA(q) model exploration in MATLAB using custom sample autocorrelation and sample partial autocorrelation implementations.
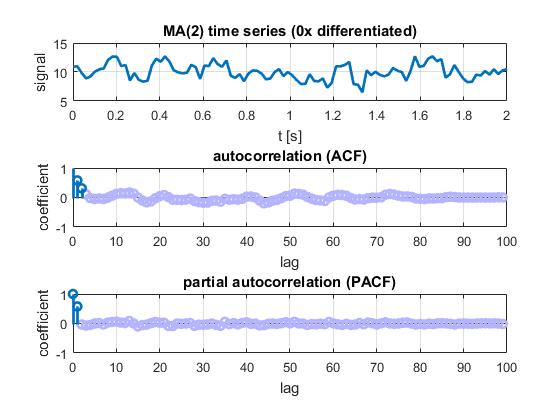
AR(2) example
The following picture shows ACF and PACF plots for an AR(2) process with the parameters
y(0) = -42
y(t) = 0.7 y(t-1) + 0.2 y(t-2) + WN(my=0, sigma=1)
The ACF plot shows dampened sinusoidal behavior, indicating an AR(p) process, while the PACF shows no significant value after lag p=2, indicating AR(2).
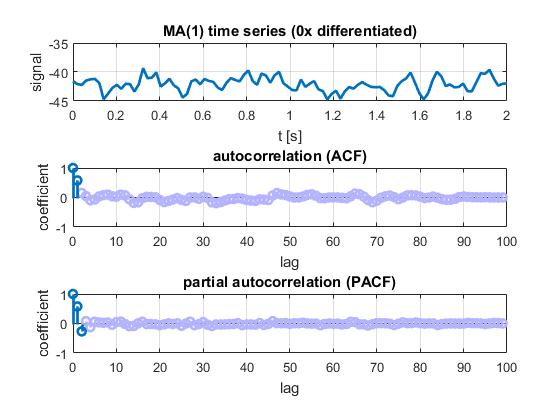
MA(1) example
The following picture shows ACF and PACF plots for an MA(1) process with the parameters
y(0) = epsilon(0) - 42
y(t) = 0.8 epsilon(t-1) - 42
The PACF plot shows dampened sinusoidal behavior, indicating an MA(q) process, while the ACF shows no significant value after lag p=1, indicating MA(1).
95% confidence intervals
The confidence intervals of the ACF and PACF plots are set to ± 1.96/√N. Here N is the number of observations and 1.96 is the number of standard deviations 95% of the correlation values are expected lie within in under the assumption of the null hypothesis of no correlation.

