Scalable Crowd Motion Detection and Analysis
This repository provides an implementation in Python 2.7 of our algorithm [1] for scalable detection of crowd motion patterns. The algorithm takes as input a set of pedestrian trajectories and outputs a set of crowd motion patterns, i.e., contiguous spatial areas describing the dominant motions within the crowd.
About
When analyzing crowds, one is often interested in the overall motions of the crowd as a whole and not in the motions of each individual. A high-level representation using crowd motion patterns exposes the macro scale spatio-temporal patterns within the crowd.
Our method for discovering these motion patterns uses a three-stage pipeline: (1) represent the behavior of each person at each moment in time using a low-dimensional data point (tracklet), (2) cluster these data points based on spatial relations to discover small motion clusters, (3) concatenate clusters that are frequently visited in sequence to discover large motion patterns.
Screenshots
Input:
python src/visualize.py data/hurricane_best_track.txt
Output:
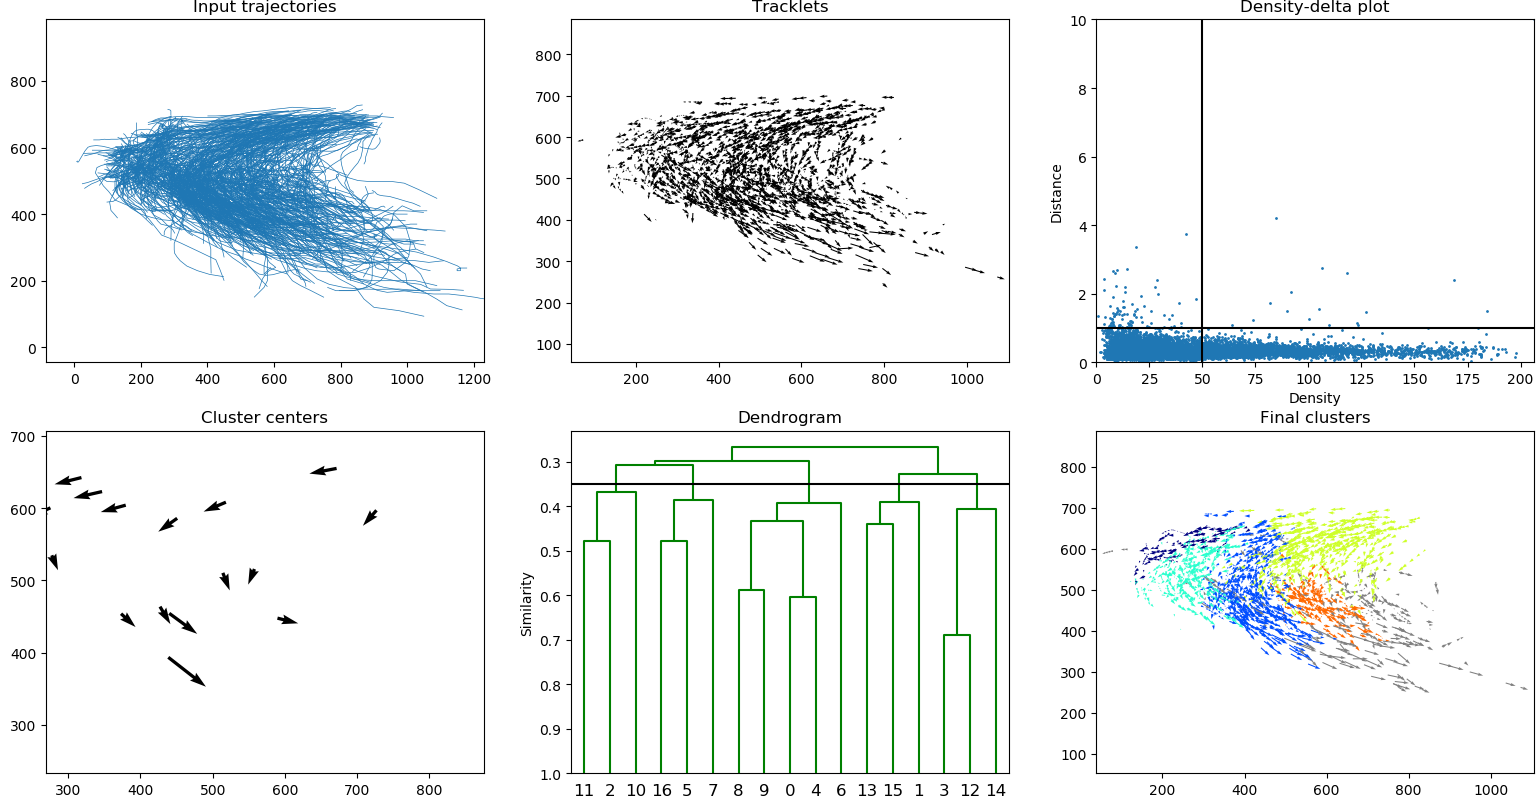
Input:
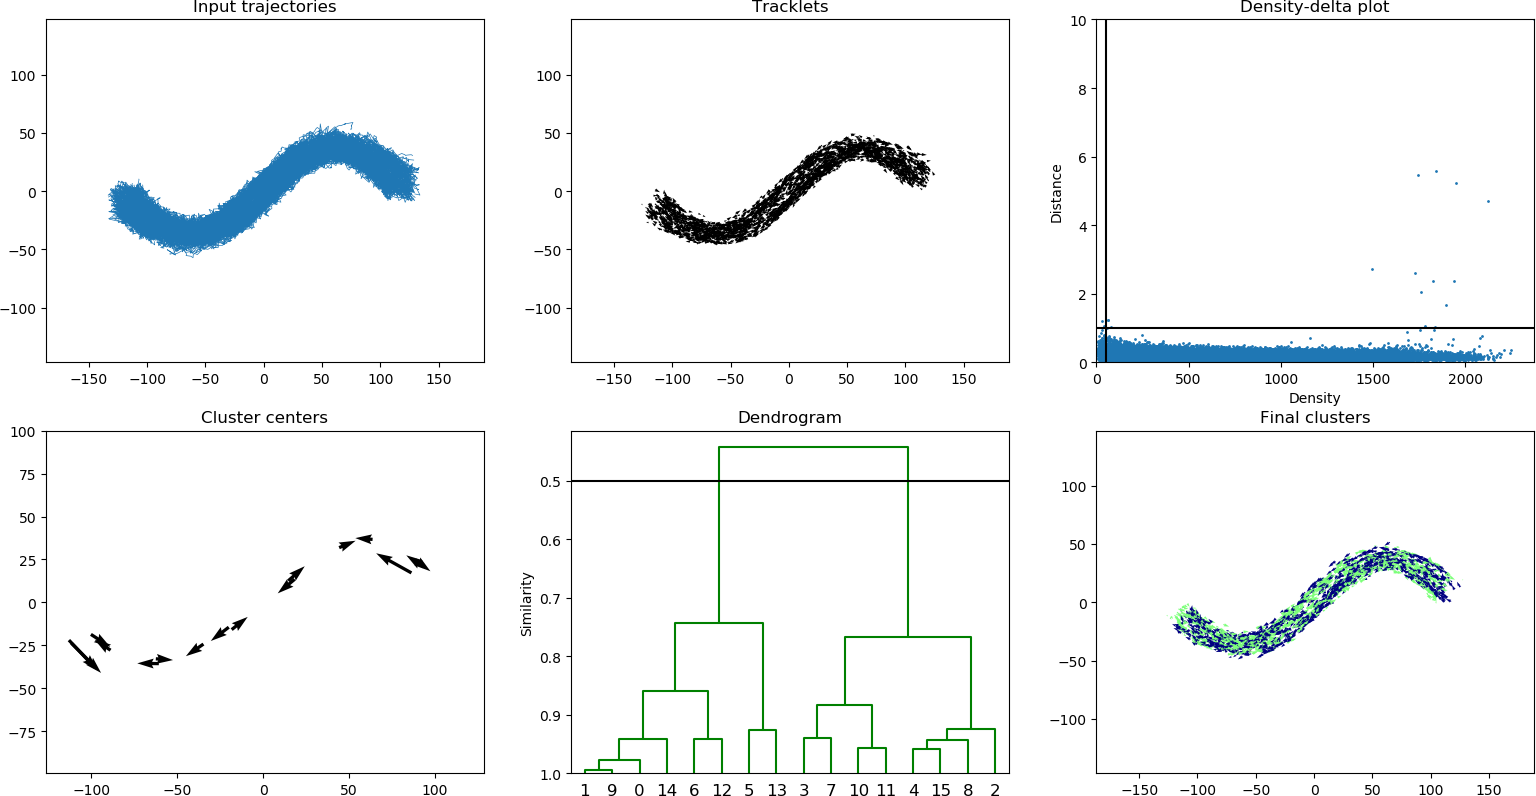
python src/simulate.py sinus | python src/visualize.py - --beta 0.3 --alpha 15 --gamma 0.99 --cut 0.5
Output:
Requirements
The implementation requires Python 2.7. Additionally, the following PIP packages must installed:
- numpy (1.12.1)
- matplotlib (2.0.0)
- scipy (0.18.1)
Use pip install -r requirements.txt to install these packages.
We recommend using virtualenv to create a isolated Python environment. The final command will activate your isolated python environment.
virtualenv --python=python2.7 crowd-analysis
crowd-analysis/bin/pip install -r requirements.txt
source crowd-analysis/bin/activate
This
Usage
There are three parts provided by this implementation: (1) a visualization script which analyzes a given dataset and plots the results, (2) a simulation script for creating synthetic crowd datasets, and (3) a library which can be integrated into other applications.
Visualization
Use src/visualize.py to analyze a given dataset and plot the results. The input format is text-based with each line corresponding to one 2D trajectory. Empty lanes or lanes starting with # are ignored. Each lane consists of coordinates, alternating x and y coordinate. Example of input format.
# example of 3 trajectories
555.0 635.0  545.0 629.0  530.0 623.0
547.0 648.0  535.0 643.0  524.0 641.0  513.0 640.0
227.0 550.0  214.0 542.0
To execute the algorithm:
python src/visualize.py mydata.txt
The program offers various flags to set the algorithm parameters (e.g., --alpha, --beta, --gamma, --cut). For example, change alpha and beta using:
python src/visualize.py mydata.txt --alpha 25 --beta 5
See --help for the full list of options.
python src/visualize.py --help
Crowd Simulator
Use src/simulate.py for generating synthetic crowd datasets using our simulation and embedding method [1]. See --help for the full list of options. Currently, five scenarios are supported:
lane: two opossing lanes.sinus: two opposing sinusoidal paths.parallel: two parallel lanes some distance apart.crossing: two parallel lanes intersecting at some angle.divergent: one lane splitting into two lanes.
The output of the simulation can either be written to a file (using -o flag) or directly passed to the visualization program (specify - as input). In general, the parameters alpha=15, beta=0.3, gamma=0.99, and cut=0.5 work well.
python src/simulate.py sinus | python src/visualize.py - --beta 0.3 --alpha 15 --gamma 0.99 --cut 0.5
Library
See src/detection.py for details on integrating our work into your application. The important functions are:
ids, tracklets = build_tracklets(trajectories, window)
rho, delta, parent = prepare_quick_shift(tracklets)
labels, centers = perform_quick_shift(rho, delta, parent, min_rho=0, max_delta=1)
A = calculate_cohesion(ids, labels, gamma, samples=25)
labels = merge_cohesion(labels, A, cut=None)
Example Datasets
The dataset data/hurricane_best_track.txt has been extracted from the Best Track Data (HURDAT2) which has been released by the National Hurricane Center of the National Oceanic and Atmospheric Administration (https://www.nhc.noaa.gov/data/). The dataset consists of six-hourly locations of all known tropical cyclones and subtropical cyclones since 2004.
License
This software is licensed under the MIT license.
Bibliography
[1] S. Heldens, N. Litvak and M. van Steen, "Scalable Detection of Crowd Motion Patterns," in IEEE Transactions on Knowledge and Data Engineering, vol. 32, no. 1, pp. 152-164, 2018, doi: 10.1109/TKDE.2018.2879079.