Netdata 


Netdata is distributed, real-time performance and health monitoring for systems and applications. It is a highly-optimized monitoring agent you install on all your systems and containers.
Netdata provides unparalleled insights, in real-time, of everything happening on the systems it's running on (including web servers, databases, applications), using highly interactive web dashboards.
A highly-efficient database stores long-term historical metrics for days, weeks, or months, all at 1-second granularity. Run this long-term storage autonomously, or integrate Netdata with your existing monitoring toolchains (Prometheus, Graphite, OpenTSDB, Kafka, Grafana, and more).
Netdata is fast and efficient, designed to permanently run on all systems (physical and virtual servers, containers, IoT devices), without disrupting their core function.
Netdata is free, open-source software and it currently runs on Linux, FreeBSD, and macOS, along with other systems derived from them, such as Kubernetes and Docker.
Netdata is not hosted by the CNCF but is the fourth most starred open-source project in the Cloud Native Computing Foundation (CNCF) landscape.
People get addicted to Netdata. Once you use it on your systems, there is no going back! You've been warned...


Contents
- What does it look like? - Take a quick tour through the dashboard
- Our userbase - Enterprises we help monitor and our userbase
- Quickstart - How to try it now on your systems
- Why Netdata - Why people love Netdata and how it compares with other solutions
- News - The latest news about Netdata
- How Netdata works - A high-level diagram of how Netdata works
- Infographic - Everything about Netdata in a single graphic
- Features - How you'll use Netdata on your systems
- Visualization - Learn about visual anomaly detection
- What Netdata monitors - See which apps/services Netdata auto-detects
- Documentation - Read the documentation
- Community - Discuss Netdata with others and get support
- License - Check Netdata's licencing
- Is it any good? - Yes.
- Is it awesome? - Yes.
What does it look like?
The following animated GIF shows the top part of a typical Netdata dashboard.

A typical Netdata dashboard, in 1:1 timing. Charts can be panned by dragging them, zoomed in/out with
SHIFT+mouse wheel, an area can be selected for zoom-in withSHIFT+mouse selection. Netdata is highly interactive, real-time, and optimized to get the work done!
Want to try Netdata before you install? See our live demo.
User base
Netdata is used by hundreds of thousands of users all over the world. Check our GitHub watchers list. You will find people working for Amazon, Atos, Baidu, Cisco Systems, Citrix, Deutsche Telekom, DigitalOcean, Elastic, EPAM Systems, Ericsson, Google, Groupon, Hortonworks, HP, Huawei, IBM, Microsoft, NewRelic, Nvidia, Red Hat, SAP, Selectel, TicketMaster, Vimeo, and many more!
Docker pulls
We provide Docker images for the most common architectures. These are statistics reported by Docker Hub:


Registry
When you install multiple Netdata, they are integrated into one distributed application, via a Netdata registry. This is a web browser feature and it allows us to count the number of unique users and unique Netdata servers installed. The following information comes from the global public Netdata registry we run:
In the last 24 hours:
Quickstart
To install Netdata from source on any Linux system (physical, virtual, container, IoT, edge) and keep it up to date with our nightly releases automatically, run the following:
# make sure you run `bash` for your shell
bash

# install Netdata directly from GitHub source
bash <(curl -Ss https://my-netdata.io/kickstart.sh)
Starting with v1.12, Netdata collects anonymous usage information by default and sends it to Google Analytics. Read about the information collected, and learn how to-opt, on our anonymous statistics page.
The usage statistics are vital for us, as we use them to discover bugs and prioritize new features. We thank you for actively contributing to Netdata's future.
To learn more about the pros and cons of using nightly vs. stable releases, see our notice about the two options.
The above command will:
- Install any required packages on your system (it will ask you to confirm before doing so)
- Compile it, install it, and start it.
More installation methods and additional options can be found at the installation page.
To try Netdata in a Docker container, run this:
docker run -d --name=netdata \
  -p 19999:19999 \
  -v netdatalib:/var/lib/netdata \
  -v netdatacache:/var/cache/netdata \
  -v /etc/passwd:/host/etc/passwd:ro \
  -v /etc/group:/host/etc/group:ro \
  -v /proc:/host/proc:ro \
  -v /sys:/host/sys:ro \
  -v /etc/os-release:/host/etc/os-release:ro \
  --restart unless-stopped \
  --cap-add SYS_PTRACE \
  --security-opt apparmor=unconfined \
  netdata/netdata
For more information about running Netdata in Docker, check the docker installation page.

From Netdata v1.12 and above, anonymous usage information is collected by default and sent to Google Analytics. To read more about the information collected and how to opt-out, check the anonymous statistics page.
Why Netdata
Netdata has a quite different approach to monitoring.
Netdata is a monitoring agent you install on all your systems. It is:
- A metrics collector for system and application metrics (including web servers, databases, containers, and much more),
- A long-term metrics database that stores recent metrics in memory and "spills" historical metrics to disk for efficient long-term storage,
- A super fast, interactive, and modern metrics visualizer optimized for anomaly detection,
- And an alarms notification engine for detecting performance and availability issues.
All the above, are packaged together in a very flexible, extremely modular, distributed application.
This is how Netdata compares to other monitoring solutions:
| Netdata | others (open-source and commercial) |
|---|---|
| High resolution metrics (1s granularity) | Low resolution metrics (10s granularity at best) |
| Monitors everything, thousands of metrics per node | Monitor just a few metrics |
| UI is super fast, optimized for anomaly detection | UI is good for just an abstract view |
| Long-term, autonomous storage at one-second granularity | Centralized metrics in an expensive data lake at 10s granularity |
| Meaningful presentation, to help you understand the metrics | You have to know the metrics before you start |
| Install and get results immediately | Long preparation is required to get any useful results |
| Use it for troubleshooting performance problems | Use them to get statistics of past performance |
| Kills the console for tracing performance issues | The console is always required for troubleshooting |
| Requires zero dedicated resources | Require large dedicated resources |
Netdata is open-source, free, super fast, very easy, completely open, extremely efficient, flexible and integrate-able.
It has been designed by system administrators, DevOps engineers, and developers for to not just visualize metrics, but also troubleshoot complex performance problems.
News
May 11, 2020 - Netdata v1.22.0 released!
Release v1.22.0 marks the official launch of our rearchitected Netdata Cloud! This Agent release contains both backend and interface changes necessary to connect your distributed nodes to this dramatically improved experience.
Netdata Cloud builds on top of our open source monitoring Agent to give you real-time visibility for your entire infrastructure. Once you've connected your Agents to Cloud, you can view key metrics, insightful charts, and active alarms from all your nodes in a single web interface. When an anomaly strikes, seamlessly navigate to any node to troubleshoot and discover the root cause with the familiar Netdata dashboard.

Sign in to Cloud and read our Get started with Cloud guide for details on updating your nodes, claiming them, and navigating the new Cloud.
While Netdata Cloud offers a centralized method of monitoring your Agents, your metrics data is not stored or centralized in any way. Metrics data remains with your nodes and is only streamed to your browser through Cloud.
In addition, Cloud only expands on the functionality of the wildly popular free and open source Agent. We will never make any of our open source Agent features Cloud-exclusive, and we will actively continue to develop the Agent so that we can integrate new features with Netdata Cloud.
We added a new collector called whoisquery that helps you monitor a domain name's expiration date. You can track as many domains as you'd like, and set custom warning and critical thresholds for each. For more information on setup and configuration, see the Whois domain expiry monitoring documentation.
We added a new connector to our experimental exporting engine: Prometheus remote write. You can use this connector to send Netdata metrics to your choice of more than 20 external storage providers for long-term archiving and further analysis.
Our new documentation experience is now available at Netdata Learn! We encourage you to try it out and give us feedback or ask questions in our GitHub issues. Learn features documentation for both the Agent and Cloud in separate-but-connected vaults, which streamlines the experience of learning about both products.
While Learn only features documentation for now, we plan on releasing more types of educational content serving the Agent's open-source community of developers, sysadmins, and DevOps folks. We'll have more to announce soon, but in the meantime, we hope you enjoy what we believe is a smoother (and prettier) docs experience.
As part of the ongoing work to polish our eBPF collector tech preview, we've now proven the collector's performance is very good, and have vastly expanded the number of operating system versions the collector works on. Learn how to enable it in our documentation. We've also extensively stress-tested the eBPF collector and found that it's impressively fast given the depth of metrics it collects! Read up on our benchmarking analysis on GitHub.
See more news and previous releases at our blog or our releases page.
How it works
Netdata is a highly efficient, highly modular, metrics management engine. Its lockless design makes it ideal for concurrent operations on the metrics.
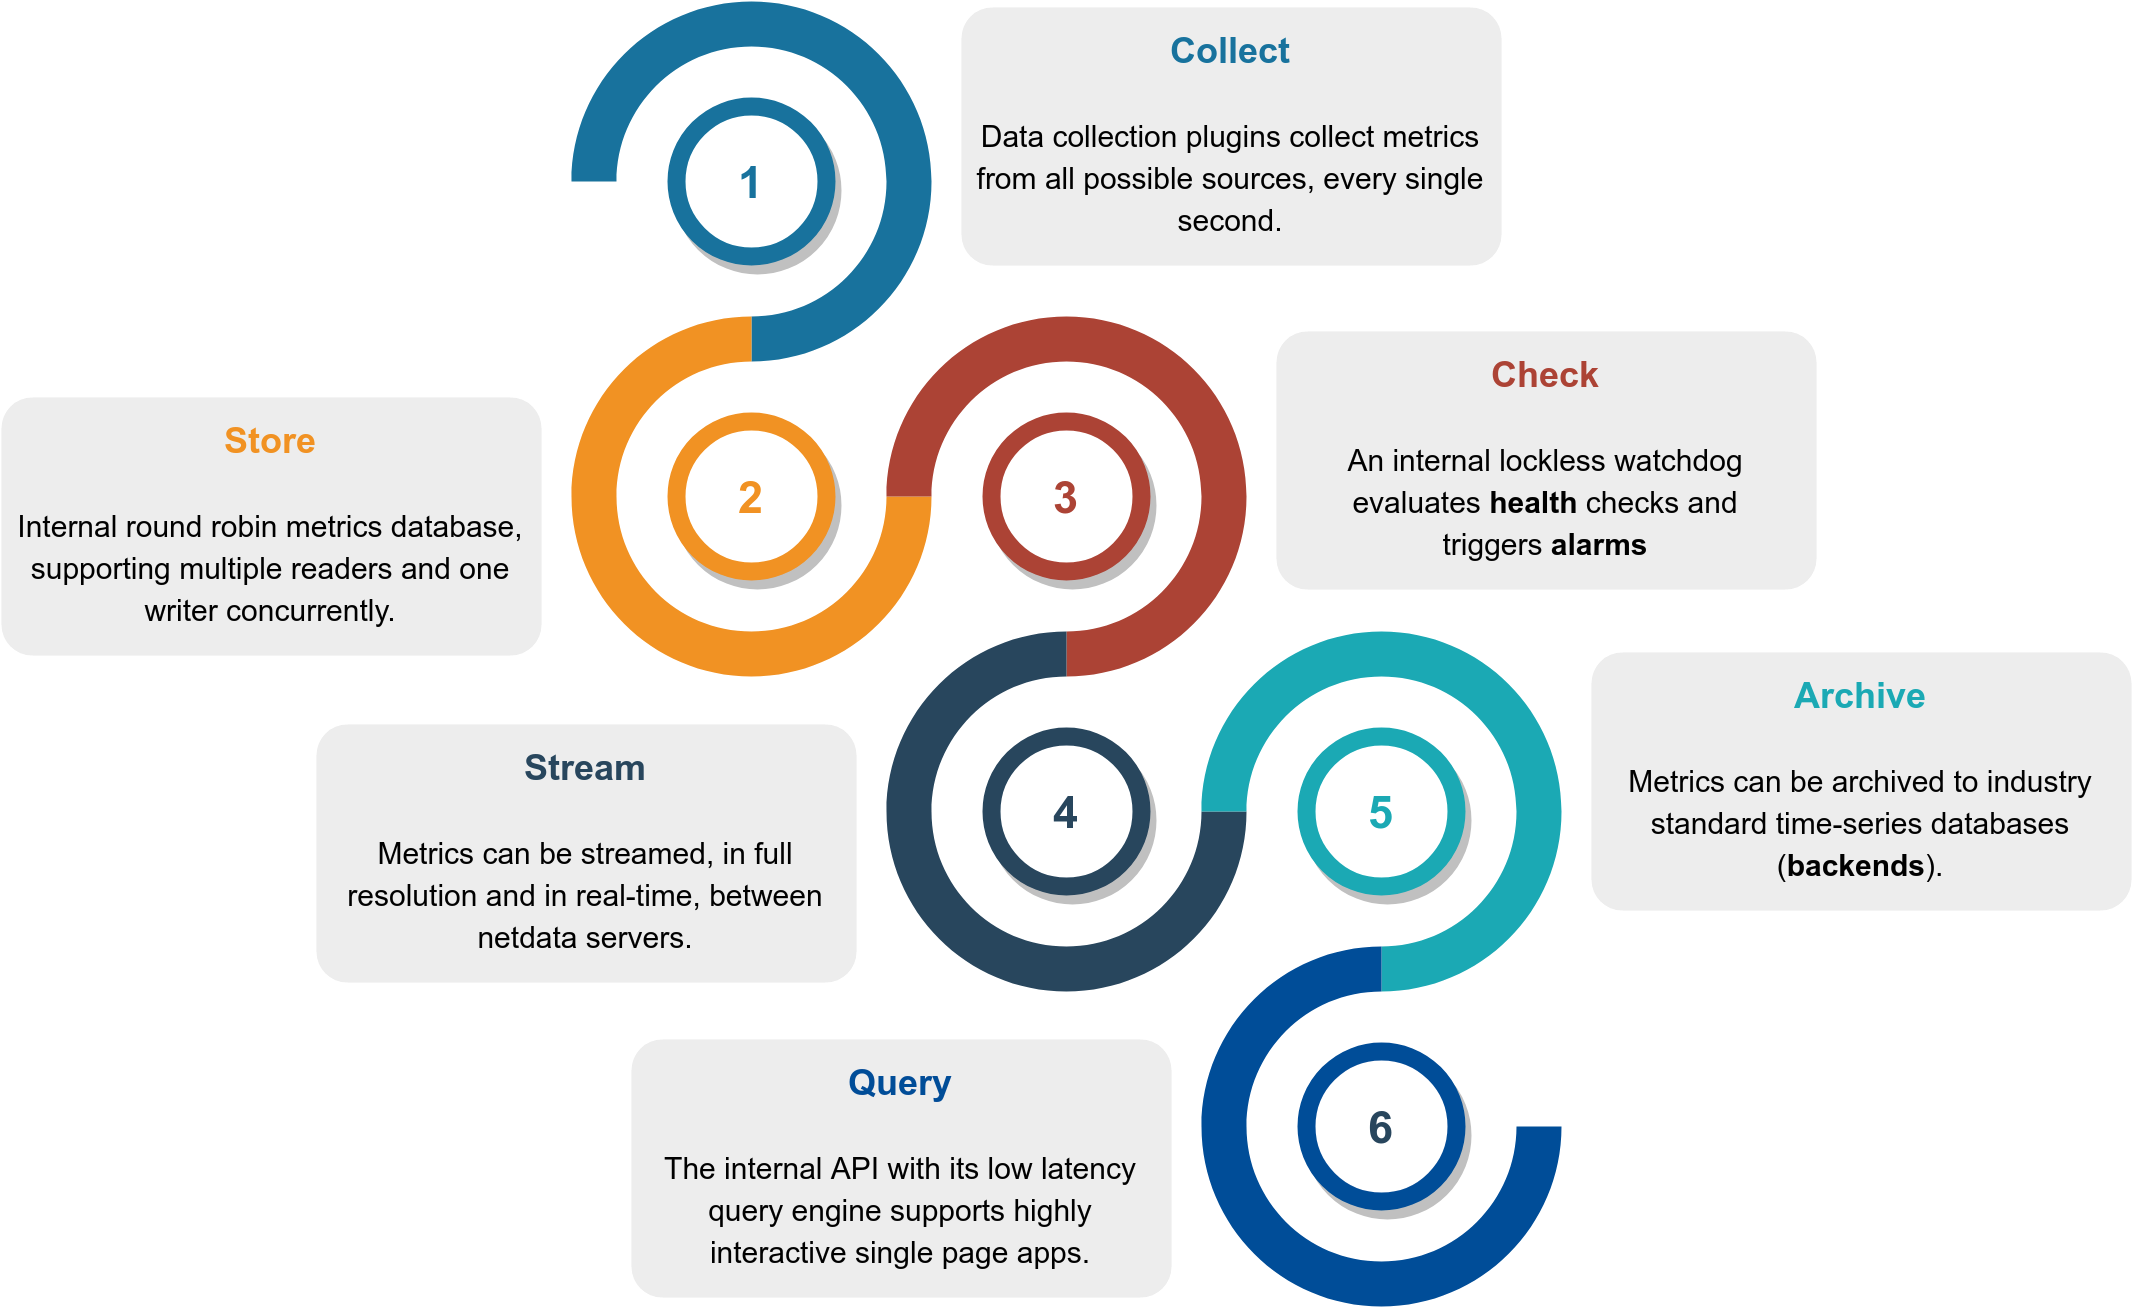
This is how it works:
| Function | Description | Documentation |
|---|---|---|
| Collect | Multiple independent data collection workers are collecting metrics from their sources using the optimal protocol for each application and push the metrics to the database. Each data collection worker has lockless write access to the metrics it collects. | collectors |
| Store | Metrics are first stored in RAM in a custom database engine that then "spills" historical metrics to disk for efficient long-term metrics storage. | database |
| Check | A lockless independent watchdog is evaluating health checks on the collected metrics, triggers alarms, maintains a health transaction log and dispatches alarm notifications. | health |
| Stream | A lockless independent worker is streaming metrics, in full detail and in real-time, to remote Netdata servers, as soon as they are collected. | streaming |
| Archive | A lockless independent worker is down-sampling the metrics and pushes them to backend time-series databases. | exporting |
| Query | Multiple independent workers are attached to the internal web server, servicing API requests, including data queries. | web/api |
The result is a highly efficient, low-latency system, supporting multiple readers and one writer on each metric.
Infographic
This is a high level overview of Netdata feature set and architecture. Click it to to interact with it (it has direct links to our documentation).

Features
This is what you should expect from Netdata:
General
- 1s granularity - The highest possible resolution for all metrics.
- Unlimited metrics - Netdata collects all the available metrics—the more, the better.
- 1% CPU utilization of a single core - It's unbelievably optimized.
- A few MB of RAM - The highly-efficient database engine stores per-second metrics in RAM and then "spills" historical metrics to disk long-term storage.
- Minimal disk I/O - While running, Netdata only writes historical metrics and reads
errorandaccesslogs. - Zero configuration - Netdata auto-detects everything, and can collect up to 10,000 metrics per server out of the box.
- Zero maintenance - You just run it. Netdata does the rest.
- Zero dependencies - Netdata runs a custom web server for its static web files and its web API (though its plugins may require additional libraries, depending on the applications monitored).
- Scales to infinity - You can install it on all your servers, containers, VMs, and IoT devices. Metrics are not centralized by default, so there is no limit.
- Several operating modes - Autonomous host monitoring (the default), headless data collector, forwarding proxy, store and forward proxy, central multi-host monitoring, in all possible configurations. Each node may have different metrics retention policies and run with or without health monitoring.
Health Monitoring & Alarms
- Sophisticated alerting - Netdata comes with hundreds of alarms out of the box! It supports dynamic thresholds, hysteresis, alarm templates, multiple role-based notification methods, and more.
- Notifications: alerta.io, amazon sns, discordapp.com, email, flock.com, hangouts, irc, kavenegar.com, messagebird.com, pagerduty.com, prowl, pushbullet.com, pushover.net, rocket.chat, slack.com, smstools3, syslog, telegram.org, twilio.com, web and custom notifications.
Integrations
- Time-series databases - Netdata can archive its metrics to Graphite, OpenTSDB, Prometheus, AWS Kinesis, MongoDB, JSON document DBs, in the same or lower resolution (lower: to prevent it from congesting these servers due to the amount of data collected). Netdata also supports Prometheus remote write API, which allows storing metrics to Elasticsearch, Gnocchi, InfluxDB, Kafka, PostgreSQL/TimescaleDB, Splunk, VictoriaMetrics and a lot of other storage providers.
Visualization
- Stunning interactive dashboards - Our dashboard is mouse-, touchpad-, and touch-screen friendly in 2 themes:
slate(dark) andwhite. - Amazingly fast visualization - Even on low-end hardware, the dashboard responds to all queries in less than 1 ms per metric.
- Visual anomaly detection - Our UI/UX emphasizes the relationships between charts so you can better detect anomalies visually.
- Embeddable - Charts can be embedded on your web pages, wikis and blogs. You can even use Atlassian's Confluence as a monitoring dashboard.
- Customizable - You can build custom dashboards using simple HTML. No JavaScript needed!
Positive and negative values
To improve clarity on charts, Netdata dashboards present positive values for metrics representing read, input,
inbound, received and negative values for metrics representing write, output, outbound, sent.
Netdata charts showing the bandwidth and packets of a network interface. received is positive and sent is
negative.
Autoscaled y-axis
Netdata charts automatically zoom vertically, to visualize the variation of each metric within the visible time-frame.
A zero-based stacked chart, automatically switches to an auto-scaled area chart when a single dimension is
selected.
Charts are synchronized
Charts on Netdata dashboards are synchronized to each other. There is no master chart. Any chart can be panned or zoomed at any time, and all other charts will follow.

Charts are panned by dragging them with the mouse. Charts can be zoomed in/out withSHIFT + mouse wheel while the
mouse pointer is over a chart.
Highlighted time-frame
To improve visual anomaly detection across charts, the user can highlight a time-frame (by pressing Alt + mouse selection) on all charts.
A highlighted time-frame can be given by pressing Alt + mouse selection on any chart. Netdata will highlight the
same range on all charts.
What Netdata monitors
Netdata can collect metrics from 200+ popular services and applications, on top of dozens of system-related metrics jocs, such as CPU, memory, disks, filesystems, networking, and more. We call these collectors, and they're managed by plugins, which support a variety of programming languages, including Go and Python.
Popular collectors include Nginx, Apache, MySQL, statsd, cgroups (containers, Docker, Kubernetes,
LXC, and more), Traefik, web server access.log files, and much more.
See the full list of supported collectors.
Netdata's data collection is extensible, which means you can monitor anything you can get a metric for. You can even write a collector for your custom application using our plugin API.
Documentation
The Netdata documentation is at https://docs.netdata.cloud, but you can also find each page inside of Netdata's
repository itself in Markdown (.md) files. You can find all our documentation by navigating the repository.
Here is a quick list of notable documents:
| Directory | Description |
|---|---|
installer |
Instructions to install Netdata on your systems. |
docker |
Instructions to install Netdata using docker. |
daemon |
Information about the Netdata daemon and its configuration. |
collectors |
Information about data collection plugins. |
health |
How Netdata's health monitoring works, how to create your own alarms and how to configure alarm notification methods. |
streaming |
How to build hierarchies of Netdata servers, by streaming metrics between them. |
exporting |
Long term archiving of metrics to industry-standard time-series databases, like prometheus, graphite, opentsdb. |
web/api |
Learn how to query the Netdata API and the queries it supports. |
web/api/badges |
Learn how to generate badges (SVG images) from live data. |
web/gui/custom |
Learn how to create custom Netdata dashboards. |
web/gui/confluence |
Learn how to create Netdata dashboards on Atlassian's Confluence. |
You can also check all the other directories. Most of them have plenty of documentation.
Community
We welcome contributions. Feel free to join the team!
To report bugs or get help, use GitHub's issues.
You can also find Netdata on:
License
Netdata is GPLv3+.
Netdata re-distributes other open-source tools and libraries. Please check the third party licenses.
Is it any good?
Yes.
When people first hear about a new product, they frequently ask if it is any good. A Hacker News user remarked:
Note to self: Starting immediately, all raganwald projects will have a “Is it any good?” section in the readme, and the answer shall be “yes.".
So, we follow the tradition...
Is it awesome?
These people seem to like it.