This version assumes that enp3s0f1 is upload, and enx000ec688fc5c is download. To change these, start at line 94 in /src/digitaldivideutil.py Setup guide:
git clone https://github.com/ServePeak/digitaldivide
cd digitaldivide
bash util/install.sh
To automatically setup a household, run
bash util/emulate_house.sh
This can be rerun for each household, as it will clear and setup everything for you
In this experiment, you'll set up a topology on GENI that uses realistic link characteristics, based on measurements from actual US households.
It should take about 60 minutes to run this experiment.
To reproduce this experiment on GENI, you will need an account on the GENI Portal, and you will need to have joined a project. You should have already uploaded your SSH keys to the portal and know how to log in to a node with those keys. If you're not sure if you have those skills, you may want to try Lab Zero first.
- Skip to Results
- Skip to Run my experiment
There exists a digital divide between web developers and internet users in the United States. Some households do not have high-speed Internet avavilable in their area, or cannot pay for high-speed Internet. As a result, there is a lot of variation in Internet speed across households in the US. We see this in the image below, which shows the relative frequency of different download speeds of US households sampled by the FCC as part of the Measuring Broadband America program [1].

Meanwhile, web developers and researchers usually have top-notch internet connections. This disparity is a "digital divide" that creates an "empathy gap" between the developers/researchers and ordinary users.
Internet researchers and developers mainly use high-speed home or university Internet connections to test new ideas, or they use dedicated infrastructure called "testbeds" that have good quality links. Sometimes they use a single device, or a small sample of machines to run tests, but these tests are done directly connected to university networks, which have much better speeds than most home users.
Alternatively, researchers may use a platform called GENI [2] to test developments on dedicated research infrastructure. When using GENI, reseachers use a web-based interface in which virtual machines (VMs) can be dragged onto the canvas area, and connected by links. These virtual machines and links are then reserved at one of a set of server racks at universities across the US, and researchers can log into each of the virtual machines, install networked applications, and use them and measure their performance. However, the default link speed on GENI is 100 megabits per second, which we see in the image above is much higher than most US households' download speed. Also, default latency and packet loss on GENI is minimal, which is not at all similar to real household network connections.
Characteristics such as download speed, upload speed, latency, jitter, and packet loss, can be changed on GENI. However, many researchers do not change these to something more realistic. If researchers do not deliberately change characteristics of the link to match their target users' network characteristics, the network that they test on will not accurately represent real households.
When developers and researchers do not test their ideas on a variety of realistic networks, their advancements may not work as intended for the millions of Americans who have different Internet speeds. Companies like Facebook recognize the importance of this. Facebook instituted a program called "2G Tuesdays" where employees have the option of using low-quality Internet speeds similar to that of the developing world, in order to get a better understanding of how people with worse internet speeds experience their applications [3]. Testing on realistic networks actually had a big impact on the Facebook team, and they have said that it led them to change the way parts of the Messenger app work to better support users in emerging markets [4].
Our goal was to make it easy for researchers to use more realistic networks on GENI. With more realistic networks to test on, researchers should be able to make advancements that have a better impact on more US households' internet. Our result is a Python script that looks up representative network information in a data set of real home Internet measurements, and produces an output file that researchers can then use to test their networking ideas on a link that emulates that specific home.
We used a dataset of measurements from the Measuring Broadband America program [1]. This is a program by the FCC to gather information on the Internet quality of US households. Volunteer panelists get a wireless router through which they connect to the Internet using their regular Internet plan provided by their own Internet service provider (ISP). The router automatically runs network tests every hour and reports measurements back to the FCC. The panelists have a range of Internet service plans, of different types (cable, satellite, fiber, DSL), from different ISPs, and paying different prices for different upload and download speeds. They also come from different locations around the US. Potential panelists are selected so that the measurements give information about all the different kinds of Internet service plans available in the US. We linked this data to a dataset called the Urban Rate Survey [6], which gives information about the price of service for a plan with a given upload and download rate, in a particular urban area, from a specific ISP.
The tool we created is a Python script that samples a random household from this dataset, and finds the measurements of that household's Internet connection in the data set. Researchers using our tool can also specify as input the state, price range, and/or technology so as to limit their outputs to households that represent a target group. For example, if a researcher is trying to make an application specifically for lower income communities, then the researcher would most likely search for a household paying a low price. The map below shows examples of households across the United States, paying different prices, with different ISPs, and in states with different average Internet speed, as a demonstration of the range of households researchers can emulate in their tests:

Once an actual household is selected from the dataset, the information from the household can be used in two ways. Our code generates a "resource specification" (RSpec) file that can be used directly to create a small network on GENI. In the network, one VM represents the user, and the other represents the server (as shown in the image below). The link between the user and the server has the same qualities - upload speed, download speed, latency, jitter, and packet loss - as the selected household. The researchers can then log in to the VMs and run experiments over that link, which represents a real US household.
Our tool also generates a profile that can be used in Augmented Traffic Control (ATC), which is a technology developed by Facbeook that supports programs like "2G Tuesdays". With ATC, a researcher tunnels the network traffic from their own laptop or phone through a link on GENI, and browses the Internet or use apps through that link [5]. Using a browser-based UI (shown in the image below), researchers can make that link through which their traffic travels have specific characteristics. Our tool generates an ATC profile that can be applied to the tunneled traffic, so that it has the qualities of the sampled US household.
Depending on how much control they need to have over the network and the endpoints, researchers may prefer one solution or the other. Because there are no outside factors involved, the first approach using links and end hosts only on GENI allows researchers to test advancements in a very controlled environment. The second method includes outside influences, since in addition to going through the GENI link the traffic also goes over the regular Internet. Also, researchers do not have total control over the end hosts. But, with ATC you can use graphical applications, like a regular web browser, and you can also include external factors like load on the target server.
We hope that the GENI network and the internet profile our tool generates will have an impact on researchers. If a new advancement is tested on multiple households, researchers will get a better idea whether or not their application works under different circumstances. Our ultimate goal is for this tool to help researchers design more effective developements for everybody.
Here are some sample results from a particular household, with ID 13451.
When we run
python src/digitaldivideutil.py --houseid 13451 --rspec --json
we see the following expected link characteristics:
Selected household 13451 has the following characteristics:
Plan: 25/25 (Mbps down/up), Verizon NY
Estimated price per month: $74.99
--------------------------------------------------------
 Upload rate (kbps)    | 26087
 Download rate (kbps)  | 30245
 Round-trip delay (ms) | 10.620467
 Uplink jitter (ms)    | 3.290144
 Downlink jitter (ms)  | 1.192400
 Packet loss (%)       | 0.045928
--------------------------------------------------------
JSON for Augmented Traffic Control written to /tmp/digitaldivide/house-13451.json
Rspec written to /tmp/digitaldivide/houses.xml
When we reserve the topology in the "houses.xml" file on GENI, we find that the link speeds are approximately 26 Mbps up and 30 Mbps down, as expected:
ffund01@house-13451:~$ iperf -c server -w 400k -t 30 -i 2 -r
------------------------------------------------------------
Server listening on TCP port 5001
TCP window size:  416 KByte (WARNING: requested  400 KByte)
------------------------------------------------------------
------------------------------------------------------------
Client connecting to server, TCP port 5001
TCP window size:  416 KByte (WARNING: requested  400 KByte)
------------------------------------------------------------
[  3] local 10.0.0.1 port 48922 connected with 10.0.0.2 port 5001
[ ID] Interval       Transfer     Bandwidth
[  3]  0.0- 2.0 sec  6.25 MBytes  26.2 Mbits/sec
[  3]  2.0- 4.0 sec  6.00 MBytes  25.2 Mbits/sec
[  3]  4.0- 6.0 sec  5.88 MBytes  24.6 Mbits/sec
[  3]  6.0- 8.0 sec  6.00 MBytes  25.2 Mbits/sec
[  3]  8.0-10.0 sec  6.00 MBytes  25.2 Mbits/sec
[  3] 10.0-12.0 sec  5.88 MBytes  24.6 Mbits/sec
[  3] 12.0-14.0 sec  5.88 MBytes  24.6 Mbits/sec
[  3] 14.0-16.0 sec  6.00 MBytes  25.2 Mbits/sec
[  3] 16.0-18.0 sec  6.00 MBytes  25.2 Mbits/sec
[  3] 18.0-20.0 sec  5.62 MBytes  23.6 Mbits/sec
[  3] 20.0-22.0 sec  6.00 MBytes  25.2 Mbits/sec
[  3] 22.0-24.0 sec  5.88 MBytes  24.6 Mbits/sec
[  3] 24.0-26.0 sec  6.00 MBytes  25.2 Mbits/sec
[  3] 26.0-28.0 sec  5.88 MBytes  24.6 Mbits/sec
[  3] 28.0-30.0 sec  6.00 MBytes  25.2 Mbits/sec
[  3]  0.0-30.1 sec  89.4 MBytes  24.9 Mbits/sec
[  5] local 10.0.0.1 port 5001 connected with 10.0.0.2 port 58396
[  5]  0.0- 2.0 sec  6.77 MBytes  28.4 Mbits/sec
[  5]  2.0- 4.0 sec  6.86 MBytes  28.8 Mbits/sec
[  5]  4.0- 6.0 sec  6.90 MBytes  29.0 Mbits/sec
[  5]  6.0- 8.0 sec  6.83 MBytes  28.7 Mbits/sec
[  5]  8.0-10.0 sec  6.90 MBytes  29.0 Mbits/sec
[  5] 10.0-12.0 sec  6.80 MBytes  28.5 Mbits/sec
[  5] 12.0-14.0 sec  5.77 MBytes  24.2 Mbits/sec
[  5] 14.0-16.0 sec  6.36 MBytes  26.7 Mbits/sec
[  5] 16.0-18.0 sec  6.90 MBytes  28.9 Mbits/sec
[  5] 18.0-20.0 sec  6.86 MBytes  28.8 Mbits/sec
[  5] 20.0-22.0 sec  6.88 MBytes  28.9 Mbits/sec
[  5] 22.0-24.0 sec  6.87 MBytes  28.8 Mbits/sec
[  5] 24.0-26.0 sec  6.82 MBytes  28.6 Mbits/sec
[  5] 26.0-28.0 sec  6.50 MBytes  27.2 Mbits/sec
[  5] 28.0-30.0 sec  6.92 MBytes  29.0 Mbits/sec
[  5]  0.0-30.2 sec   101 MBytes  28.2 Mbits/sec
And the round-trip latency is a little over 10 ms, as expected:
ffund01@house-13451:~$ ping server -c 10
PING server-lan0 (10.0.0.2) 56(84) bytes of data.
64 bytes from server-lan0 (10.0.0.2): icmp_seq=1 ttl=64 time=14.0 ms
64 bytes from server-lan0 (10.0.0.2): icmp_seq=2 ttl=64 time=12.1 ms
64 bytes from server-lan0 (10.0.0.2): icmp_seq=3 ttl=64 time=10.4 ms
64 bytes from server-lan0 (10.0.0.2): icmp_seq=4 ttl=64 time=9.59 ms
64 bytes from server-lan0 (10.0.0.2): icmp_seq=5 ttl=64 time=12.0 ms
64 bytes from server-lan0 (10.0.0.2): icmp_seq=6 ttl=64 time=8.64 ms
64 bytes from server-lan0 (10.0.0.2): icmp_seq=7 ttl=64 time=8.66 ms
64 bytes from server-lan0 (10.0.0.2): icmp_seq=8 ttl=64 time=12.6 ms
64 bytes from server-lan0 (10.0.0.2): icmp_seq=9 ttl=64 time=7.71 ms
64 bytes from server-lan0 (10.0.0.2): icmp_seq=10 ttl=64 time=7.92 ms

--- server-lan0 ping statistics ---
10 packets transmitted, 10 received, 0% packet loss, time 9016ms
rtt min/avg/max/mdev = 7.711/10.378/14.044/2.095 ms
All of the materials needed are in the digitaldivide repository on GitHub.
To run our Python script, you will need some prerequisite libraries:
On Ubuntu 14.04, you can download and install the prerequisite software by running the install.sh script in our repository:
wget https://raw.githubusercontent.com/csmithsalzberg/digitaldivide/master/util/install.sh
bash install.sh
(You can reserve a single VM with Ubuntu 14.04 on an InstaGENI aggregate for purposes of running this experiment, and set it up with that script.) Alternatively, if you prefer to run it on your own computer, you can install the prerequisites on other platforms:
- geni-lib installation
- pandas installation. The easiest way to get
pandasmay be to use anaconda.
Once you have installed the prerequisites, you should clone our repository, and navigate to its root directory:
git clone https://github.com/csmithsalzberg/digitaldivide
cd digitaldivide
Then, run our script with
python src/digitaldivideutil.py
The output should look something like this:
Selected household 619842 has the following characteristics:
Plan: 5/1 (Mbps down/up), Hughes OK
--------------------------------------------------------
 Upload rate (kbps)    | 1852
 Download rate (kbps)  | 14127
 Round-trip delay (ms) | 1041.867972
 Uplink jitter (ms)    | 332.884326
 Downlink jitter (ms)  | 17.932186
 Packet loss (%)       | 0.138555
--------------------------------------------------------
To create an output file - an RSpec (XML file), or an ATC profile (JSON file) for each sampled household - you can run it with an argument that specifies the output type you would like, e.g.
python src/digitaldivideutil.py --rspec
or
python src/digitaldivideutil.py --json
If you would like to focus on a particular target demographic, you can filter by state, technology, or price range. Use
python src/digitaldivideutil.py --help
to get usage information.
For example, to get a link representative of a household with satellite Internet service, you could run:
python src/digitaldivideutil.py --technology SATELLITE
or, to get a link representative of a household in NY state with satellite Internet service, you could run:
python src/digitaldivideutil.py --technology SATELLITE --state NY
To get a link representative of a household that pays $30-40 per month for DSL service, you could run:
python src/digitaldivideutil.py --technology DSL --price 30-40
You can also request a topology with an arbitrary number of users ("houses"); for example, to get two houses, run
python src/digitaldivideutil.py --users 2
To use the RSpec (XML file) generated by our tool, create a new slice in the GENI Portal. Click "Add Resources".
You can load the RSpec in either of two ways:
- In the "Choose RSpec" section, select "File", upload the XML file, and click "Select".
- In the "Choose RSpec" section, select "Text Box". Put the contents of the XML file into the textbox and click "Select".
The canvas should now show a server node and one or more "house" nodes (depending on the number of users you requested), like this:
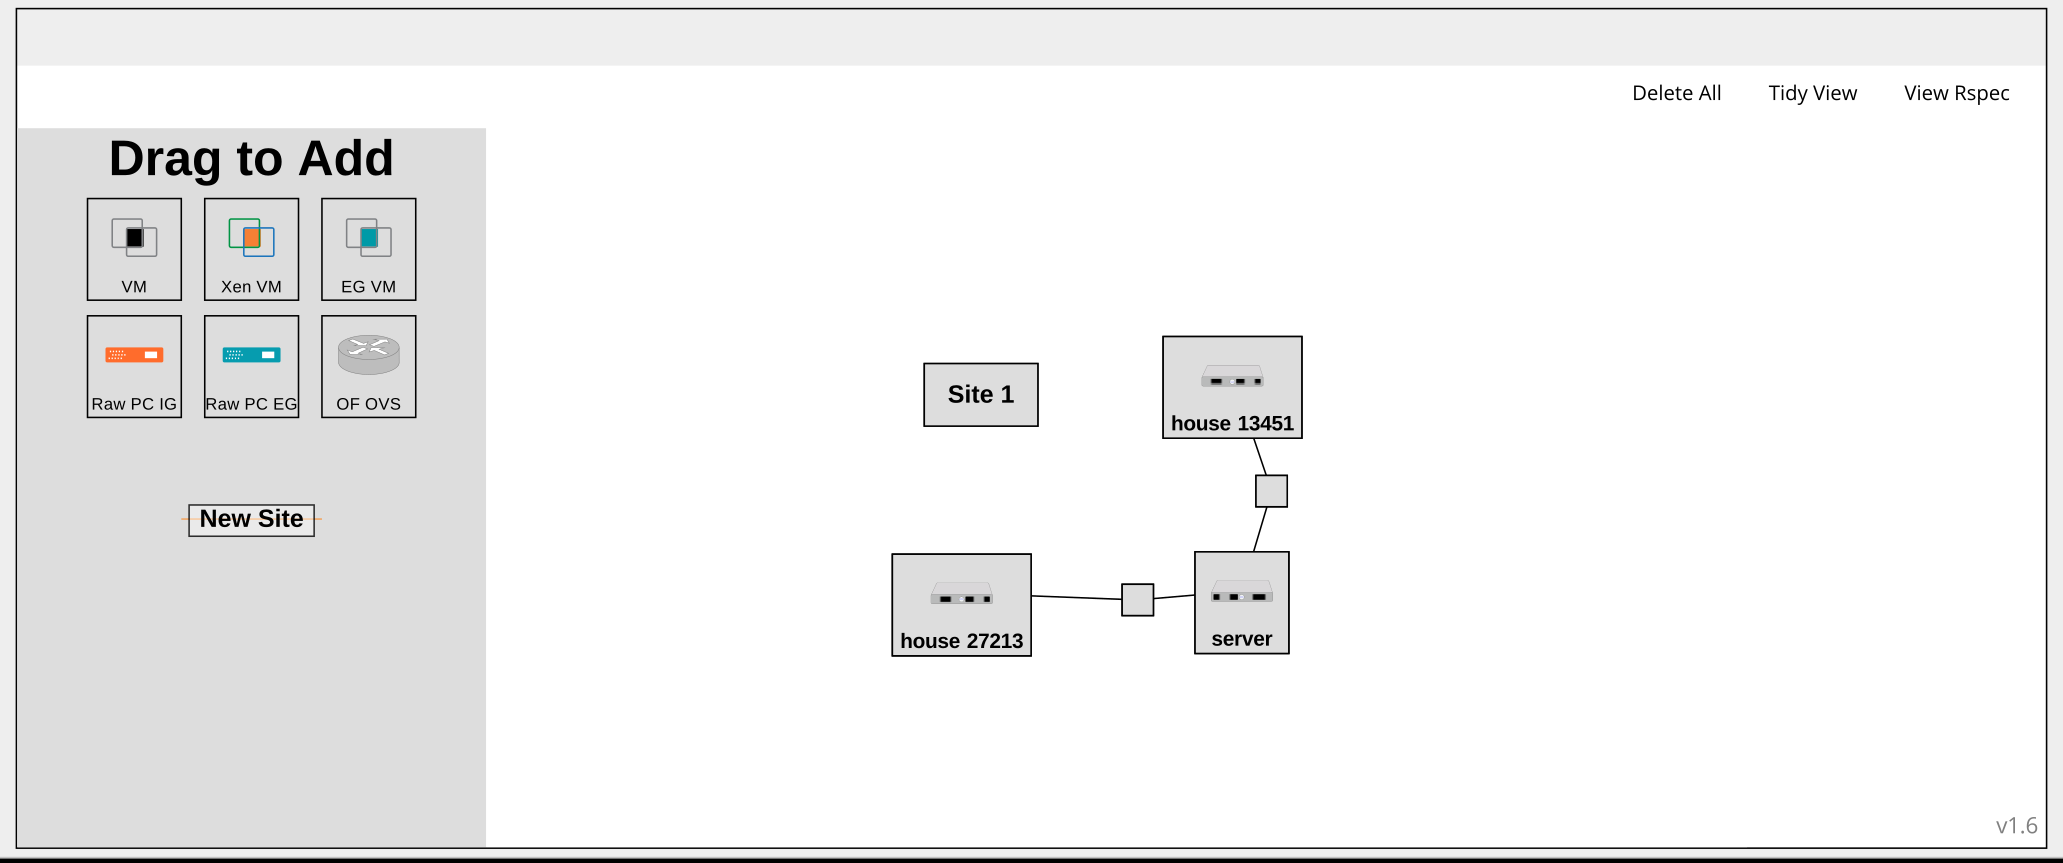
Click on "Site 1" and choose an InstaGENI site to bind to. Then click "Reserve Resources". Wait until your nodes are ready to log in, then log into each of the nodes using SSH.
After your nodes boot up, you may still need to wait a couple of minutes for the postboot commands to finish running. These commands use netem to emulate the desired link characteristics. To verify that the netem commands have been applied, run
tc qdisc show
You should see netem and tbf rules on all interfaces except for the control interface (typically eth0), like this:
qdisc pfifo_fast 0: dev eth0 root refcnt 2 bands 3 priomap  1 2 2 2 1 2 0 0 1 1 1 1 1 1 1 1
qdisc netem 1: dev eth1 root refcnt 2 limit 1000 delay 5.4ms  601us loss 0.048695%
qdisc tbf 10: dev eth1 parent 1:1 rate 42463Kbit burst 99989b lat 94.2s
qdisc netem 1: dev eth2 root refcnt 2 limit 1000 delay 5.3ms  1.2ms loss 0.045928%
qdisc tbf 10: dev eth2 parent 1:1 rate 30245Kbit burst 99993b lat 132.2s
You should validate the link settings to confirm that they have been applied. At any of the "house" nodes, run
ping server
to measure the latency. To validate the link speeds, run
iperf -s -w 400k
on the server, then on the "house" node, run
iperf -c server -w 400k -t 30 -i 5 -r
to measure the throughput in each direction. The first report will be for uplink rate, and the second report will be for downlink rate. You should compare these numbers (and the ping results) to the output of the Python script for the household, and make sure that the link characteristics are approximately the same. (However, note that for houses with high latency, jitter, and packet loss, the measured link speeds will probably be somewhat lower due to the effect of these impairments on TCP.)
To use the ATC profile (JSON file) generated by our tool,follow the instructions in 2G Tuesdays: emulating realistic network conditions in emerging markets to set up ATC. However, before this step:
Finally, we'll set up some prepared network profiles. Open a third connection to "openvpn", and run:
cd ~/augmented-traffic-control/utils/
bash restore-profiles.sh localhost:8000
you should copy the JSON file(s) generated by the script to the ~/augmented-traffic-control/utils/profiles directory on the "openvpn" node (e.g. with scp). Then, proceed with the ATC setup instructions.
When you get up to the part where you open the ATC web UI, you should see your sampled household(s) listed with their house ID (in addition to the built-in profile):
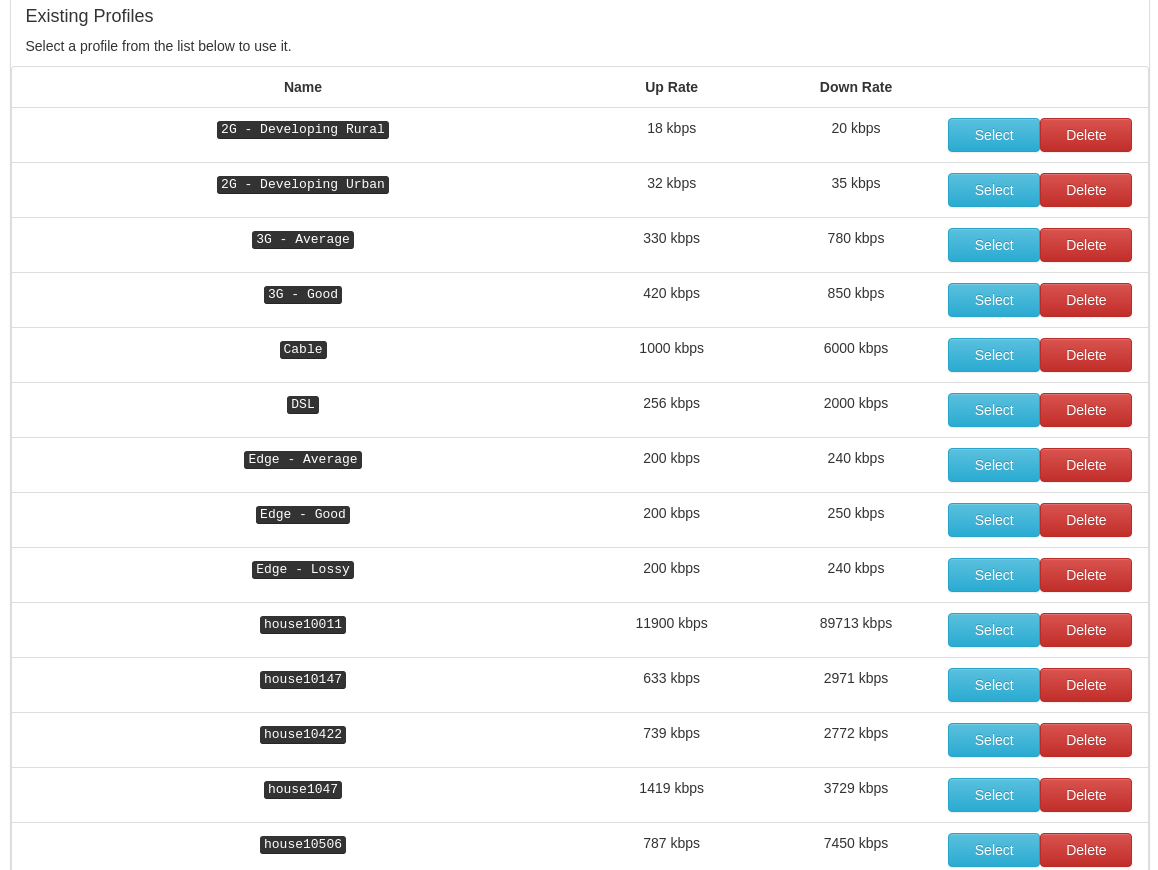
and you can select one of them and apply it to your proxied browser.
Test that you have everything set up correctly by browsing under the provided profiles to check that the internet is being shaped.
When you have finished the experiment, please delete your resources on the GENI Portal to free them for use by other experimenters.
Some caveats:
- The tbf rate limiting may not work well at high data rates. Specifically, it may throttle the link too much.
- Other factors, like latency and packet loss, can affect the measured throughput.
- The data in this repository comes from the 2015 edition of the Measuring Broadband America program, specfiically the validated data set from September 2014, and the Urban Rate Survey for the corresponding year.
[1] "2015 Measuring Broadband America Fixed Report." Federal Communications Commission. 2015. https://www.fcc.gov/reports-research/reports/measuring-broadband-america/measuring-broadband-america-2015
[2] Mark Berman, Jeffrey S. Chase, Lawrence Landweber, Akihiro Nakao, Max Ott, Dipankar Raychaudhuri, Robert Ricci, and Ivan Seskar. "GENI: A federated testbed for innovative network experiments." Computer Networks 61 (2014): 5-23. http://dx.doi.org/10.1016/j.bjp.2013.12.037
[3] Chris Marra. "Building for emerging markets: The story behind 2G Tuesdays." Facebook Code. 27 Oct. 2015. https://code.facebook.com/posts/1556407321275493/building-for-emerging-markets-the-story-behind-2g-tuesdays/
[4] Manu Chantra, John Morrow. "Augmented Traffic Control: A Tool to Simulate Network Conditions." Facebook Code. 23 March 2015. https://code.facebook.com/posts/1561127100804165/augmented-traffic-control-a-tool-to-simulate-network-conditions/
[5] Fraida Fund. "2G Tuesdays: Emulating Realistic Network Conditions in Emerging Markets." Run My Experiment on GENI. Blog. 04 Aug. 2016. https://witestlab.poly.edu/blog/2g-tuesdays-emulating-realistic-network-conditions-in-emerging-markets/
[6] "Urban Rate Survey Data & Resources." Federal Communications Commission. https://www.fcc.gov/general/urban-rate-survey-data-resources