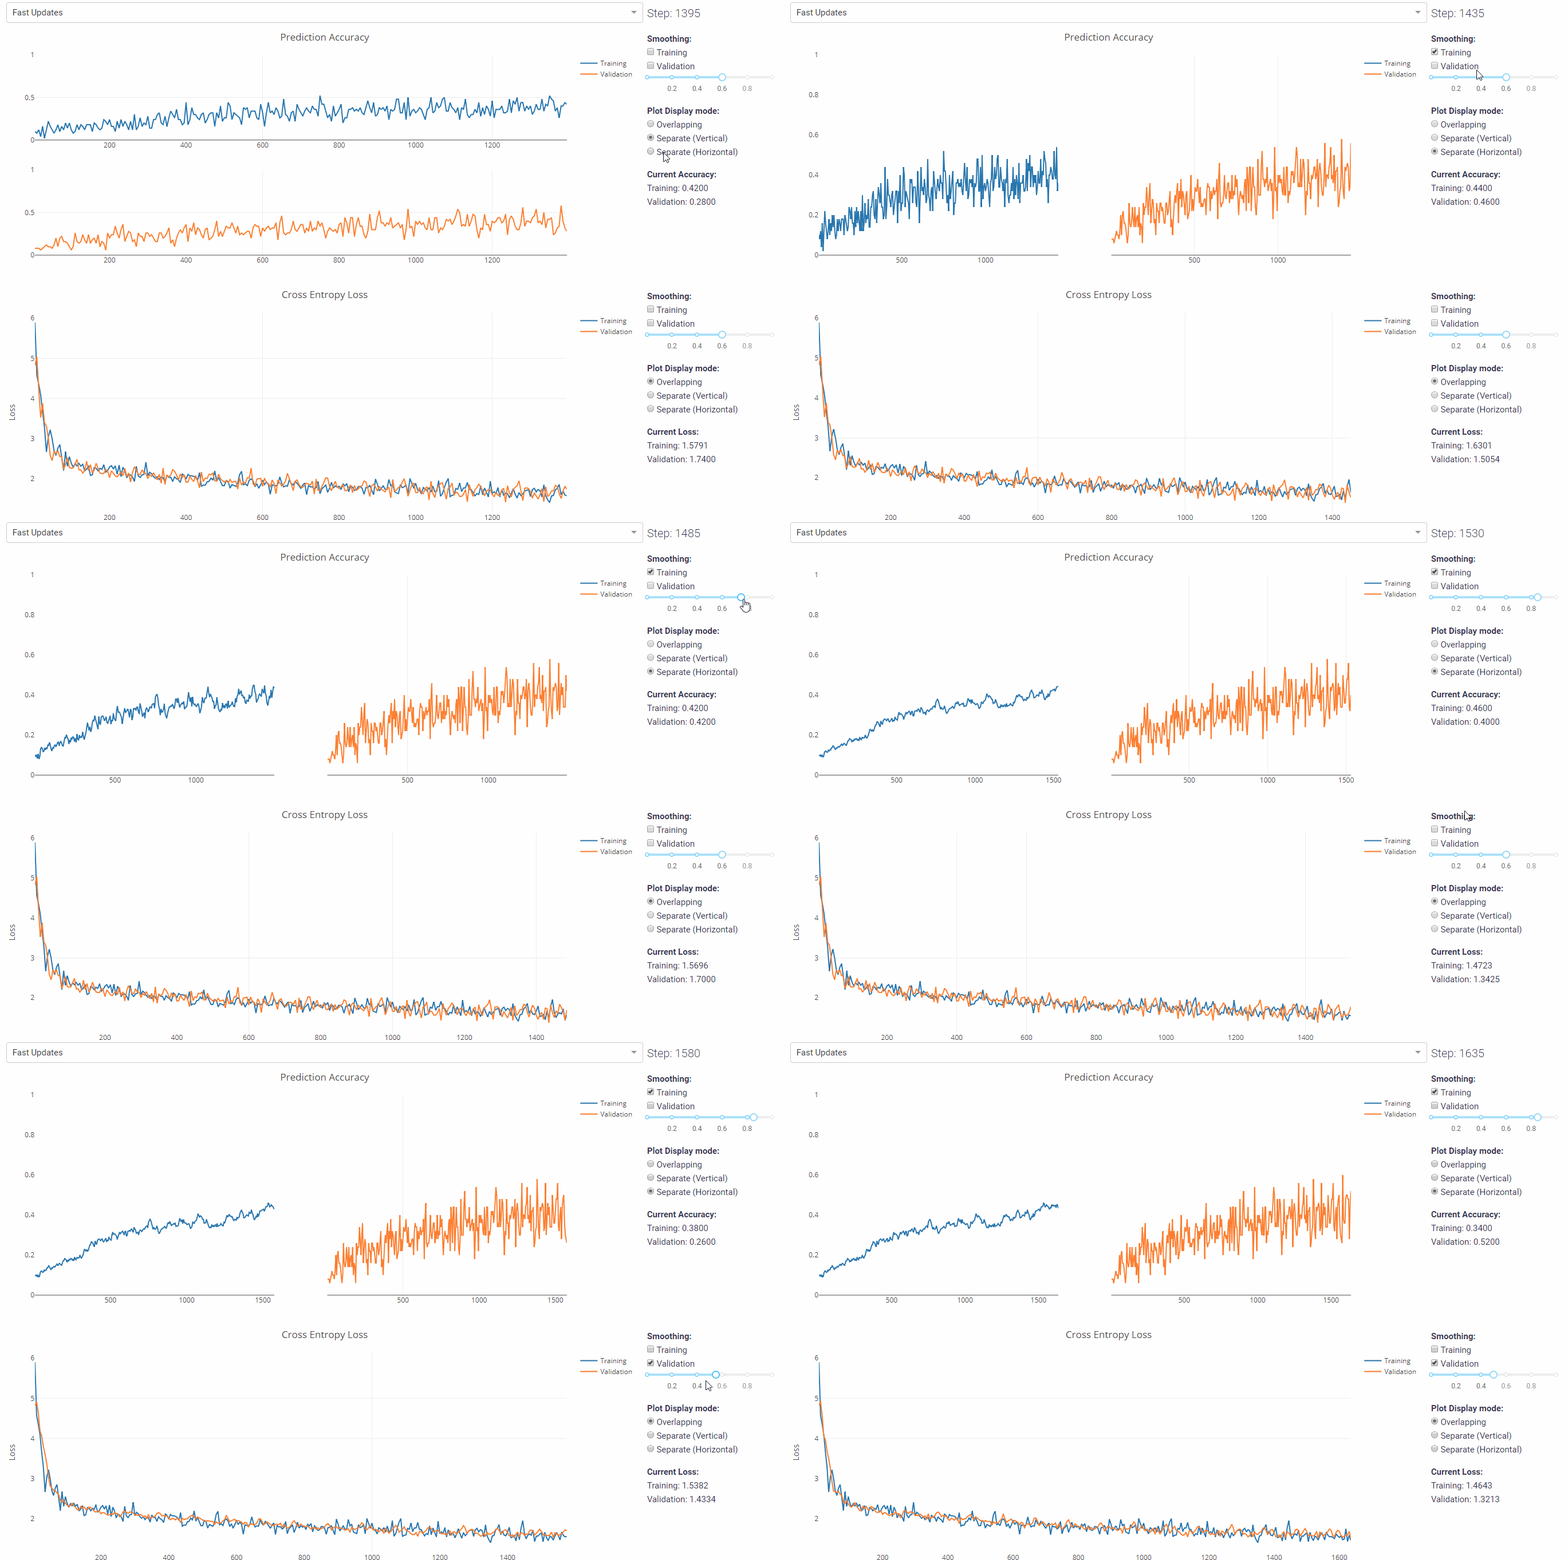
Dash Live Model Training Viewer
This is a demo of the Dash interactive Python framework developed by Plotly.
Dash abstracts away all of the technologies and protocols required to build an interactive web-based application and is a simple and effective way to bind a user interface around your Python code. To learn more check out our documentation.
Try out the demo app here.
Getting Started
Using the demo
To use the demo, simply choose the model and dataset for which you want to replay the training, using the two dropdown menus at the top of the page. For every dataset, we trained a simple 1-layer Neural Network, and a small Convolutional Neural Network that were taken from the official Tensorflow and Keras tutorials.
Running the app locally
First create a virtual environment with conda or venv inside a temp folder, then activate it.
virtualenv dash-live-model-training-venv

# Windows
dash-live-model-training-venv\Scripts\activate
# Or Linux
source venv/bin/activate
Clone the git repo, then install the requirements with pip
git clone https://github.com/plotly/dash-live-model-training.git
cd dash-live-model-training
pip install -r requirements.txt
Run the app
python app.py
How to use the app
The demo app shows how the viewer works by simulating the training process of a few basic models. If you want to use the full app with your own model, follow theses steps:
- Import the helper functions,
add_eval()andwrite_data()fromtfutils.py. - Use
add_eval()to add the accuracy and cross-entropy operations in your tensorflow graph, if they are not already present. It takes as inputy_, the Tensor containing the true target, aka labels, andy, which contains the predicted targets, aka logits. It will return two variables, accuracy and cross_entropy. - Create a feed dictionary (read more about it here) for both your training and validation batch.
- At every step, after running the session once, call
write_data()to write the data in the log file. Use the feed dicts, accuracy and cross_entropy generated in the previous steps as input. If the output log file is renamed, update the LOGFILE variable insideapp.pyas well to reflect the changes. - Run
app.py, and open the given link.
Make sure that you correctly clone the repo with all the required libraries. You also need the latest version of Tensorflow and Sci-kit Learn.
About the app
What does the app do?
For the majority of Deep Learning models, it is extremely helpful to keep track of the accuracy and loss as it is training. At the moment, the best application to do that is Tensorboard, which is a collection of visualization tools (metrics plots, image examples, graph representation, weight histogram, etc.) useful to debug and monitor the training of your model.
Dash's Live Model Training Viewer is a compact visualization app that monitors core metrics of your Tensorflow model during training. It complements the Tensorboard by offering the following:
- Real-time visualization: The app is designed to visualize your metrics as they are updated inside your model.
- Small and Lightweight: The viewer loads a small number of important visualization, so that it loads and runs quickly.
- Simple to use: For simpler tensorflow models, all you need to do is to call
add_evalto add the accuracy and cross entropy operations in the graph, and generate a log of the metrics usingwrite_data. Both functions are insidetfutils.py, and examples are included in theexamplesdirectory. - Easy to modify: The app is stored inside one module, and is written in under 400 lines. You can quickly modify and improve the app without breaking anything.
- Plotly Graphs and Dash Integration: Easily integrate the app into more complex Dash Apps, and includes all the tools found in Plotly graphs.
At the moment, the logging only works for iterative Tensorflow models. We are planning to extend it for PyTorch. You are encouraged to port the logging function (which is a simple csv logging) to Keras, Tensorflow's high-level API, MXNet, etc.
Built With
- Dash - Main server and interactive components
- Plotly Python - Used to create the interactive plots
Contributing
Please read CONTRIBUTING.md for details on our code of conduct, and the process for submitting pull requests to us.
Authors
- Xing Han Lu - Initial Work - @xhlulu
See also the list of contributors who participated in this project.
License
This project is licensed under the MIT License - see the LICENSE.md file for details


