These are my course notes for Understanding and Visualizing Data course 1 from Coursera Statistics with Python specialization.
Starting in July 2019.
Patricia Schuster, University of Michigan
- Week 1 notes
- Where do data come from? organic/process data, designed data collection
- i.i.d.: independent, identically distributed
- Variable types: quantitative (continuous, discrete), categorical (ordinal, nominal)
- Study design: Exploratory vs. confirmatory, comparative vs. non-comparative, observational vs. experiment, power and bias
- Week 2 notes
- Categorical data: tables, bar charts, pie charts
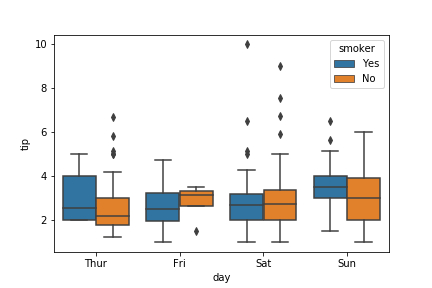
- Quantitative data: histogram, numerical summaries, standard score, box plots
- Tables, histograms, and boxplots in Python
- Examples with the
tips_datadataset fromseaborn
- Week 3 notes
- Multivariate data
- Associations with multivariate quantitative data
- Pizza study design assignment
- Quiz
