Analysis of Airbnb listings
Introduction
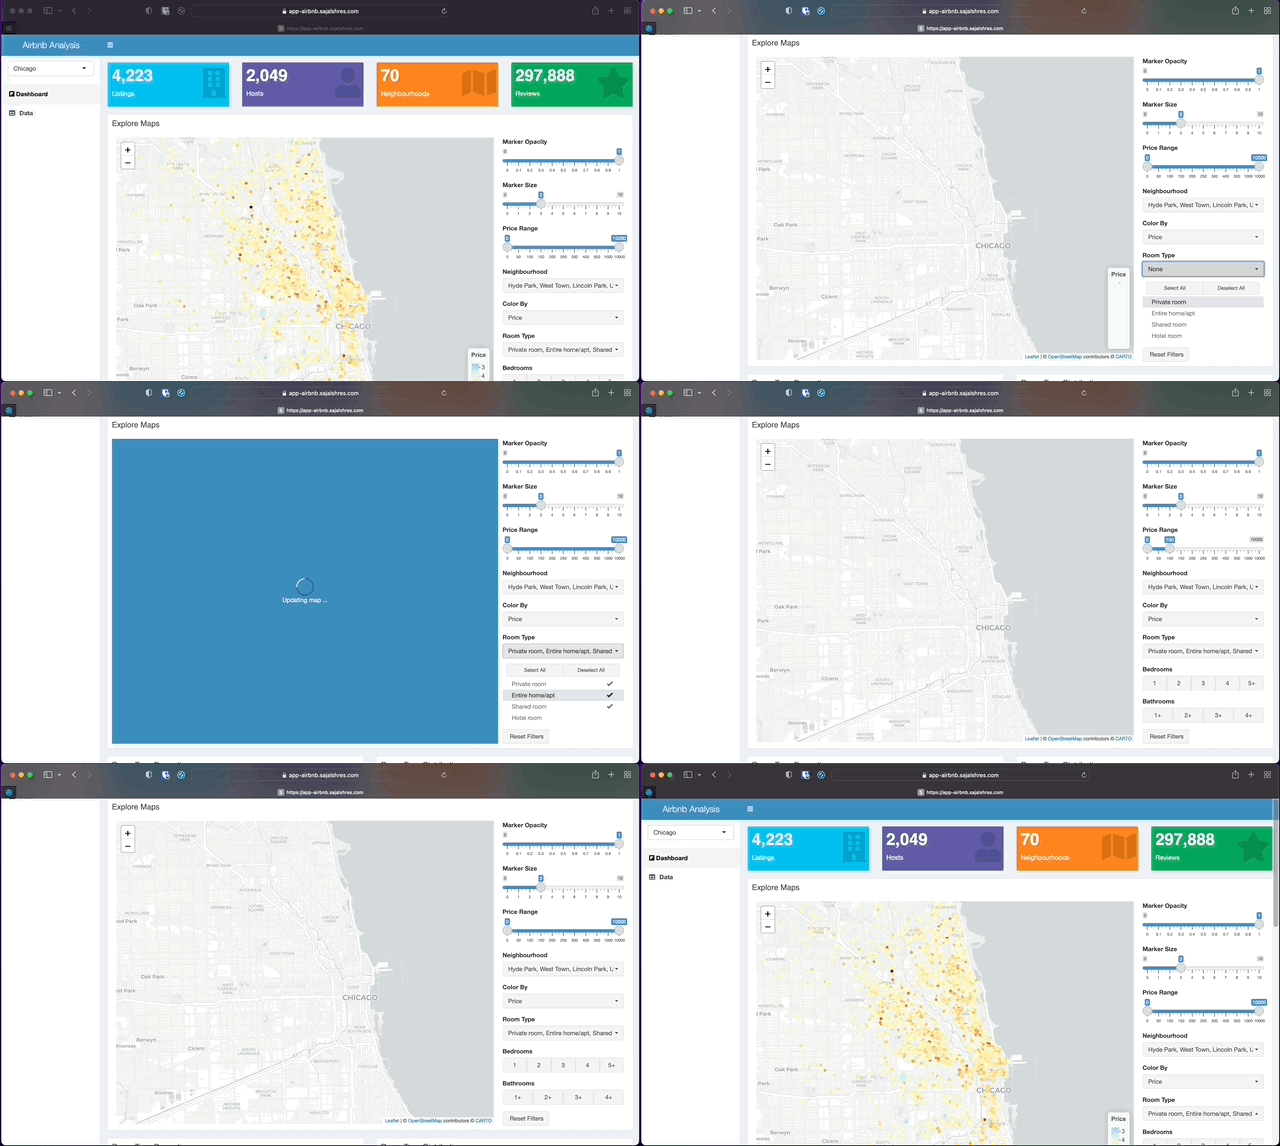
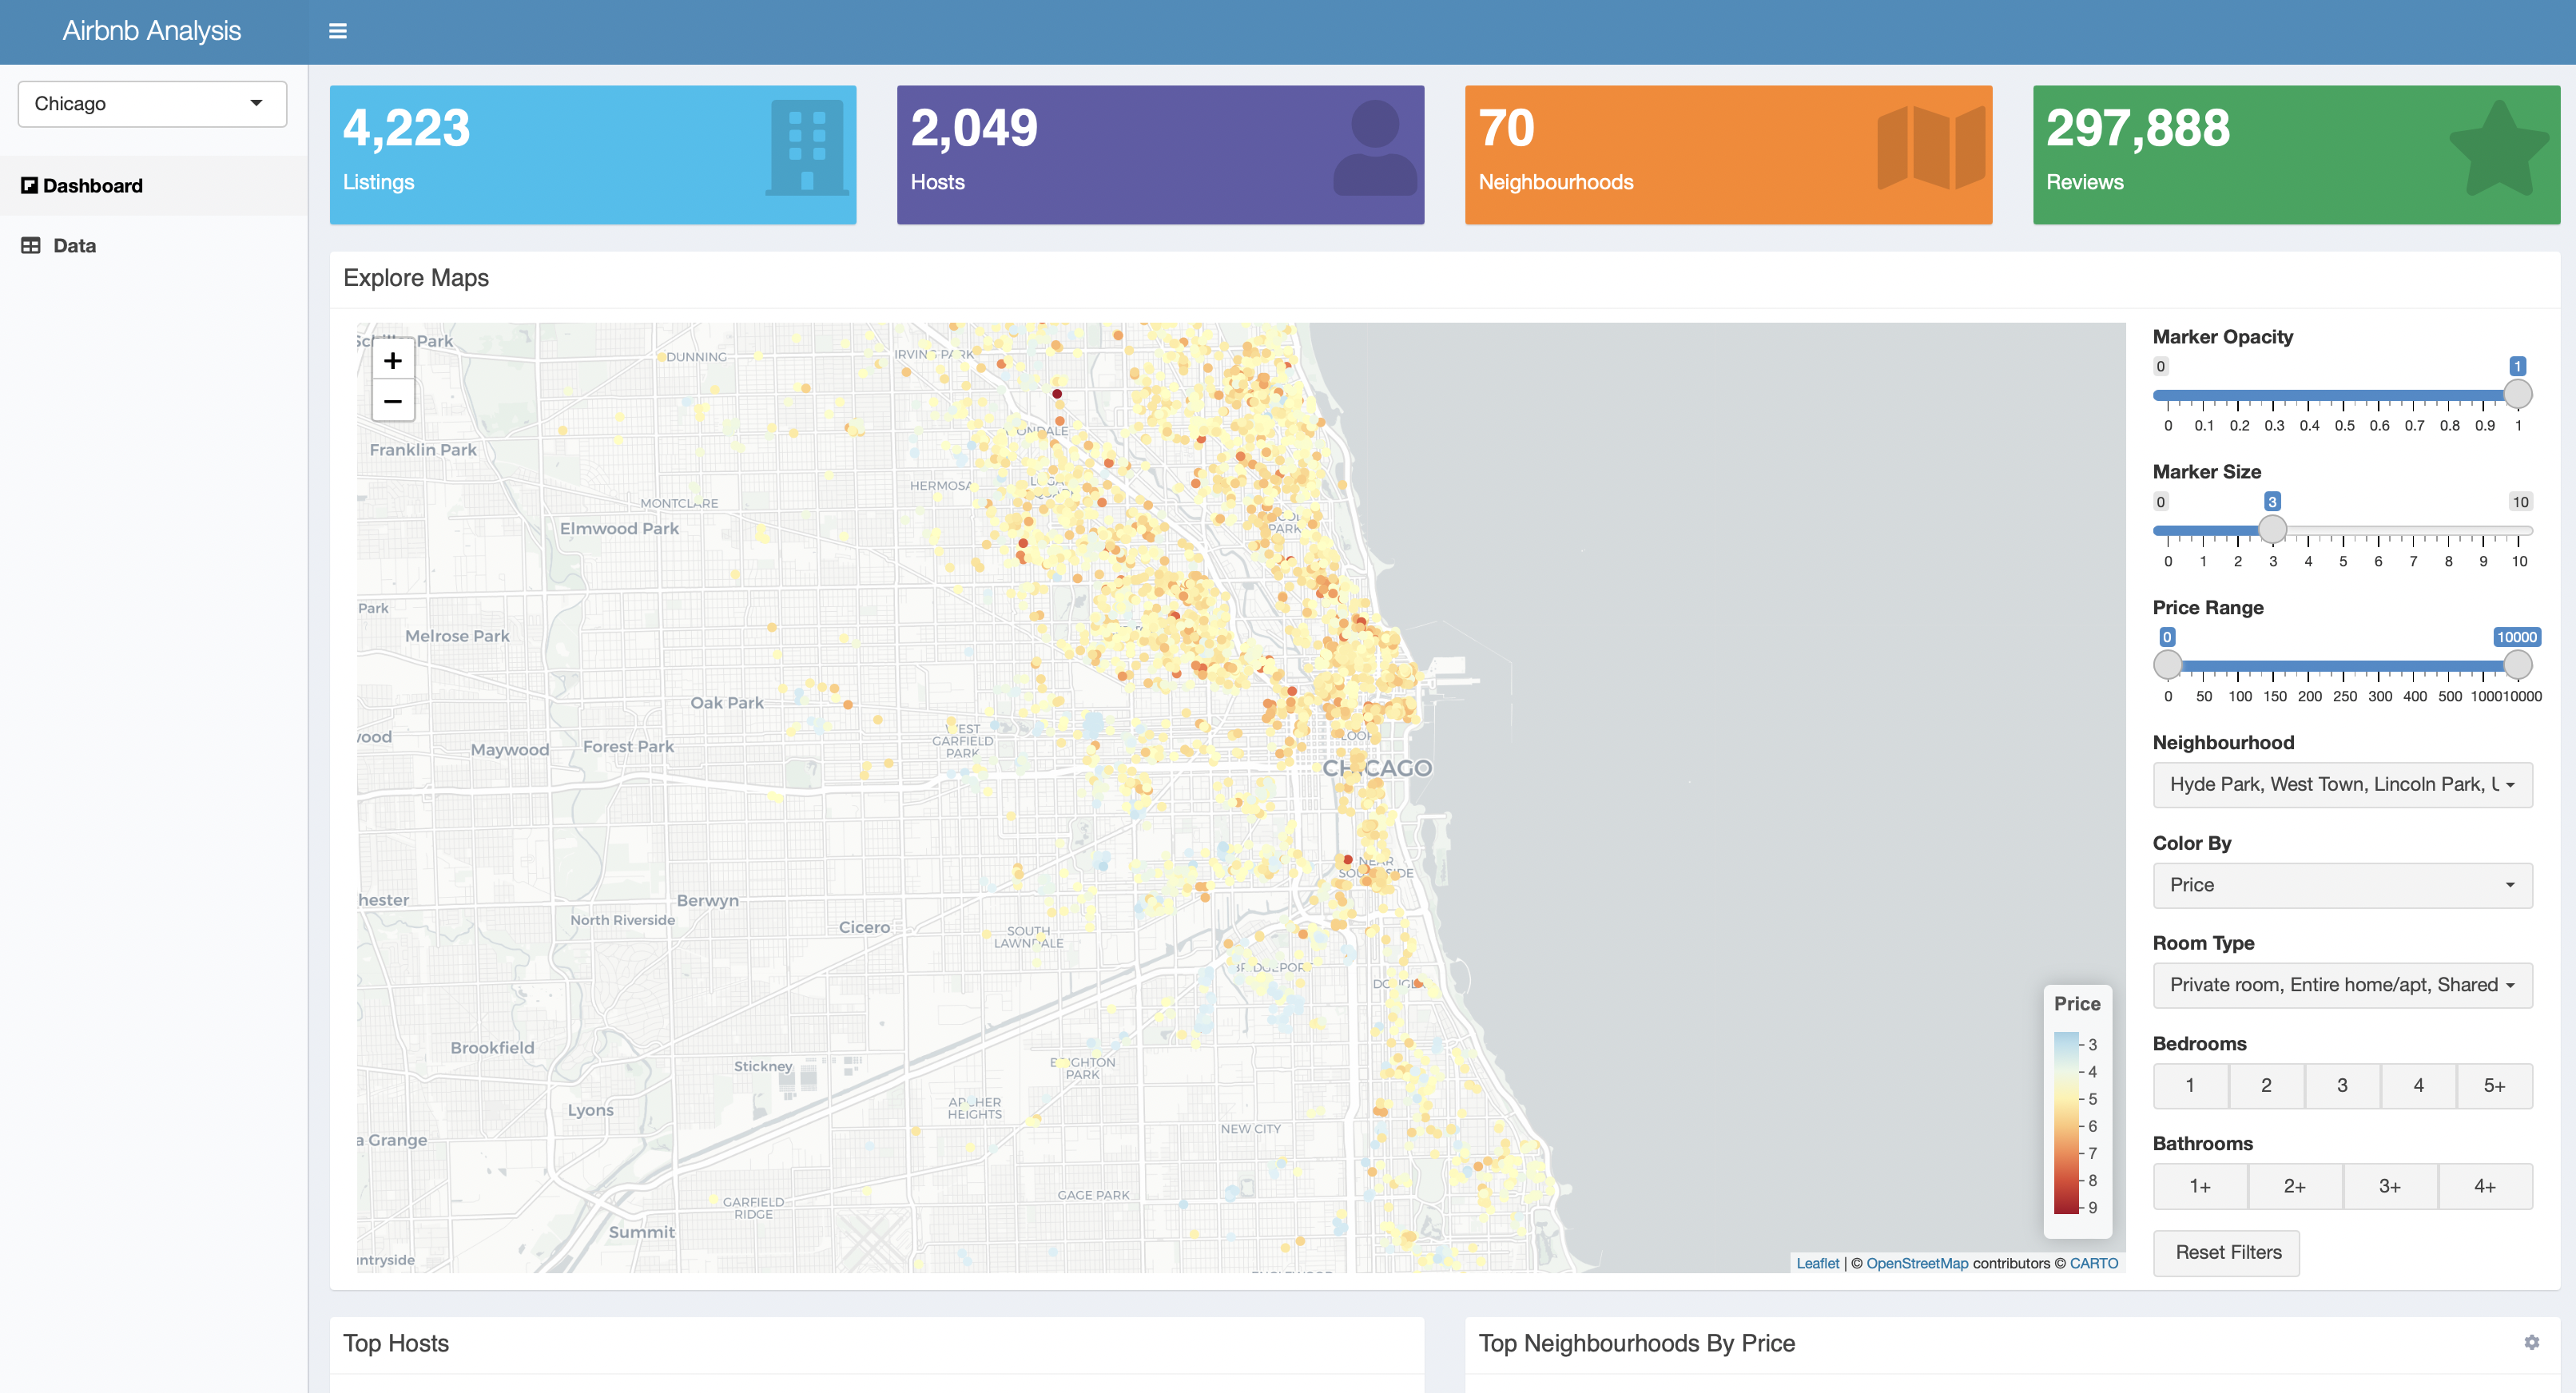
Airbnb Analysis Dashboard is a web application that provides an interactive dashboard containing visualizations and summaries to gain insights about Airbnb using the Airbnb dataset for the USA.
Application is live at:
-
Web Application: https://sajalshres.shinyapps.io/airbnb-analysis/
-
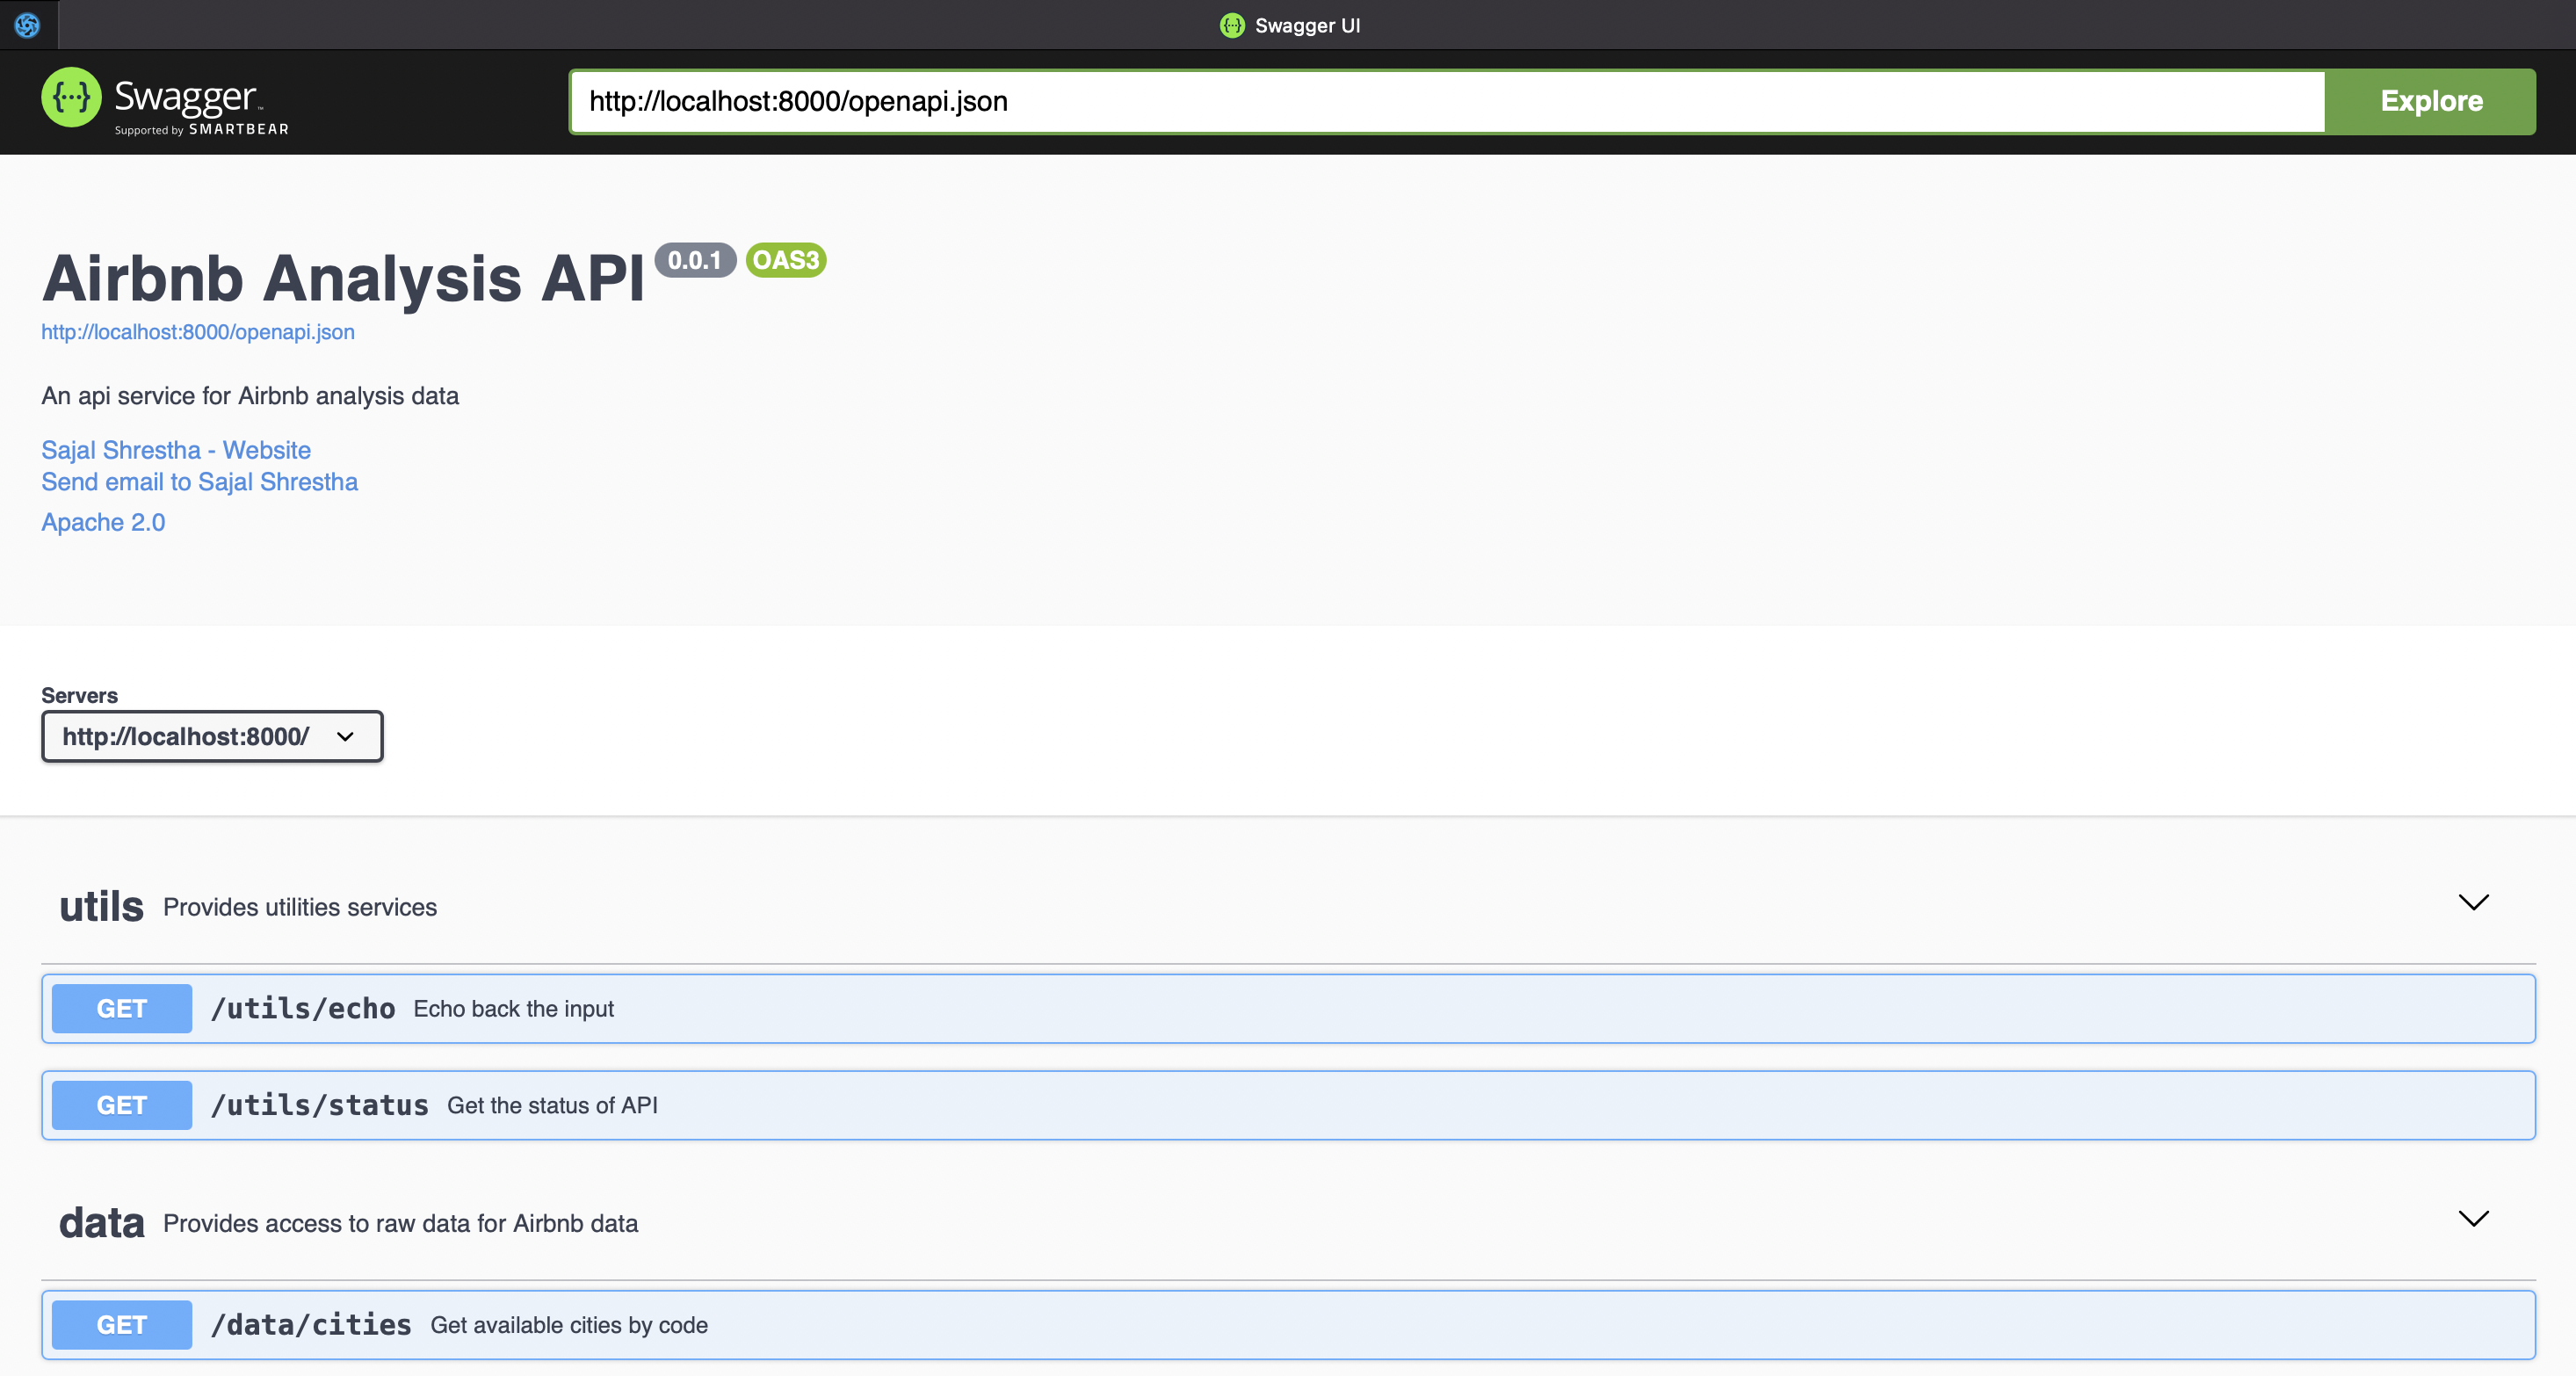
API Application: api-airbnb.sajalshres.com. Visit
/__docs__/endpoint to view API documentation.
Note: API applicaiton is not hosted at the moment. Please refer to setup guide to run it locally.
Proposal
Please visit proposal document for more details on proposal.
Folder Structure
sta-518-project
|
|--api        # API application to fetch raw data, analaysis and summaries.
|--app        # Shiny web appliation containing interactive dashboard.
|--data       # Contains raw and processed data
|--docs       # Contains documentation and rmarkdown notebooks.
|--etl        # ETL cli application to scrape and process the data for analysis.
|--modules    # Shared modules used by scripts and applications.
|--scripts    # Contains rscripts.
Setup
- Install required packages
Rscript scripts/setup.R- Run etl cli tool to scrape the raw data and process them.
Rscript etl/main.R- Run web application
Rscipt scripts/start_app.R --app-dir app --host 127.0.0.1 --port 3000- Run api application
Rscript scripts/start_api.R --app-dir app- Launch your favorite browser and visit
http://localhost:3000to view web application.
- Launch your favorite browser and visit
http://localhost:8000/__docs__/to view api application.
If you wish to use Docker, please check out Setup with Docker


