Example of how to generate a rotating 3D UMAP in napari. This examples uses data from the cytoself project applied to OpenCell data. The code is quite specific to our data and purpose but gives you a good starting point for your own experimentation...
conda create -n napari3drot python=3.9
conda activate napari3drot
pip install -r requirements.txt
If you are on a M1 Mac, you should try instead the setup_env.sh script.
In the following we assume you have already the 3D point coordinates saved as a numpy array (npy). You can use the UMAP package to go from your high-imensional data to 3D UMAP-projected coordinates.
(Optional) Compute UMAP from embeddings
This step is computationally expensive and can take a long time.
from os.path import join
import gdown
import numpy as np
import umap

gdown.download(
    'https://drive.google.com/uc?id=1fXd0VRMoE7Sk9Jbd-lBsy55u8DKHHFZJ',
    join('data', 'embeddings.npy'),
    quiet=False,
)
embeddings = np.load(join('data', 'embeddings.npy'))

reducer = umap.UMAP(n_components=3, n_neighbors=1000, min_dist=0, verbose=True)
umap3d_data = reducer.fit_transform(embeddings)
Generate a rotating 3D UMAP animation
from os.path import join
import napari
import numpy as np
import seaborn as sns
from napari_animation import Animation

# Load data:
data_name = 'umap3D_coordinates'
# UMAP 3D coordinates:
umap3d_data = np.load(join('data', data_name + '.npy'))
# Annotation data for colors:
umap_lab = np.load(join('data', 'label.npy'), allow_pickle=True)

# Make a color matrix for the annotations:
# (Quite specific to our data and problem)
uniq_uniorg = np.unique(umap_lab[:, 0])
lab_color = np.zeros((len(umap_lab), 4))
cmap = sns.color_palette("hls", len(uniq_uniorg) - 1)
i = 0
for fmly in uniq_uniorg:
    if fmly == 'others':
        c = np.array(sns.color_palette('Greys', 100)[9] + (0.25,)).reshape(1, -1)
    else:
        c = np.array(cmap[i] + (1,)).reshape(1, -1)
        i += 1
    ind = umap_lab[:, 0] == fmly
    lab_color[ind] = c

# instantiates a viewer with a points layer:
viewer = napari.view_points(
    umap3d_data,
    scale=(100,) * 3,
    shading='spherical',
    size=0.06,
    name='umap3d',
    edge_width=0,
    face_color=lab_color,
    ndisplay=3,
)

# Resizes window and tries to get a square canvas:
viewer.window.resize(1000+300, 1000)

# Set parameters for the video
scale_factor = 0.5  # scale factor for the final output video size
nb_steps = 30  # number of steps between two target angles

# Instantiates a napari animation object for our viewer:
animation = Animation(viewer)

# Ensures we are in 3D view mode:
viewer.dims.ndisplay = 3

# resets the camera view:
viewer.reset_view()

# Start recording key frames after changing viewer state:
viewer.camera.angles = (0.0, 0.0, 90.0)
animation.capture_keyframe()
viewer.camera.angles = (0.0, 180.0, 90.0)
animation.capture_keyframe(steps=nb_steps)
viewer.camera.angles = (0.0, 360.0, 90.0)
animation.capture_keyframe(steps=nb_steps)

# Render animation as a GIF:
animation.animate(f'demo.gif', canvas_only=True, fps=20, scale_factor=scale_factor)
Supported output formats are:
.gif, .mp4, .mov, .avi, .mpg, .mpeg, .mkv, .wmv
If no extension is provided, images are saved as a folder of PNGs.
See the videos in this and this tweets for an examles of a videos that were made from clips generated with napari. We used the presentation tool KeyNote to compose these more complex videos with added text, effects, and overlays -- but any other video editing tool could be similarly used.
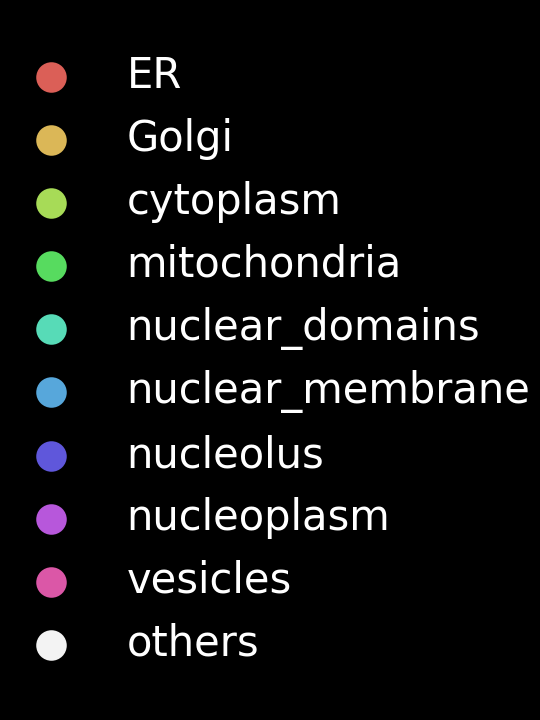
You might need to generate the legend if you want to compose more complex videos using video editing tools. Here is an example on how to do that:
import matplotlib.pyplot as plt

plt.style.use('dark_background')
fig, ax = plt.subplots(1)
legendFig = plt.figure(figsize=(1.8, 2.4))
plist = []
i = 0
leg_names = []
for fmly in uniq_uniorg:
    if fmly != 'others':
        plist.append(
            ax.scatter(i, i, c=np.array(cmap[i] + (1,)).reshape(1, -1), s=40, label=fmly)
        )
        i += 1
        leg_names.append(fmly)
plist.append(
    ax.scatter(
        i + 1, i + 1, c=np.array(sns.color_palette('Greys', 100)[9] + (1,)).reshape(1, -1), s=40, label='others'
    )
)
leg_names.append('others')
legendFig.legend(plist, leg_names, loc='center', frameon=False)
legendFig.savefig('legend_uniorg.png', dpi=300)macOS 11.6.1, RAM 32GB (Intel CPU)

