Simulink takes a lot of time in some iterations
FabioBergonti opened this issue · comments

- I already updated to the latest version I can use
- I already checked similar issues using the search box
- I already cleaned my environment (by removing the wb-toolbox install folder and installing it again)
- I already excluded the possibility that system configuration files (e.g. yarp related) might be responsible
- I am sure the environment variables are correct
Description
I've noticed that during my experiments with the real robot in some iterations simulink takes a lot of time.
I understood this behaviour comparing the desired simulink time (tou) with the output of the block Yarp Time.
This behaviour has an impact on my results because due to this problem I see spikes in the joints state.
I thought that could be a problem of my model (which is a little bit complex), so I've increased the simulink sampling time (from 0.01 s to 0.02 s) in order to give more time for the resolution, but the problem was still present.
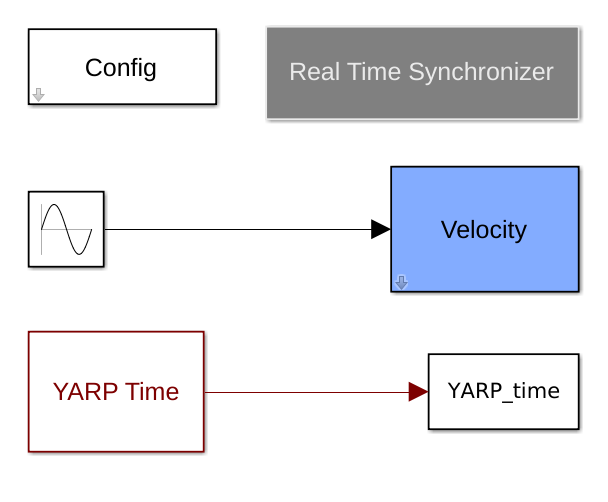
Then I've generated a very simple model where I command in velocity only one joint, there were no scope, no get measurement.
The problem was still present
Here below some graph
- Experiment performed with my Computer (i5 and Matlab 2018a)

- Experiment performed with another Computer (i7 and Matlab 2016b)

Zoom

From the graph I've noticed that in some iteration simulink takes a lot of time, then it tries to recover the delay (where the slope of the blue points is higher).
But after some iteration the phenomena reappers
Platform
I've performed my tests on iCubGenova02
Reproducibility
I did a some tests and it happens every time
Additional information
- OS:
Ubuntu 16.04 - Version / Commit: [e.g.
v4.0] - Matlab Version:
2018aand2016b

Here there are two separate issues.
- Periodically the simulink execution is stopped for a long time (nearly 50ms every 300ms).
- The real time synchronizer tries to "recover" setting control loops of 1ms or less.
While the latter can be solved my modifying the code (as discussed f2f with @diegoferigo), the cause of the first needs to be investigated.

@FabioBergonti Thanks for the very detailed analysis, great report!! For what concern this behavior, it is a mystery to me why every (more or less) 300 ms there is this dip. When I talked f2f with @S-Dafarra I was guessing it was due to the QP block, which computational time might significantly differ step by step, but the fact that this happens also with a trivial model concerns me.
A possible explanation might be the scheduler or the OS which might prioritize by time to time other processes. However, the periodicity or the happening and the fact that happens on two different machines lead me to exclude this explanation.
I need to think a bit more about it, in the meantime I tag @traversaro in the case he has a clever hypothesis.

@FabioBergonti Do you think it make sense to add two YARP time blocks, one that is execute as the first block of the model, and one that is executed as the last one of the model? In CODESYS IEC 61131-3's SFC/CFC you can explicitly assign the order of execution, and @DanielePucci once told me that is possible to do something similar in Simulink.
In this way we can check if the 50 ms delay is inside the simulink block, or is the Simulink thread that is not scheduled by the OS scheduler (or by any intermediate "scheduler"-like entity in matlab, Real-Time synchronizer, etc etc).
The periodicity may indicate that in the same thread simulink is doing some kind of expensive operation (buffer disk access, garbace collection) every 300 ms. Are you using a SSD or a classical hard disk?
Always consider this:
n CODESYS IEC 61131-3's SFC/CFC you can explicitly assign the order of execution, and @DanielePucci once told me that is possible to do something similar in Simulink.
https://it.mathworks.com/help/simulink/examples/block-priority.html
https://it.mathworks.com/help/simulink/ug/controlling-and-displaying-the-sorted-order.html
Thank guys for the support
Are you using a SSD or a classical hard disk?
SSD
Do you think it make sense to add two YARP time blocks, one that is execute as the first block of the model, and one that is executed as the last one of the model?
It could be very useful, I've to investigate how to do it
I've performed another test with a simpler model

So I didn't store any data and I didn't send any signal to the robot
The problem is still present
Plots
X axis simulink time
Y axis yarp time
From 0 to 1.8 s

From 8.2 to 10 s

I would try this on a macOS machine.
Can you launch matlab under strace to check if there is any strange system call every 300 ms?
It should be sufficient to launch it as strace matlab, but given that the actual matlab command is a bash script perhaps it is more difficult.
It should be sufficient to launch it as strace matlab, but given that the actual matlab command is a bash script perhaps it is more difficult.
Still you can modify the bash script.
If you are able to get (even in post processing) a time series of:
- Time of the delay (this seems a perfect period of 300 ms)
- Amount of the delay (this seems to be changing over time, right? )
It could be interesting to plot this data.
Strance
I've performed an experiment using the command strance, in particular
strace -ttT -o nameFile.txt matlab
Here the .txt.
strance save the data from the instant that you launch it, till the moment that you shut down the application. So it has stored also the matlab opening, simulink opening, compilation for the simulation, simulation, simulink closure, matlab closure, ...
In order to be sure that the data that I've analysed are the right I've performed a long simulation (3 min), and I've measured that around 12:29 my simulation has started.
I've decided to analyse from 12:30:30 (line 34000) to 12:30:34 (line 34585)


In the X axis the time that the operation occurs
In the Y axis the time needed for the operation
Every 250/300 ms a long operation occurs
I've notice also that every three spikes some small operations occurs
Here below a part of the .txt
12:30:30.185856 read(761, "\1\0\0\0\0\0\0\0", 8) = 8 <0.000010>
12:30:30.185910 write(761, "\1\0\0\0\0\0\0\0", 8) = 8 <0.000009>
12:30:30.185946 poll([{fd=761, events=POLLIN}], 1, 5249) = 1 ([{fd=761, revents=POLLIN}]) <0.000009>
12:30:30.185980 read(761, "\1\0\0\0\0\0\0\0", 8) = 8 <0.000009>
12:30:30.186010 poll([{fd=761, events=POLLIN}], 1, 5249) = 1 ([{fd=761, revents=POLLIN}]) <0.267125>
12:30:30.453272 read(761, "\1\0\0\0\0\0\0\0", 8) = 8 <0.000012>
12:30:30.453404 poll([{fd=761, events=POLLIN}], 1, 4981) = 1 ([{fd=761, revents=POLLIN}]) <0.001308>
12:30:30.454849 read(761, "\1\0\0\0\0\0\0\0", 8) = 8 <0.000025>
12:30:30.454987 poll([{fd=761, events=POLLIN}], 1, 4980) = 1 ([{fd=761, revents=POLLIN}]) <0.295834>
12:30:30.751049 read(761, "\1\0\0\0\0\0\0\0", 8) = 8 <0.000016>
12:30:30.751169 poll([{fd=761, events=POLLIN}], 1, 4684) = 1 ([{fd=761, revents=POLLIN}]) <0.001501>
12:30:30.752752 read(761, "\1\0\0\0\0\0\0\0", 8) = 8 <0.000015>
12:30:30.752858 poll([{fd=761, events=POLLIN}], 1, 4682) = 1 ([{fd=761, revents=POLLIN}]) <0.001732>
12:30:30.754681 read(761, "\1\0\0\0\0\0\0\0", 8) = 8 <0.000015>
12:30:30.754778 poll([{fd=761, events=POLLIN}], 1, 4680) = 1 ([{fd=761, revents=POLLIN}]) <0.001085>
12:30:30.755956 read(761, "\1\0\0\0\0\0\0\0", 8) = 8 <0.000019>
12:30:30.756070 poll([{fd=761, events=POLLIN}], 1, 4679) = 1 ([{fd=761, revents=POLLIN}]) <0.261204>
12:30:31.017549 read(761, "\1\0\0\0\0\0\0\0", 8) = 8 <0.000147>
12:30:31.017993 futex(0x7efc78836aec, FUTEX_CMP_REQUEUE_PRIVATE, 1, 2147483647, 0x7efc78836ac0, 2) = 1 <0.000116>
12:30:31.018340 futex(0x7efc78836ac0, FUTEX_WAKE_PRIVATE, 1) = 1 <0.000114>
12:30:31.018623 poll([{fd=761, events=POLLIN}], 1, 0) = 1 ([{fd=761, revents=POLLIN}]) <0.000029>
Post Processing on Yarp Time
I did some post processing on the data that I've stored during the simulation
In this graph is possible to see the delta of the Yarp time from one operation to another
y=diff(YARP_time)

Starting from that graph I evaluated the distance between the peaks with an amplitude higher than 0.015 s
y=diff(YARP_time)
diff(YARP_time(y>0.015))
The result are shown here

Looking on the plot I clearly notice that the distance is quite constant, it has a mean of 0.2890 s
This confirm a sort of periodicity
As mentioned on Telegram, if when you run the model and collect data with strace you are able to identify the Process ID (PID) of the matlab process (or of the process that runs simulink, if it is a different process) you can easily get the mapping between file descriptors and actual files on the filesystem.
For example, on my machine I can find all the process that contain the string "firefox" in ther command that has been used to create those process as in:
straversaro@iiticublap103:~$ ps -aux | grep firefox
straver+  2273  8.7  2.1 3265052 692564 tty2   Sl+  09:19  26:51 /usr/lib/firefox/firefox --sm-client-id 273ab5d20-7db7-4fd5-9cac-2e90ba09051b
straver+  2832 14.3  3.0 2939652 1004488 tty2  Sl+  09:19  44:08 /usr/lib/firefox/firefox -contentproc -childID 1 -isForBrowser -prefsLen 11286 -schedulerPrefs 0001,2 -greomni /usr/lib/firefox/omni.ja -appomni /usr/lib/firefox/browser/omni.ja -appdir /usr/lib/firefox/browser 2273 true tab
straver+  2940  3.9  2.6 2753616 877152 tty2   Sl+  09:19  11:59 /usr/lib/firefox/firefox -contentproc -childID 2 -isForBrowser -prefsLen 11286 -schedulerPrefs 0001,2 -greomni /usr/lib/firefox/omni.ja -appomni /usr/lib/firefox/browser/omni.ja -appdir /usr/lib/firefox/browser 2273 true tab
straver+  3179  3.2  2.5 2678472 821536 tty2   Rl+  09:19  10:01 /usr/lib/firefox/firefox -contentproc -childID 3 -isForBrowser -prefsLen 14992 -schedulerPrefs 0001,2 -greomni /usr/lib/firefox/omni.ja -appomni /usr/lib/firefox/browser/omni.ja -appdir /usr/lib/firefox/browser 2273 true tab
straver+  5612  6.1  2.9 2905320 956344 tty2   Sl+  09:34  17:54 /usr/lib/firefox/firefox -contentproc -childID 4 -isForBrowser -prefsLen 14992 -schedulerPrefs 0001,2 -greomni /usr/lib/firefox/omni.ja -appomni /usr/lib/firefox/browser/omni.ja -appdir /usr/lib/firefox/browser 2273 true tab
straver+ 23370  0.0  0.0  16512  1088 pts/0    S+   14:27   0:00 grep --color=auto firefox
I can then get the open file descriptors of the first instance of firefox using the following command:
straversaro@iiticublap103:~$ ls -l /proc/2273/fd
total 0
lr-x------ 1 straversaro straversaro 64 ago 31 09:19 0 -> /dev/null
lrwx------ 1 straversaro straversaro 64 ago 31 09:19 1 -> 'socket:[36186]'
lr-x------ 1 straversaro straversaro 64 ago 31 09:19 10 -> 'pipe:[38040]'
lrwx------ 1 straversaro straversaro 64 ago 31 14:01 100 -> '/home/straversaro/.cache/mozilla/firefox/tn48d6b7.Fast User/OfflineCache/index.sqlite'
lrwx------ 1 straversaro straversaro 64 ago 31 14:01 101 -> 'socket:[375618]'
lr-x------ 1 straversaro straversaro 64 ago 31 14:01 102 -> /proc/2273/mountinfo
lrwx------ 1 straversaro straversaro 64 ago 31 14:01 103 -> 'socket:[371488]'
lr-x------ 1 straversaro straversaro 64 ago 31 14:01 104 -> /usr/lib/firefox/browser/features/activity-stream@mozilla.org.xpi
lrwx------ 1 straversaro straversaro 64 ago 31 14:01 105 -> 'socket:[376760]'
lrwx------ 1 straversaro straversaro 64 ago 31 14:01 106 -> 'socket:[345514]'
lrwx------ 1 straversaro straversaro 64 ago 31 14:01 107 -> '/home/straversaro/.mozilla/firefox/tn48d6b7.Fast User/formhistory.sqlite'
<...>
I guess you can get the MATLAB PID using the command ps -aux | grep MATLAB, but I am not 100% sure as perhaps the command name changed if you use strace, or perhaps MATLAB forks its process when running a simulation in simulink.
I would suggest to plot without interpolation (option '*' in plot if I remember well).
Maybe a screenshot of top can be useful to see which PID corresponds to which process.
Test on a macOS
I've performed a test also on macOS
Same behaviour
Results
In this graph is possible to see the delta of the Yarp time from one operation to another
y=diff(YARP_time)

Starting from that graph I evaluated the distance between the peaks with an amplitude higher than 0.015 s
y=diff(YARP_time)
diff(YARP_time(y>0.015))
The result are shown here

@nunoguedelha It is possible that this is the same behavior that you saw when using the bindings?

Is @FabioBergonti using the bindings?

@traversaro I'm not sure. I was having constantly high delays. As soon as I closed Firefox and other MIPS hungry processes, the timing intervals dropped down to 150ms, and I haven't noticed spikes. But anyway, the thread timing I'm using is not the exactly similar to SImulink's synchronizer. I'll perform a few tests to check.
@FabioBergonti the last plots you've posted come from the test we've done on the mac, or the data you were getting on linux?
Is @FabioBergonti using the bindings?
No
@FabioBergonti the last plots you've posted come from the test we've done on the mac, or the data you were getting on linux?
If you are talking about this comment, yes because they were done using the tests that we've done one the mac
First Test
I've repeated the test using my laptop
Also this time I've used strace
Looking on that, a lot of time the process 760 and 691 are called
top
30555 fbergon+  20   0 8585664 1,921g 704972 S   7,8 12,3   2:30.28 MATLAB
30852 fbergon+  20   0 1889116  91924  59228 S   4,2  0,6   0:10.64 MATLABWindow
30825 fbergon+  20   0 2160540  81672  66740 S   2,1  0,5   0:05.98 MATLABWindow
ps -aux | grep MATLAB
fbergon+ 30555 35.7 12.3 8585664 2015172 pts/2 Sl+  16:20   2:38 /usr/local/MATLAB/R2018a/bin/glnxa64/MATLAB
fbergon+ 30825  2.1  0.5 2160540 81672 pts/2   Sl+  16:22   0:08 /usr/local/MATLAB/R2018a/bin/glnxa64/MATLABWindow -from-webwindow -custom-close-listener-enable=1 -locale=en_US --proxy-bypass-list=<local> -processid=30555 -log-severity=disable --disable-background-timer-throttling --disable-renderer-backgrounding -cache-path=/tmp/tp2a6e0067_fcb4_4997_ad46_f40e15e72ff6 --disable-gpu
fbergon+ 30827  0.0  0.2 322984 37416 pts/2    S+   16:22   0:00 /usr/local/MATLAB/R2018a/bin/glnxa64/MATLABWindow --type=zygote --no-sandbox --lang=en-US --locales-dir-path=/usr/local/MATLAB/R2018a/bin/glnxa64/cef_locales --log-file=/usr/local/MATLAB/R2018a/bin/glnxa64/debug.log --log-severity=disable --resources-dir-path=/usr/local/MATLAB/R2018a/bin/glnxa64/cef_resources
fbergon+ 30852  3.9  0.5 1889116 92108 pts/2   Sl+  16:22   0:14 /usr/local/MATLAB/R2018a/bin/glnxa64/MATLABWindow --type=renderer --disable-background-timer-throttling --no-sandbox --primordial-pipe-token=CA457D1E01336B6292349B7F39D28C8E --lang=en-US --lang=en-US --locales-dir-path=/usr/local/MATLAB/R2018a/bin/glnxa64/cef_locales --log-file=/usr/local/MATLAB/R2018a/bin/glnxa64/debug.log --log-severity=disable --resources-dir-path=/usr/local/MATLAB/R2018a/bin/glnxa64/cef_resources --enable-pinch --num-raster-threads=2 --enable-main-frame-before-activation --content-image-texture-target=0,0,3553;0,1,3553;0,2,3553;0,3,3553;0,4,3553;0,5,3553;0,6,3553;0,7,3553;0,8,3553;0,9,3553;0,10,3553;0,11,3553;0,12,3553;0,13,3553;0,14,3553;0,15,3553;1,0,3553;1,1,3553;1,2,3553;1,3,3553;1,4,3553;1,5,3553;1,6,3553;1,7,3553;1,8,3553;1,9,3553;1,10,3553;1,11,3553;1,12,3553;1,13,3553;1,14,3553;1,15,3553;2,0,3553;2,1,3553;2,2,3553;2,3,3553;2,4,3553;2,5,3553;2,6,3553;2,7,3553;2,8,3553;2,9,3553;2,10,3553;2,11,3553;2,12,3553;2,13,3553;2,14,3553;2,15,3553;3,0,3553;3,1,3553;3,2,3553;3,3,3553;3,4,3553;3,5,3553;3,6,3553;3,7,3553;3,8,3553;3,9,3553;3,10,3553;3,11,3553;3,12,3553;3,13,3553;3,14,3553;3,15,3553;4,0,3553;4,1,3553;4,2,3553;4,3,3553;4,4,3553;4,5,3553;4,6,3553;4,7,3553;4,8,3553;4,9,3553;4,10,3553;4,11,3553;4,12,3553;4,13,3553;4,14,3553;4,15,3553 --disable-accelerated-video-decode --disable-webrtc-hw-vp8-encoding --disable-gpu-compositing --service-request-channel-token=CA457D1E01336B6292349B7F39D28C8E --renderer-client-id=2 --shared-files=v8_natives_data:100,v8_snapshot_data:101
fbergon+ 31298  0.0  0.0  21296   988 pts/19   S+   16:28   0:00 grep --color=auto MATLAB
ls -l /proc/30555/fd
 lrwx------ 1 fbergonti fbergonti 64 ago 31 16:34 760 -> anon_inode:[eventfd]
 lrwx------ 1 fbergonti fbergonti 64 ago 31 16:34 691 -> socket:[932639]


The problem is still present, but is reduce a lot with respect to the previous simulation
Second Test
Another test but this time saving the results of strace on a .txt

After 200s the behavior change
A zoom of that region

So the problem is reduced only in that part
ls -l /proc//fd
lrwx------ 1 fbergonti fbergonti 64 ago 31 16:47 709 -> socket:[986710]
lrwx------ 1 fbergonti fbergonti 64 ago 31 16:47 760 -> anon_inode:[eventfd]
Third experiment
I've repeated another time the experiment but this time I've closed all the applications and I've launched the simulation with the command sim('name simulation') (no more from the GUI) (@traversaro suggest me that)


The problem is reduced during all the time instant
diff(YARP_time) is never higher than 0.015)
Launching the simulation from the command window could be a solution
Launching the simulation from the command window could be a solution
In light of the above, definitely. I wonder if the problem is still present by generating the C++ code @diegoferigo
A bit of recap on why we decided to go for launching MATLAB headless.
The delay on the simulation of the Simulink model seems to be extremely correlated (even from data that @FabioBergonti did not posted in the issue) to long blocking poll system calls on a file created with the eventfd linux system call.
I am not an expert of these, but it seems from the documentation that eventfd is used for creating a file that acts as a sort of "multi-process" semaphore. I highly suspect that this is used for some kind of synchronization between the main matlab process (MATLAB) and the GUI processes (MATLABWindow), and indeed this seems to be confirmed from the results obtaining in running MATLAB without any GUI. As this behaviour seems to be just related to the MATLAB process and not to be Simulink-specific, it would affect as well any script that uses the YARP bindings, that's the reason why I asked to @nunoguedelha if he thought this was correlated with the delays that he saw.
Clearly using Simulink expecting any kind of reliable real-time behaviour is using Simulink widely outside its specification: the Simulink Coder is what is meant to be used for that. However, this behavior is quite scary, and the fact that could be reproduced on @nunoguedelha's computer on a different OS makes it more scary. @gabrielenava do you have any idea if this is affecting also the Yoga++ when you execute it?
In general, it would be ideal if the Real Time Synchronizer could provide some kind of feedback to the user about the average/peak delay at the end of the simulation, but I am not sure if this is doable.

@gabrielenava do you have any idea if this is affecting also the Yoga++ when you execute it?
as discussed with @S-Dafarra, we sometimes observed apparently inexplicable failures while running the Yoga ++ (e.g. after several successful Yoga demos, we run it once again and the robot this time fails to move the CoM above the stance foot). We usually blamed the FT sensors or the joints fine calibration, but it seems that also this issue may explain these failures. Looking at the plots coming from Simulink I never noted something strange (but the yoga movements are smoother than the jumping ones, so maybe that's why I didn't see something like this).
Can we close this issue now that the source was sorted out and we have a static gui for avoiding it?
Ok for me.
Ok also for me.
@VenusPasandi was also affected by this when playing a simple sine wave in Simulink. I guess this problem was not present (at least in this form) in older version of Simulink.
Interesting, so probably also the experiments I run last week with @anqingd that were showing a similar result were affected by this. Me and @gabrielenava were blaming mostly gain tuning, but apparently the source of the problem was something else.
Btw, I was not aware that the matlab version in the robot setup has been updated.
Have a look at the Simulink static GUI I've created for whole-body-controllers.
Be aware that there is a bug in the GUI (but you must be a very bad person to trigger it): robotology/whole-body-controllers#58
If the recent problems that @GiulioRomualdi found (namely, scattering behaviours when controlling from simulink the robot in position direct, right @GiulioRomualdi ?) are not addressed by making a static GUI, I guess we should consider to re-open this issue
There is no need for a static GUI, you can mitigate the problem just by running the Simulink model without a GUI. However, this is just a mitigation, as Simulink never offered any kind of real time assurance, so for what we know the next version of Simulink (or the existing Simulink in different conditions) could have the same problems even when running without GUI. As far as I understand, the only "proper" (for a given definition of "proper") way of running Simulink models in real-time is either to use Simulink Real Time or to generate, compile and run the corresponding C code using the Simulink Coder.