Project 1 for Coursera's Exploratory Data Analysis course
The purpose of this project is to recreate the plots provided in the course material using electrical power consumption data from the UC Irvine Machine Learning Repository. This document describes how to obtain the plotting scripts and run them locally.
git clone https://github.com/RaphaelDeLaGhetto/ExData_Plotting1.git
This data was originally downloaded on 2014-9-3
cd ExData_Plotting1
wget https://d396qusza40orc.cloudfront.net/exdata%2Fdata%2Fhousehold_power_consumption.zip
For each of the scripts below, ensure you are in the project's working directory. From there you may either run
Rscript plotN.R
or source the script from within the R interpreter
R
> source('plotN.R')
Be sure to replace N with the desired plot number.
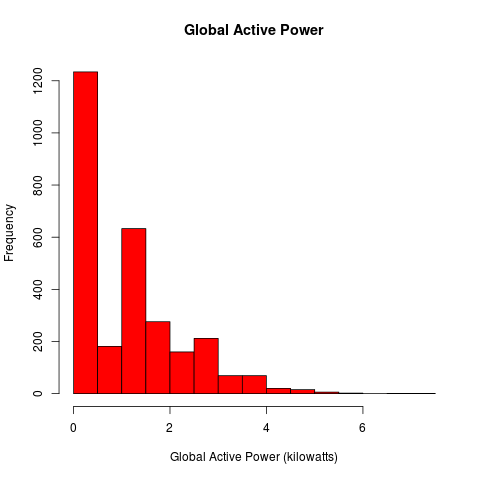
Upon execution (i.e., Rscript plot1.R), this image is produced:
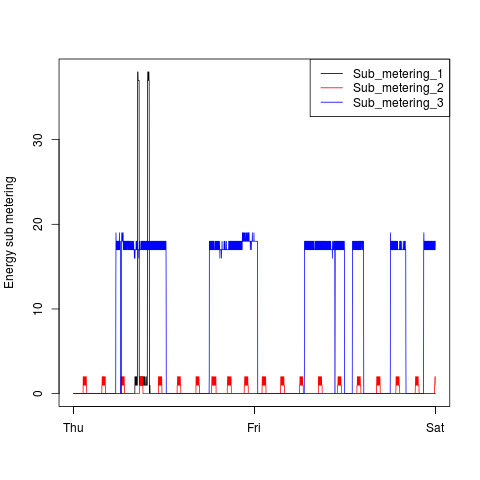
Rscript plot2.R produces:

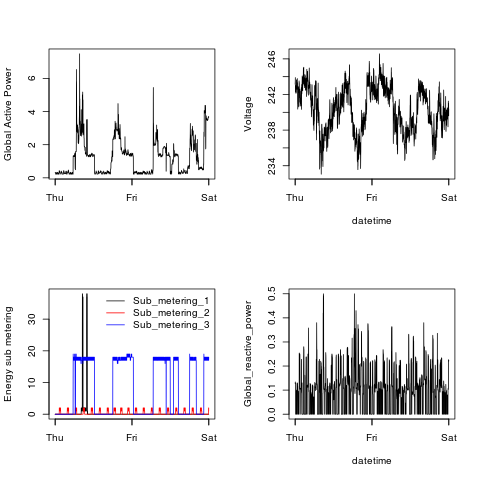
Rscript plot3.R produces:
Rscript plot4.R produces:
The loadData.R script contains the loadData() function declaration. It is called in each
of the plot scripts to unzip the original data set and select the relevant data.
The figure/ directory contains the images from the original project, from which this
project is forked.