Employees Logit Model
In regression problems you are trying to predict the numeric value of the independent (outcome) variable
In classification problems you analyze what factors influence the fact that outcome belongs to a given category or you predict to what category someone (something) will belong
Examples: will student fail (0) or pass(1), what causes that someone does not smoke (0) or smokes (1), or should teacher be given a wage increase
Logit model gives a probability for a set of explanatory variables (factors): x
How to decide to which category assign (outcome variable): y
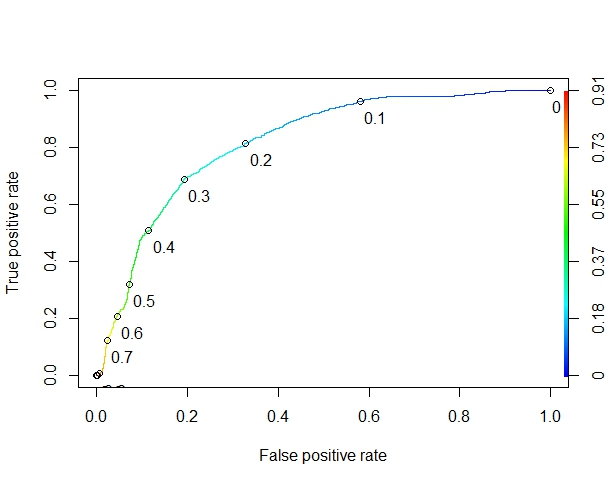
If P(y=1) >= t , assign to category "1" If P(y=1) < t , assign to category "0"
If t is large (for example 0.8), you will rarely assign „1” category For example management will give wage increase only to very best teachers
If t is small (for example 0.3), you will very often assign „1” category For example management will give wage rise to many teachers (if wage increase budget is big)
If you have no idea what is the proper choice, set t=0.5
| AIC: 12927 Probability: 81% | Estimate | Std. Error | t value | Pr(>|t|) | |
|---|---|---|---|---|---|
| Intercept | -1.5508132 | 0.1717124 | -9.031 | < 2e-16 | *** |
| Satisfaction level | -4.1307434 | 0.0977270 | -42.268 | < 2e-16 | *** |
| Last evaluation | 0.7264817 | 0.1486903 | 4.886 | 1.03e-06 | *** |
| Number of projects | -0.3149832 | 0.0212517 | -14.822 | < 2e-16 | *** |
| Average monthly hours | 0.0044558 | 0.0005144 | 8.662 | < 2e-16 | *** |
| Time spend in company | -0.2612599 | 0.0153833 | 16.983 | < 2e-16 | *** |
| Work accidents | -1.5368679 | 0.0894349 | -17.184 | < 2e-16 | *** |
| Promotion during last 5 years | -1.4828491 | 0.2559823 | -5.793 | 6.92e-09 | *** |
| Low salary | 2.0054295 | 0.1275116 | 15.727 | < 2e-16 | *** |
| Medium salary | 1.4708288 | 0.1283351 | 11.461 | < 2e-16 | *** |
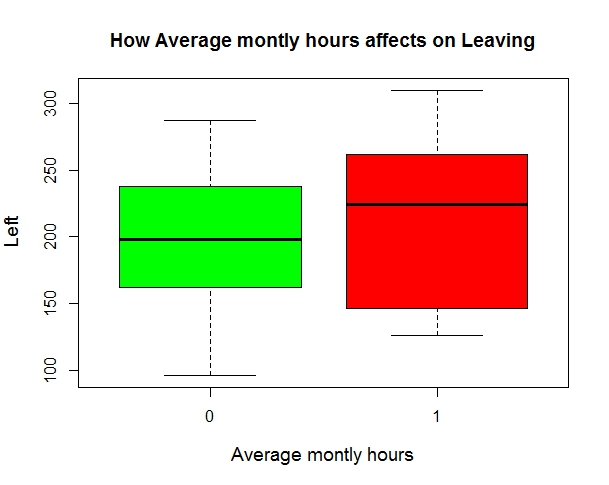
The boxplot illustrates us that those employees who works more than 200 hours per month are inclined to leave the job.
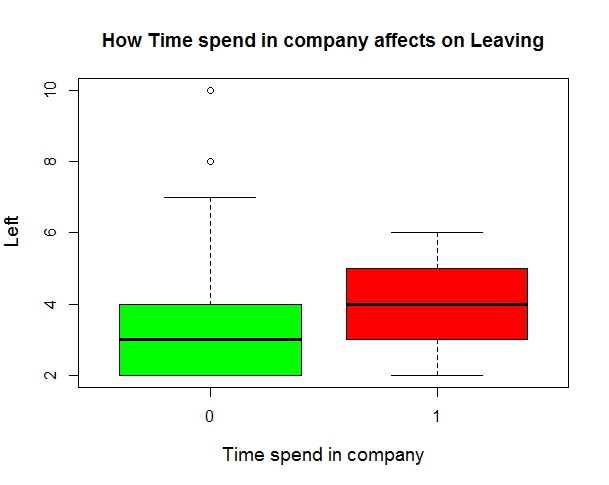
Next boxplot depicts us that those who spend in the company more than 4 years often leave the job.
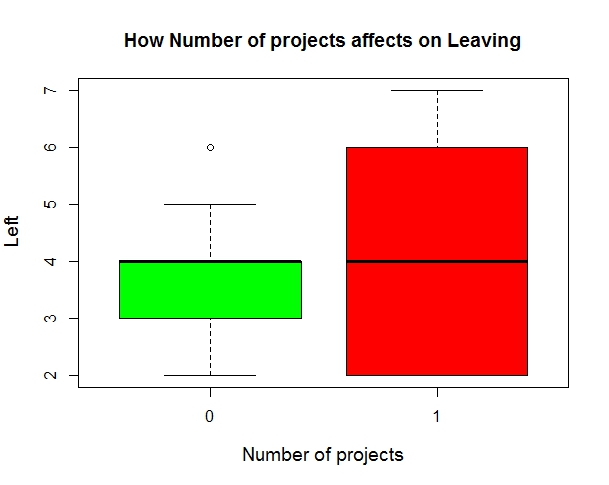
This diagram demonstrates us that more project you have, higher chance of leaving the work.
The plot presents us that those who has satisfaction level lower than 0.5 often leave the job.
As you can see the best threshold is 0.4, because there we have the least amount of errors
Conclusion:
- The key indicators to watch out for are:
- The employees who have left have had a satisfaction level < 0.5.
- Average monthly hours > 200 have resulted in employees leaving the company.
- Employees also leave after spending average 4 years of time in the company.