create spectrogram of signal from scratch
specto class divided into 3 origin function:
read wave sound and get one channel of sound
return => signal of that channel and sampeling frequency
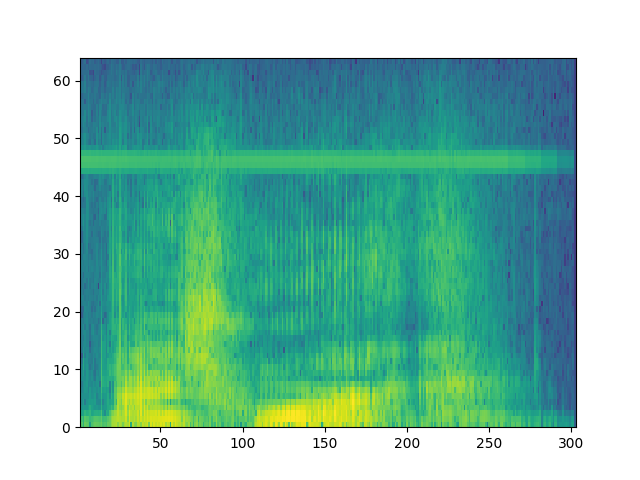
It splited signal into overlapping sections and applies the window specified by the window parameter to each section
after that it compute discrete time fourier transform for each section and return final_spectrogram.
show imagee of spectrogram by matplotlib.pyplot