Paula Bailey 2022-10-13
This is a case study for bellabeat, a high-tech manufacturer of health-focused products for women. Since it was founded in 2013, the company has been growing their e-commerce channel on their website. The company offers five products: app, leaf wellness tracker, time wellness watch, spring water bottle, and subscription based membership.
For this project, I will analyze smart device usage to gain insight into how consumers use non-bellabeat smart devices. Afterwards we will select one bellabeat product to address the following questions:
- What are some trends in smart device usage?
- How could these trends apply to Bellabeat customers?
- How could these trends help influence Bellabeat marketing strategy?
And produce a report with the following deliverables:
- A clear summary of the business task
- A description of all data sources used
- Documentation of any cleaning or manipulation of data
- A summary of your analysis
- Supporting visualizations and key findings
- Your top high-level content recommendations based on your analysis
- What are some trends in smart device usage?
- How could these trends apply to Bellabeat customers?
- How could these trends help influence Bellabeat marketing strategy?
Business Task: Based on current trends in smart device usage, how to market to bellabeat’s customer.
We used the FitBit Fitness Tracker Data CCO: Public Domain, made available through Mobius. This Kaggle data set contains personal fitness tracker information from 30 fitbit users. These users consented to participating in the project. The tracking data include minute-level output for physical activity, heart rate, and sleep monitoring.
The data is stored on Kaggle as a zip file. It contained eighteen csv files. Thirteen are in a long format and five in wide format. The data is credible. It is provided by a Healthcare data scientist in Australia who contributes to the Kaggle platform. It has been used and cited by other participants. It is also an open-data which is available to anyone to use. There are several drawbacks. The first is the data is not current; however, it does meet the other best practices as being reliable, original, comprehensive, and cited. The other draw back is some of the files have under thirty observations.
After downloading the zip file and extracting the dataset, I made a copy of the folder in order to maintain the original data.
We checked BigQuery’s public data base for any current (or recent) data sets on women using smart devices. I was unable to locate a proxy data set, so I will continue with this data set.
To complete the project, I used 5 of the 18 csv files. Many of the files contained data stored in a different csv file. Below is a description:
dailyActivity_merged File is in long format 940 x 15. The variables
are Id, ActivityDate, TotalSteps, TotalDistance, TrackerDistance,
LoggedActivitiesDistance, VeryActiveDistance, ModeratelyActiveDistance,
LightActiveDistance, SedentaryActiveDistance, VeryActiveMinutes,
FairlyActiveMinutes, LightlyActiveMinutes, SedentaryMinutes, and
Calories. This file has no missing “blank” cell. It has date format and
seems to be complete.
dailyCalories_merged File is in long format 940 x 3. The variables are
Id, ActivityDay, and Calories. This file has no missing “blank” cell. It
has date format and seems to be complete.
dailyIntensities_merged The file is in long format 940 x 10. The
variables are Id, ActivityDay, SedentaryMinutes, LightlyActiveMinutes,
FairlyActiveMinutes, VeryActiveMinutes, SedentaryActiveDistance,
LightActiveDistance, ModeratelyActiveDistance, and VeryActiveDistance.
There are no data for columns LoggedActivitiesDistance and
SedentaryActiveDistance. This file has no missing “blank” cell. It has
date format. The file seems to be complete.
sleepDay_merged The variables are Id, SleepDay, TotalSleepRecords,
TotalMinutesAsleep, and TotalTimeInBed. This file has no missing “blank”
cell. The date is in datetime format and needs to be formatted. The data
frame is 412 x 5, so we do not have data for every participant.
weightLogInfo_merged The variables are Id, Date, WeightKg,
WeightPounds, Fa, BMI, IsManualReport, and LogId. This file has no
missing “blank” cell. The date is in datetime format and needs to be
formatted. We are missing most of the information in the Fat columns.
The data frame is 67 x 8, so we do not have data for every participant.
The remaining files were not used: dailySteps_merged, heartrate_seconds_merged, hourlyCalories_merged, hourlyIntensities_merged, hourlySteps_merged, minuteCaloriesNarrow_merged, minuteCaloriesWide_merged, minuteIntensitiesWide_merged, minuteMETSNarrow_merged, minuteStepsNarrow_merged, hourlyIntensities_merged and minuteStepsWide_merged.
To process these data sets, I will be R programming language. It will allow me to check for missing values, verify the dates are in the correct format, analyze the data, and create visualizations.
There are a couple of concerns: there are participants with less than 1000 calories. I may need to consider those observations as incomplete and remove them…but I prefer not. The metadata for the page is no longer available, so we will document my concerns. It is possible that participants are fasting or more likely failed to update the app. However the goal is to determine how users are using smart devices, so we are not going to focus so much on this issue. The other concerns is sample size and we don’t have key characteristics - gender (we are lead to believe the participants are female, but we do not know for sure) and age.
dailyActivity_merged No out of range dates, but need to address
formatting to be consistent if used.
dailyCalories_merged No out of range dates, but need to address
formatting to be consistent if used.
dailyIntensity_merged No out of range dates, but need to address
formatting to be consistent if used.
sleepDay_merged No out of range dates, but need to address formatting
to be consistent if used..
weightLogInfo_merged No out of range dates, but need to address
formatting to be consistent if used.. Missing most of fat percentage;
only 2 recorded. Only 8 ppts participated. We can not use this
information to make reliable recommendations
We have checked all files to make sure there is no missing data. We also verified that the dates are within the correct rate and format.
To track the cleaning process, it will be noted in this RMarkdown document and in a README.doc saved in the project directory.
#remove blank columns
dailyActivity  <- read.csv("dailyActivity_merged_pmb.csv")%>% select(-LoggedActivitiesDistance, -SedentaryActiveDistance)

minuteMET <- read.csv("minuteMETsNarrow_merged_pmb.csv")
dailyIntensity <- read.csv("dailyIntensities_merged_pmb.csv")
dailySleep     <- read.csv("sleepDay_merged_pmb.csv")
dailySteps <- read.csv("dailySteps_merged_pmb.csv")
dailyCalories  <- read.csv("dailyCalories_merged_pmb.csv")
weightLog    <- read.csv("weightLogInfo_merged_pmb.csv")
hearrateSec <- read.csv("heartrate_seconds_merged_pmb.csv")
Checked to see if we have any missing values.
cbind(
   lapply(
     lapply(weightLog, is.na)
     , sum)
   )
## [,1]
## Id 0
## Date 0
## WeightKg 0
## WeightPounds 0
## Fat 65
## BMI 0
## IsManualReport 0
## LogId 0
After checking all the files, only weightLog is missing values.
Checked the structure and columns of all csv files. I verified if the column names were consistent and reviewed the type for each variable.
str(dailyActivity)## 'data.frame': 940 obs. of 13 variables:
## $ Id : num 1.5e+09 1.5e+09 1.5e+09 1.5e+09 1.5e+09 ...
## $ ActivityDate : chr "4/12/2016" "4/13/2016" "4/14/2016" "4/15/2016" ...
## $ TotalSteps : int 13162 10735 10460 9762 12669 9705 13019 15506 10544 9819 ...
## $ TotalDistance : num 8.5 6.97 6.74 6.28 8.16 ...
## $ TrackerDistance : num 8.5 6.97 6.74 6.28 8.16 ...
## $ VeryActiveDistance : num 1.88 1.57 2.44 2.14 2.71 ...
## $ ModeratelyActiveDistance: num 0.55 0.69 0.4 1.26 0.41 ...
## $ LightActiveDistance : num 6.06 4.71 3.91 2.83 5.04 ...
## $ VeryActiveMinutes : int 25 21 30 29 36 38 42 50 28 19 ...
## $ FairlyActiveMinutes : int 13 19 11 34 10 20 16 31 12 8 ...
## $ LightlyActiveMinutes : int 328 217 181 209 221 164 233 264 205 211 ...
## $ SedentaryMinutes : int 728 776 1218 726 773 539 1149 775 818 838 ...
## $ Calories : int 1985 1797 1776 1745 1863 1728 1921 2035 1786 1775 ...
head(dailyActivity)## Id ActivityDate TotalSteps TotalDistance TrackerDistance VeryActiveDistance
## 1 1503960366 4/12/2016 13162 8.50 8.50 1.88
## 2 1503960366 4/13/2016 10735 6.97 6.97 1.57
## 3 1503960366 4/14/2016 10460 6.74 6.74 2.44
## 4 1503960366 4/15/2016 9762 6.28 6.28 2.14
## 5 1503960366 4/16/2016 12669 8.16 8.16 2.71
## 6 1503960366 4/17/2016 9705 6.48 6.48 3.19
## ModeratelyActiveDistance LightActiveDistance VeryActiveMinutes FairlyActiveMinutes LightlyActiveMinutes
## 1 0.55 6.06 25 13 328
## 2 0.69 4.71 21 19 217
## 3 0.40 3.91 30 11 181
## 4 1.26 2.83 29 34 209
## 5 0.41 5.04 36 10 221
## 6 0.78 2.51 38 20 164
## SedentaryMinutes Calories
## 1 728 1985
## 2 776 1797
## 3 1218 1776
## 4 726 1745
## 5 773 1863
## 6 539 1728
colnames(dailyActivity)## [1] "Id" "ActivityDate" "TotalSteps"
## [4] "TotalDistance" "TrackerDistance" "VeryActiveDistance"
## [7] "ModeratelyActiveDistance" "LightActiveDistance" "VeryActiveMinutes"
## [10] "FairlyActiveMinutes" "LightlyActiveMinutes" "SedentaryMinutes"
## [13] "Calories"
Notes:
- We notice all 8 csv files contain ID, so it is possible merge or join them together if necessary. dailyActivity, dailyCalories, and dailyIntensity all contain 940 observation.
- Observed dailyCalories and dailyIntensity are contained within the dailyActivity. So, we can remove dailyCalories and dailyIntensity from the analysis.
- For the project, I am only looking at dailyActivity, minuteMET, dailySleep, dailySteps, hearrateSec, and weightLog.
Now I will complete some numerical analysis on the data. First, we need to determine if we have a minimum 30 users in each csv file. We were told there were 30 users but we need to verify. Visually, I noticed dailySleep and weightLog may be a problem.
n_distinct(dailyActivity$Id)## [1] 33
n_distinct(dailySleep$Id)## [1] 24
n_distinct(weightLog$Id)## [1] 8
n_distinct(hearrateSec$Id)## [1] 14
n_distinct(minuteMET$Id)## [1] 33
n_distinct(dailySteps$Id)## [1] 33
dailyActivity, minuteMET, and dailySteps all have 33 users. As suspected, weight only has 8 users and dailySleep csv only has 24. The data from either of these data frames will not be meaningful and we can not make any conclusions.
Next, let’s look at summary statistics using dailyActivity, minuteMET, and dailySteps files.
dailyActivity %>% select(TotalSteps, TotalDistance, SedentaryMinutes, Calories) %>% summary()## TotalSteps TotalDistance SedentaryMinutes Calories
## Min. : 0 Min. : 0.000 Min. : 0.0 Min. : 0
## 1st Qu.: 3790 1st Qu.: 2.620 1st Qu.: 729.8 1st Qu.:1828
## Median : 7406 Median : 5.245 Median :1057.5 Median :2134
## Mean : 7638 Mean : 5.490 Mean : 991.2 Mean :2304
## 3rd Qu.:10727 3rd Qu.: 7.713 3rd Qu.:1229.5 3rd Qu.:2793
## Max. :36019 Max. :28.030 Max. :1440.0 Max. :4900
The average number of steps is 7,638. This is slightly above the current guideline according to the NIH. “Researchers found that older women who took 4,400 steps a day had a lower risk of dying than those taking 2,700 steps a day. Death rates declined with more steps taken each day until about 7,500 steps a day, when the benefit leveled off. The findings suggest that some people may benefit from starting with goals of fewer than 10,000 steps a day, which is a common standard.”
Although the average number of steps is within the goal, bellabeat can focus on users below the recommended goal of 7,500. bellabeat should not discourage users above 7,500 - just focus on the other users. Links to Steps to better Health and Step Intensity
The summary also shows users are burning 2,304 calories per day. Since I am unable to verify the definition of calories, I’ve made an assumption that it’s calories burned and not consumed. This number is good, but USDA recommends that you need to burn 3,500 calories to lose one pound of weight. This gives us an opportunity to improve the lives of our users with a reminder.
Also note, users are averaging 991.2 minutes or 16.52 hours of sedimentary time per day. This is too low and an opportunity for encouragement.
Bellabeat devices can be used to assist users with staying on track with their fitness health. A reminder so users can meet the minimum goal of 7,500 steps and reducing sedimentary time. By burning more calories, the users will lose weight, if that is their goal.
dailyActivity %>% select(VeryActiveMinutes, FairlyActiveMinutes, LightlyActiveMinutes) %>% summary()## VeryActiveMinutes FairlyActiveMinutes LightlyActiveMinutes
## Min. : 0.00 Min. : 0.00 Min. : 0.0
## 1st Qu.: 0.00 1st Qu.: 0.00 1st Qu.:127.0
## Median : 4.00 Median : 6.00 Median :199.0
## Mean : 21.16 Mean : 13.56 Mean :192.8
## 3rd Qu.: 32.00 3rd Qu.: 19.00 3rd Qu.:264.0
## Max. :210.00 Max. :143.00 Max. :518.0
Most the minutes categorized are in lightly active minutes which is only 192.8 minutes or 3.2 hours.
minuteMET %>% select(METs) %>% summary() ## METs
## Min. : 0.00
## 1st Qu.: 10.00
## Median : 10.00
## Mean : 14.69
## 3rd Qu.: 11.00
## Max. :157.00
The MET (metabolic equivalent of task) is the ratio of the metabolic rate during exercise to the metabolic rate at rest. One MET can be expressed as oxygen uptake 3.5 kcal/kg/min. The average MET for this groups is 14.69, which seems extremely high. We will not be using this variable for analysis.
weightLog %>% select(WeightKg, BMI)%>% summary()## WeightKg BMI
## Min. : 52.60 Min. :21.45
## 1st Qu.: 61.40 1st Qu.:23.96
## Median : 62.50 Median :24.39
## Mean : 72.04 Mean :25.19
## 3rd Qu.: 85.05 3rd Qu.:25.56
## Max. :133.50 Max. :47.54
We can not use BMI because we only have 8 observations. It is worth noting the average BMI for the group is 25.19, which according to CDC it falls into the overweight category. The max is 47.54 which falls into “severe” obesity.
If your BMI is 18.5 to <25, it falls within the healthy weight range. If your BMI is 25.0 to <30, it falls within the overweight range. If your BMI is 30.0 or higher, it falls within the obesity range.
dailySleep %>% select(-TotalSleepRecords, -Id, -SleepDay, TotalMinutesAsleep, TotalTimeInBed) %>% summary()## TotalMinutesAsleep TotalTimeInBed
## Min. : 58.0 Min. : 61.0
## 1st Qu.:361.0 1st Qu.:403.0
## Median :433.0 Median :463.0
## Mean :419.5 Mean :458.6
## 3rd Qu.:490.0 3rd Qu.:526.0
## Max. :796.0 Max. :961.0
Our users averaged 6.99 hours of sleep and 7.64 hours in bed. This shows while in the bed, users are sleeping most of the time.
According to the CDC, adults need 7 hours or more per night of sleep. The sample gets adequate levels of sleep.
I used the dailyActivity csv to create visualizations.
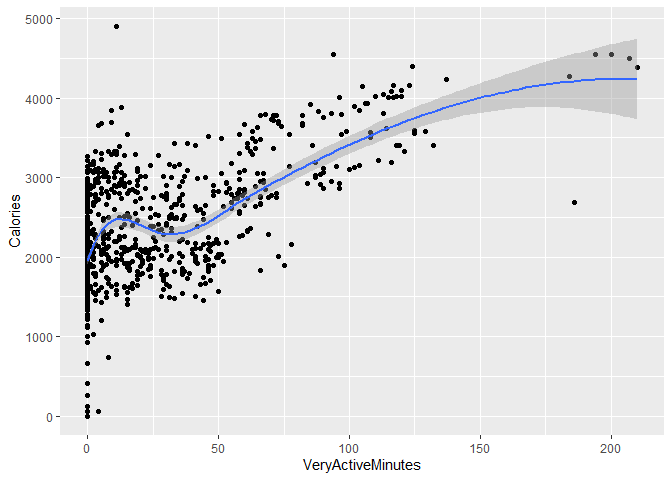
ggplot(dailyActivity,aes(x=VeryActiveMinutes, y=Calories)) + geom_point() +
geom_smooth(method = loess, formula = y~x)cor(dailyActivity$VeryActiveMinutes, dailyActivity$Calories)## [1] 0.6158383
This plot shows the relationship between veryActiveMinutes and Calories. It indicates a positive relationship. The more active a person is, the more calories a person burns. This is also supported in the correlation rate of .62.
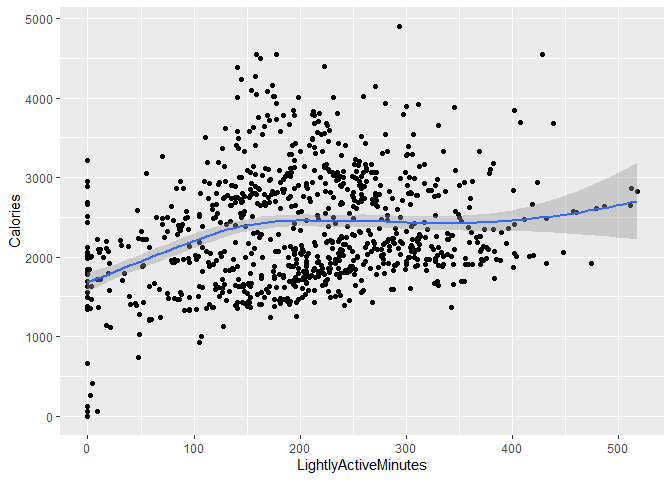
ggplot(dailyActivity,aes(x=LightlyActiveMinutes, y=Calories)) + geom_point()+
  geom_smooth(method = loess, formula = y~x)
This plot shows the relationship between LighltyActiveMinutes and Calories. We can still see a positive increase in calories burned until the user reaches 150 steps, then it levels off. If you compare it to the VeryActiveMinutes above, the user has to complete more steps at lightly active level. Actually, the user never reaches the 3,500 calorie burn to lose the one pound. We can use this information to educate our users and encourage them to increase their intensity.
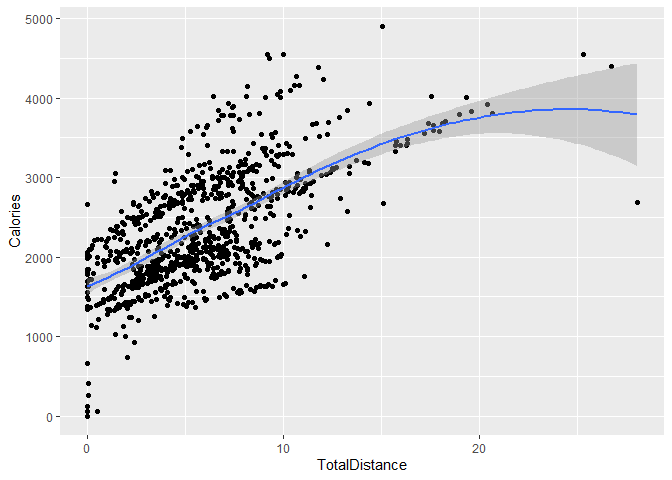
ggplot(dailyActivity,aes(x=TotalDistance, y=Calories)) + geom_point() +
geom_smooth(method = loess, formula = y~x)cor(dailyActivity$TotalDistance, dailyActivity$Calories)## [1] 0.6449619
This plot shows the relationship between veryActiveMinutes and Calories. As you would guess, It indicates a positive relationship and the correlation rate of .65. We see some users (outliers) who are walking (running) more than 20 miles and burning more than 3,500 calories. As note, the vast majority of user are burning far less than 3,500 calories.
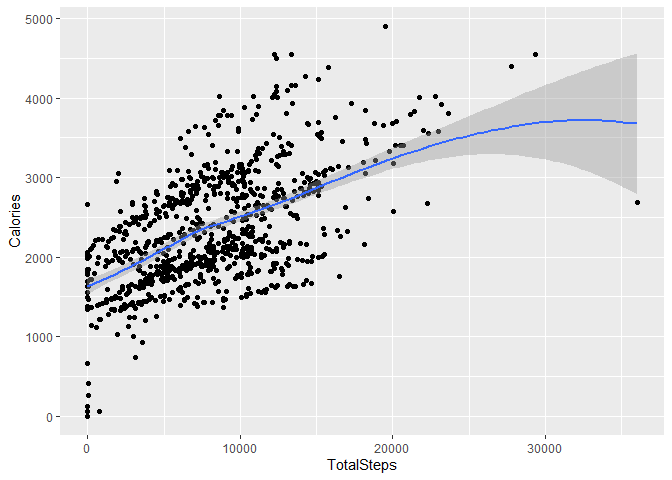
ggplot(dailyActivity,aes(x=TotalSteps, y=Calories)) + geom_point() +
geom_smooth(method = loess, formula = y~x)cor(dailyActivity$TotalSteps, dailyActivity$Calories)## [1] 0.5915681
Again we are seeing a relationship between fitness (total steps) and Calories. The correlation rate of .59.
Since users are willing to provide their health information on the app, we need to look for way to encourage ouusers to be healthier. I recommend the following:
- Encourage users to reach a minimum goal of 7,500 steps. Monitor total step per day. Offer notification to encourage users to meet that goal.
- Encourage users to reach a minimum goal of 7 hour of sleep. Offer notification to encourage users to meet that goal.
- Encourage users to add height and weight to track BMI.
- Monitor Sedentary Minutes per day. If user are sedimentary for less than a certain period, we can offer to send notifications.
- if users a interested in losing weight, we can support these users with notifications to keep them on track
- Create weekly fitness and wellness challenges.


