pgsentinel – sampling active session history

Introduction
PostgreSQL provides session activity. However, in order to gather activity
behavior user have to sample the pg_stat_activity view multiple times.
pgsentinel is an extension to record active session history and also link
the activity with query statistics (pg_stat_statements).
The module must be loaded by adding pgsentinel to
shared_preload_libraries in postgresql.conf, means that a server restart
is needed to add or remove the module.
When pgsentinel is enabled, it collects the history of session activity:
- It's implemented as in-memory ring buffer where samples are written with given (configurable) period. Therefore, user can see some number of recent samples depending on history size (configurable).
In combination with pg_stat_statements this extension can also link the session activity with
query statistics.
To get more granular queries statistic pgsentinel extension samples the pg_stat_statements view:
- at the same time it is sampling the active sessions
- only for the queryid that were associated to an active session (if any) during the sampling
pgsentinel launches special background worker for gathering the
sessions activity.
Availability
pgsentinel is implemented as an extension and not available in default
PostgreSQL installation. It is available from
github
under the same license as
PostgreSQL License
and supports PostgreSQL 9.6+.
Installation
pgsentinel is a PostgreSQL extension which requires PostgreSQL 9.6 or
higher. Before build and install you should ensure the following:
- PostgreSQL version is 9.6 or higher.
- You have development package of PostgreSQL installed or you built PostgreSQL from source.
- Your PATH variable is configured so that
pg_configcommand available, or set PG_CONFIG variable.
Typical installation procedure may look like this:
As pgsentinel uses the pg_stat_statements extension (officially bundled with PostgreSQL) for tracking which queries get executed in your database, add the following entries to your postgres.conf:
$ shared_preload_libraries = 'pg_stat_statements,pgsentinel'
$ # Icncrease the max size of the query strings Postgres records
$ track_activity_query_size = 2048
$ # Track statements generated by stored procedures as well
$ pg_stat_statements.track = all
restart the postgresql daemon and create the extension:
$ git clone https://github.com/pgsentinel/pgsentinel.git
$ cd pgsentinel/src
$ make
$ sudo make install
$ psql DB -c "CREATE EXTENSION pgsentinel;"
Usage
pgsentinel reports the active session history activity through the pg_active_session_history view:
| Column | Type | Collation | Nullable | Default |
|---|---|---|---|---|
| ash_time | timestamp with time zone | |||
| datid | oid | |||
| datname | text | |||
| pid | integer | |||
| leader_pid | integer | |||
| usesysid | oid | |||
| usename | text | |||
| application_name | text | |||
| client_addr | text | |||
| client_hostname | text | |||
| client_port | integer | |||
| backend_start | timestamp with time zone | |||
| xact_start | timestamp with time zone | |||
| query_start | timestamp with time zone | |||
| state_change | timestamp with time zone | |||
| wait_event_type | text | |||
| wait_event | text | |||
| state | text | |||
| backend_xid | xid | |||
| backend_xmin | xid | |||
| top_level_query | text | |||
| query | text | |||
| cmdtype | text | |||
| queryid | bigint | |||
| backend_type | text | |||
| blockers | integer | |||
| blockerpid | integer | |||
| blocker_state | text |
You could see it as samplings of pg_stat_activity providing more information:
ash_time: the sampling timetop_level_query: the top level statement (in case PL/pgSQL is used)query: the statement being executed (not normalised, as it is inpg_stat_statements, means you see the values)cmdtype: the statement type (SELECT,UPDATE,INSERT,DELETE,UTILITY,UNKNOWN,NOTHING)queryid: the queryid of the statement which links to pg_stat_statementsblockers: the number of blockersblockerpid: the pid of the blocker (if blockers = 1), the pid of one blocker (if blockers > 1)blocker_state: state of the blocker (state of the blockerpid)
pgsentinel also reports the queries statistics history through the pg_stat_statements_history view:
| Column | Type | Collation | Nullable | Default |
|---|---|---|---|---|
| ash_time | timestamp with time zone | |||
| userid | oid | |||
| dbid | oid | |||
| queryid | bigint | |||
| calls | bigint | |||
| total_exec_time | double precision | |||
| rows | bigint | |||
| shared_blks_hit | bigint | |||
| shared_blks_read | bigint | |||
| shared_blks_dirtied | bigint | |||
| shared_blks_written | bigint | |||
| local_blks_hit | bigint | |||
| local_blks_read | bigint | |||
| local_blks_dirtied | bigint | |||
| local_blks_written | bigint | |||
| temp_blks_read | bigint | |||
| temp_blks_written | bigint | |||
| blk_read_time | double precision | |||
| blk_write_time | double precision | |||
| plans | bigint | |||
| total_plan_time | double precision | |||
| wal_records | bigint | |||
| wal_fpi | bigint | |||
| wal_bytes | numeric |
The fields description are the same as for pg_stat_statements (except for the ash_time one, which is the time of the active session history sampling).
The worker is controlled by the following GUCs:
| Parameter name | Data type | Description | Default value | Min value |
|---|---|---|---|---|
| pgsentinel_ash.sampling_period | int4 | Period for history sampling in seconds | 1 | 1 |
| pgsentinel_ash.max_entries | int4 | Size of pg_active_session_history in-memory ring buffer | 1000 | 1000 |
| pgsentinel.db_name | char | database the worker should connect to | postgres | |
| pgsentinel_ash.track_idle_trans | boolean | track session in idle in transaction state | false | |
| pgsentinel_pgssh.max_entries | int4 | Size of pg_stat_statements_history in-memory ring buffer | 1000 | 1000 |
| pgsentinel_pgssh.enable | boolean | enable pg_stat_statements_history | false |
Remark
- Some fields may be NULL depending on the version (for example, leader_pid is NULL for version <= 13.0...)
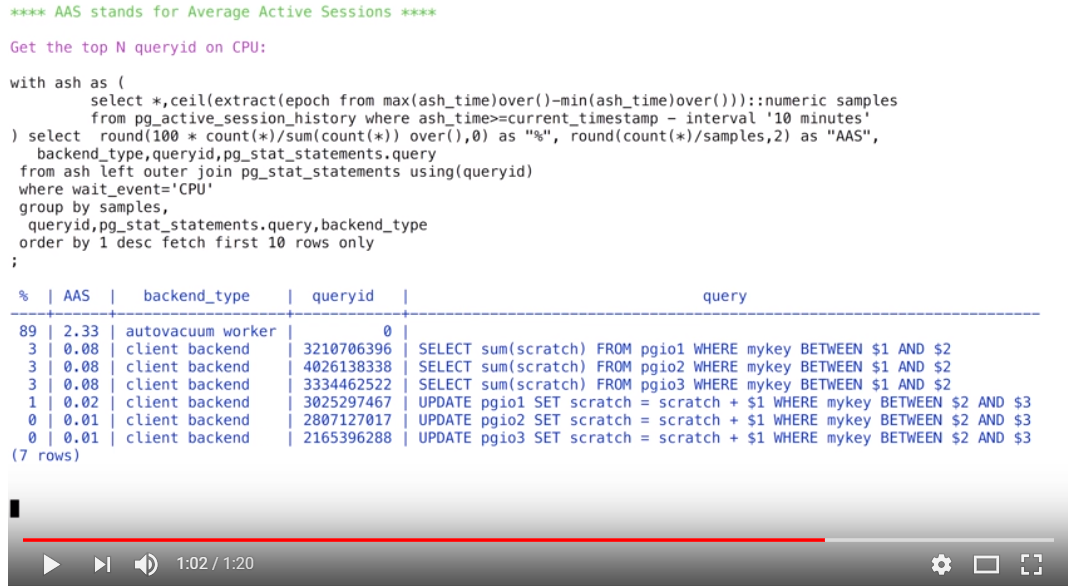
See how to query the view in this short video
The videos are available on youtube
Contribution
If you're lacking of some functionality in pgsentinel
then you're welcome to make pull requests.
Author
- Bertrand Drouvot bdrouvot@gmail.com, France, Twitter