Cisco MDS 9000 monitoring using Grafana and InfluxDB
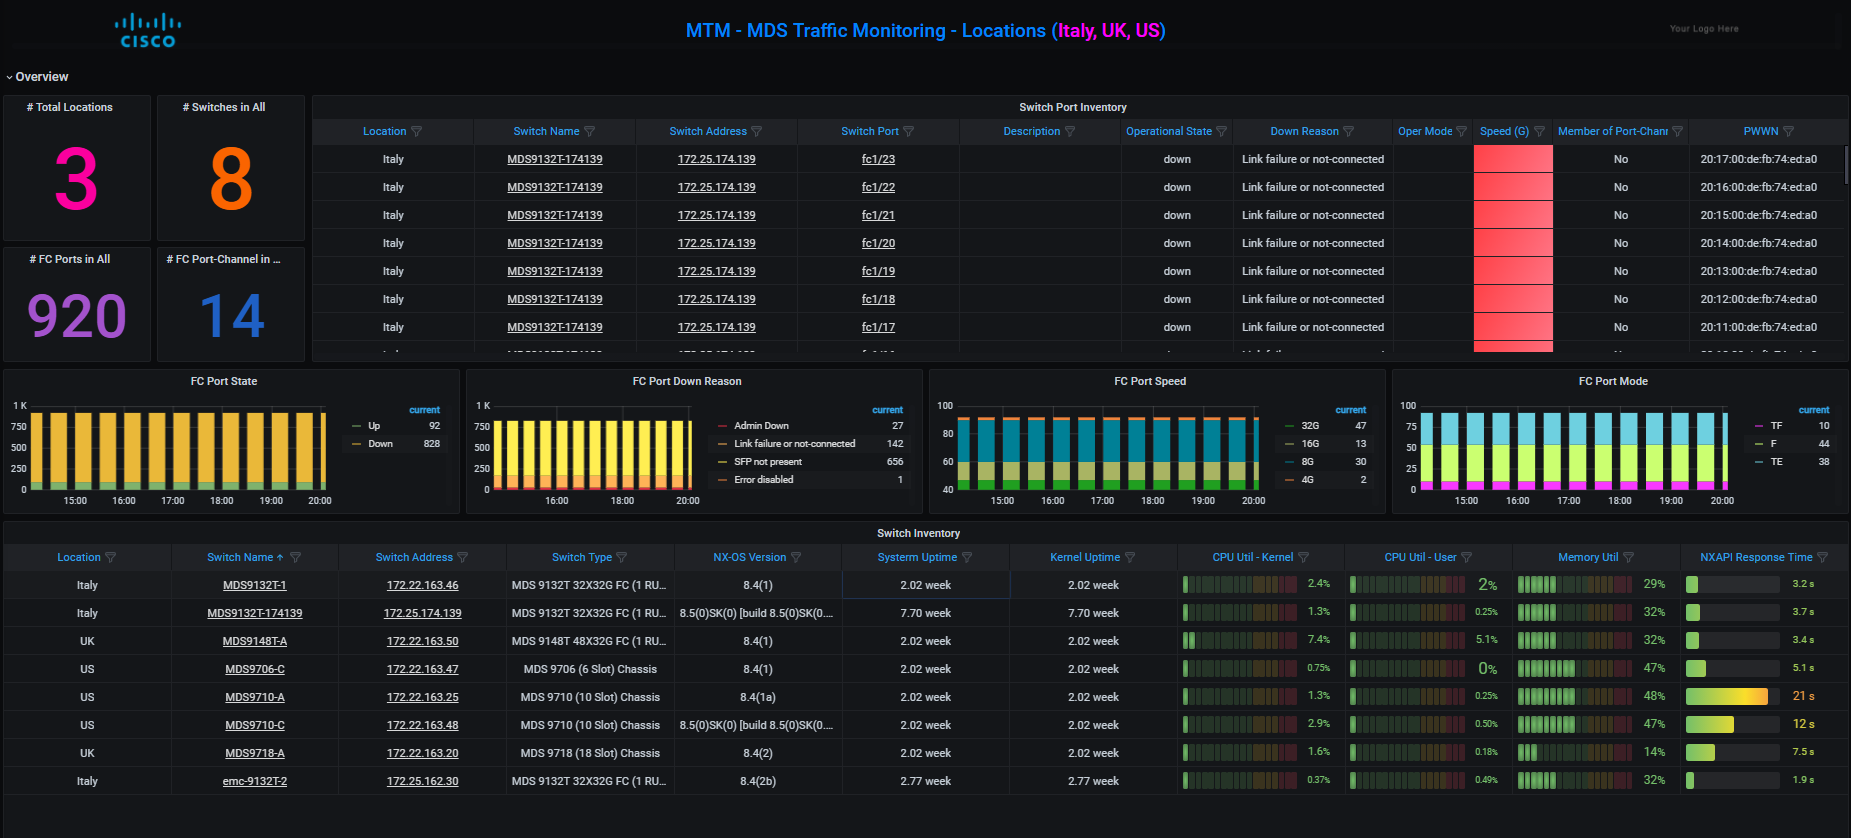
Global Inventory
Digital Optical Monitoring of SFP (Hottest, Coldest, Lowest RX and TX Power)

Digital Optical Monitoring of SFP

Top-10 ports (Traffic, Congestion, Errors, etc.)

Switchport monitoring

Port-Channel traffic distribution

and much more...
The MTM collector (mds_traffic_monitor_*.py) pulls stats from Cisco MDS switches using NX-API. The stats are normalized and corrected before writing to InfluxDB. Finally, Grafana provides the visualization and use-cases.
- Data source: Cisco MDS Switches via NXAPI), read-only account is enough
- Data storage: InfluxDB, a time-series database
- Visualization: Grafana
- Tested OS: CentOS 7.x. Should work on other OS also.
- Python version: Version 3 only. Should be able to work on Python 2 also with minor modification.
- Install Telegraf
- Install InfluxDB
- Install Grafana
- Download this repo in zip format or via git clone.
Enable NX-API on MDS swithces via feature nxapi command.
Enter the access details of the MDS switch in mds_group*.txt file. Refer to the file for more details on input format.
Try
$ python3 /usr/local/telegraf/mds_traffic_monitor*.py -hAdd to your telegraf.conf file as below
[[inputs.exec]]
   interval = "30s"
   commands = [
       "python3 /usr/local/telegraf/mds_traffic_monitor_high_frequency.py /usr/local/telegraf/mds_group_1.txt influxdb-lp -vv",
   ]
   timeout = "28s"
   data_format = "influx"
Create a different mds_group_.txt file for every MDS switch. Repeat the above seven lines in telegraf.conf as many times as the number of monitored MDS switches. The name of the mds_group.txt file can be changes to help you remember the switch.
Also update the global values like
  logfile = "/var/log/telegraf/telegraf.log"
  logfile_rotation_max_size = "10MB"
  logfile_rotation_max_archives = 5
Import the Grafana dashboard json files. That is all. Enjoy!
I haven't written detailed installation instructions yet. Nor do I have an OVA. If you are new to Grafana, InfluxDB and Telegraf, follow the steps from the UTM installation - Cisco UCS monitoring using Grafana, InfluxDB, Telegraf – UTM Installation. The MTM project follows the same design as the UTM project. Most of the steps are the same. Make sure to replace ucs_traffic_monitor.py by mds_traffic_monitor_*.py and ucs_domains_group_1.txt by mds_group_1.txt.