In the previous lesson we saw how we can use a discrete random variable used for modeling fair die having a uniform probabilities for all possible values. In this lab, we shall try to calculate a cdf for this variable and visualize it for inspection.
You will be able to:
- Calculate the cdf for a given discrete random variable
- Visualize the cdf using matplotlib
Recall the formula for calculate the cumulative probability from previous lesson:
So given a list of all possible values of x, We can easily calculate the cdf for a given possible value (X) by performing following steps:
- Build a function
calculate_cdf(lst,X), wherelstis a list of all possible values in a discrete variable x (6 values for a die roll), and X is the value for which we want to calculate the cumulative distribution function. - Initialize a count variable
- for all values in
lst, if a value is less than X, add one to count - do nothing otherwise. (this will tell us total number of values less than X) - Calculate the cumulative probability of X dividing the count with total possible values
- Round off by 3 decimals and return the cumulative probability of X.
def calculate_cdf(lst, X):

    pass

# test data
test_lst = [1,2,3]
test_X = 2

calculate_cdf(test_lst, test_X)

# 0.667
Let's now use above function to calculate a cdf for each value in a die roll with an intention of plotting it.
Perform following steps in the cell below:
- Create a list
die_lstwith all possible values of a fair die - Initialize an empty list
die_cumfor storing cumulative probabilities for these values. - For each value in the
die_lstcalculate its cumulative probability using the function above and store indie_cumlist.
die_lst = None
die_cum = None

die_cum

# [0.167, 0.333, 0.5, 0.667, 0.833, 1.0]
cdfs are implemented with two sorted lists: xs, which contains the values, and ps, which contains the cumulative probabilities for xs.
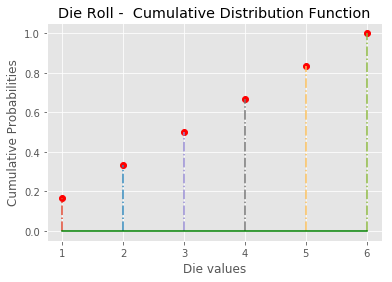
Following this, we now have a list of possible values, and a second list containing cumulative probabilities for each value. Let's go ahead and plot these values in matplotlib using the stem plot.
- Use
die_lstfor x-axis anddie_cumfor y-axis
Text(0,0.5,'Cumulative Probabilities')
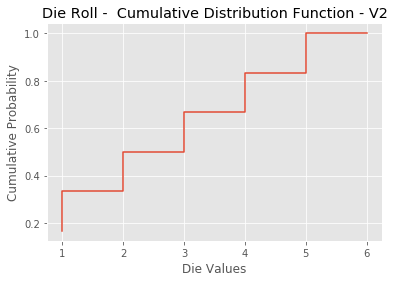
cdfs (and pmfs) can be calculated using built in numpy and matplotlib methods. So we don't have create custom functions to calculate these. We can draw a histogram styled cdf as shown below using following methods.
You would need to perform these steps
-
Use
np.histogram()to automatically calculate the histogram with probabilities. Here is numpy histogram documentation to help you dig deeper. -
Use
plt.step()method withnp.cumsum()to calculate and plot cumulative probabilities (just like we did above).
In this lesson we looked at developing a cdf a percentile function of a discrete random variable. We looked at how to calculate and visualize a cdf. This technique can also be applied to continuous random variables which we shall see later in this section.


