- Ensure
jbangis available on system command-line - Open a Camel route which can be started with JBang
- Call command Palette (
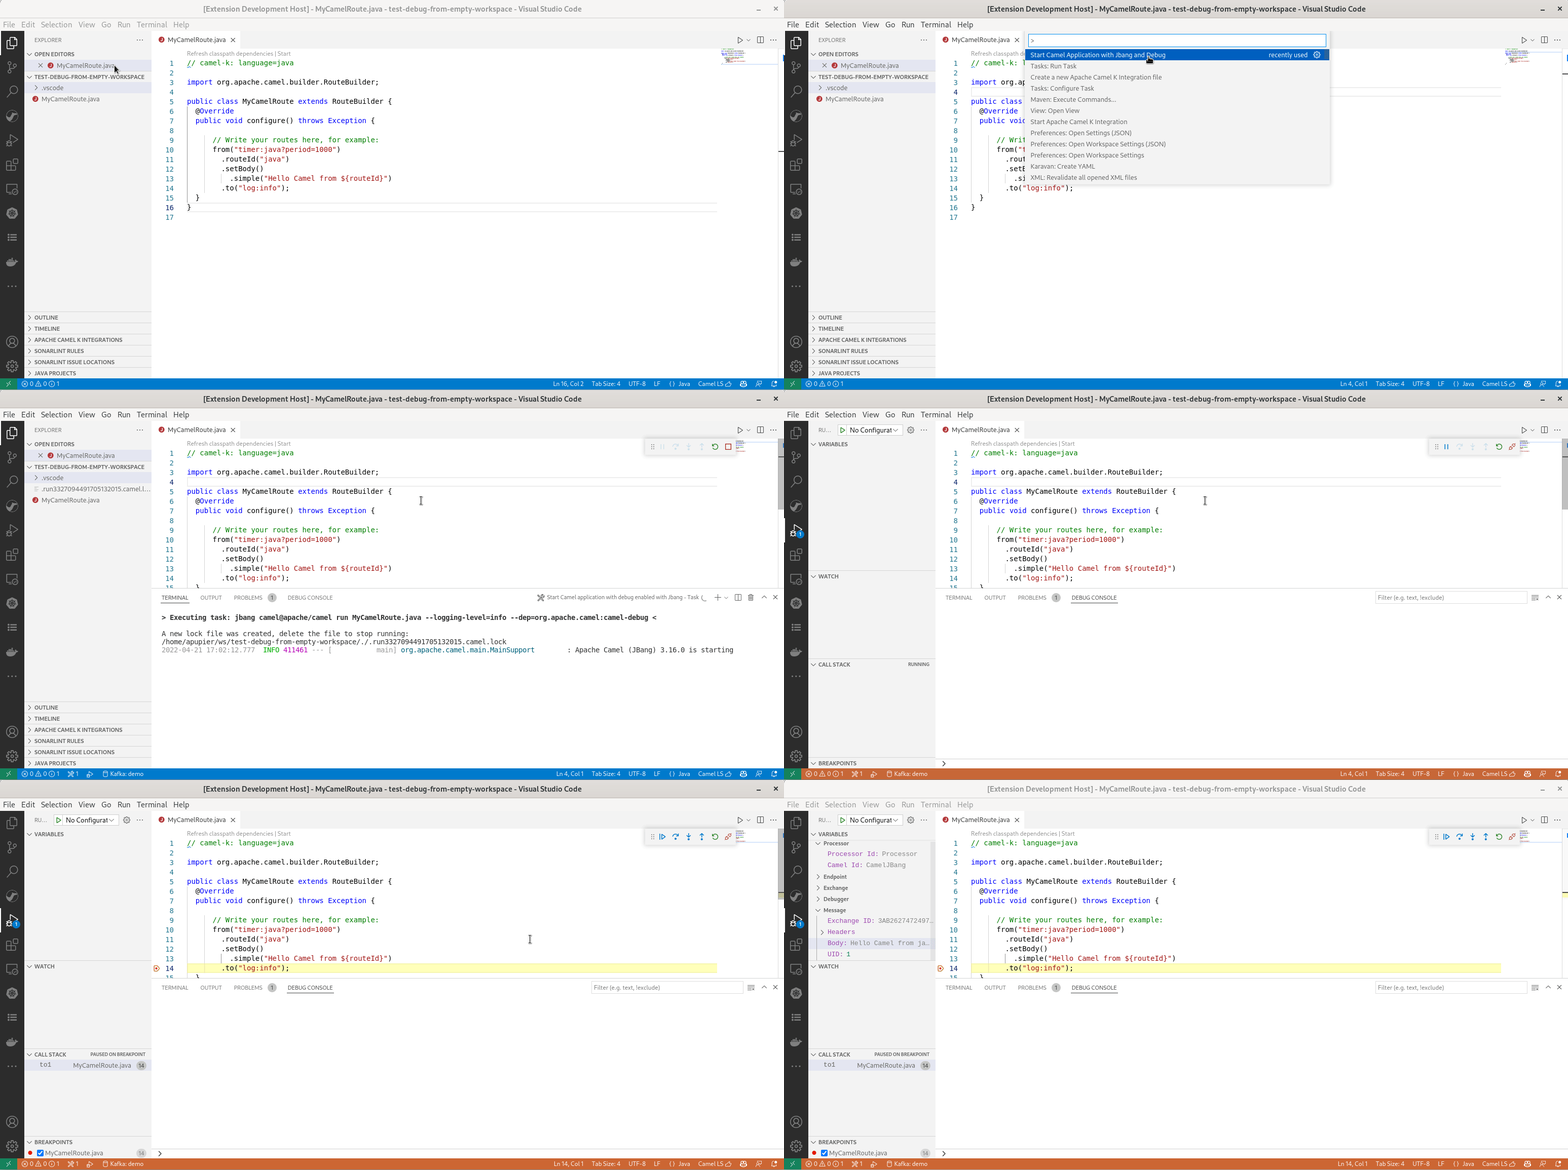
Ctrl+Alt+P), and pick commandStart Camel Application with JBang and debugor click on codelensDebug with JBangwhich appears on top of the file. - Wait that the route is started and debugger is connected
- Put a breakpoint on the Camel route
- Enjoy!
- Start a Camel 3.16+ application with
camel-debugon the classpath - In
.vscode/launch.json, provide this kind of content for a local default JMX connection (which isservice:jmx:rmi:///jndi/rmi://localhost:1099/jmxrmi/camel):
  {
	"version": "0.2.0",
	"configurations": [
		{
			"type": "apache.camel",
			"request": "attach",
			"name": "Attach Camel Debugger"
		}
	]
}- In
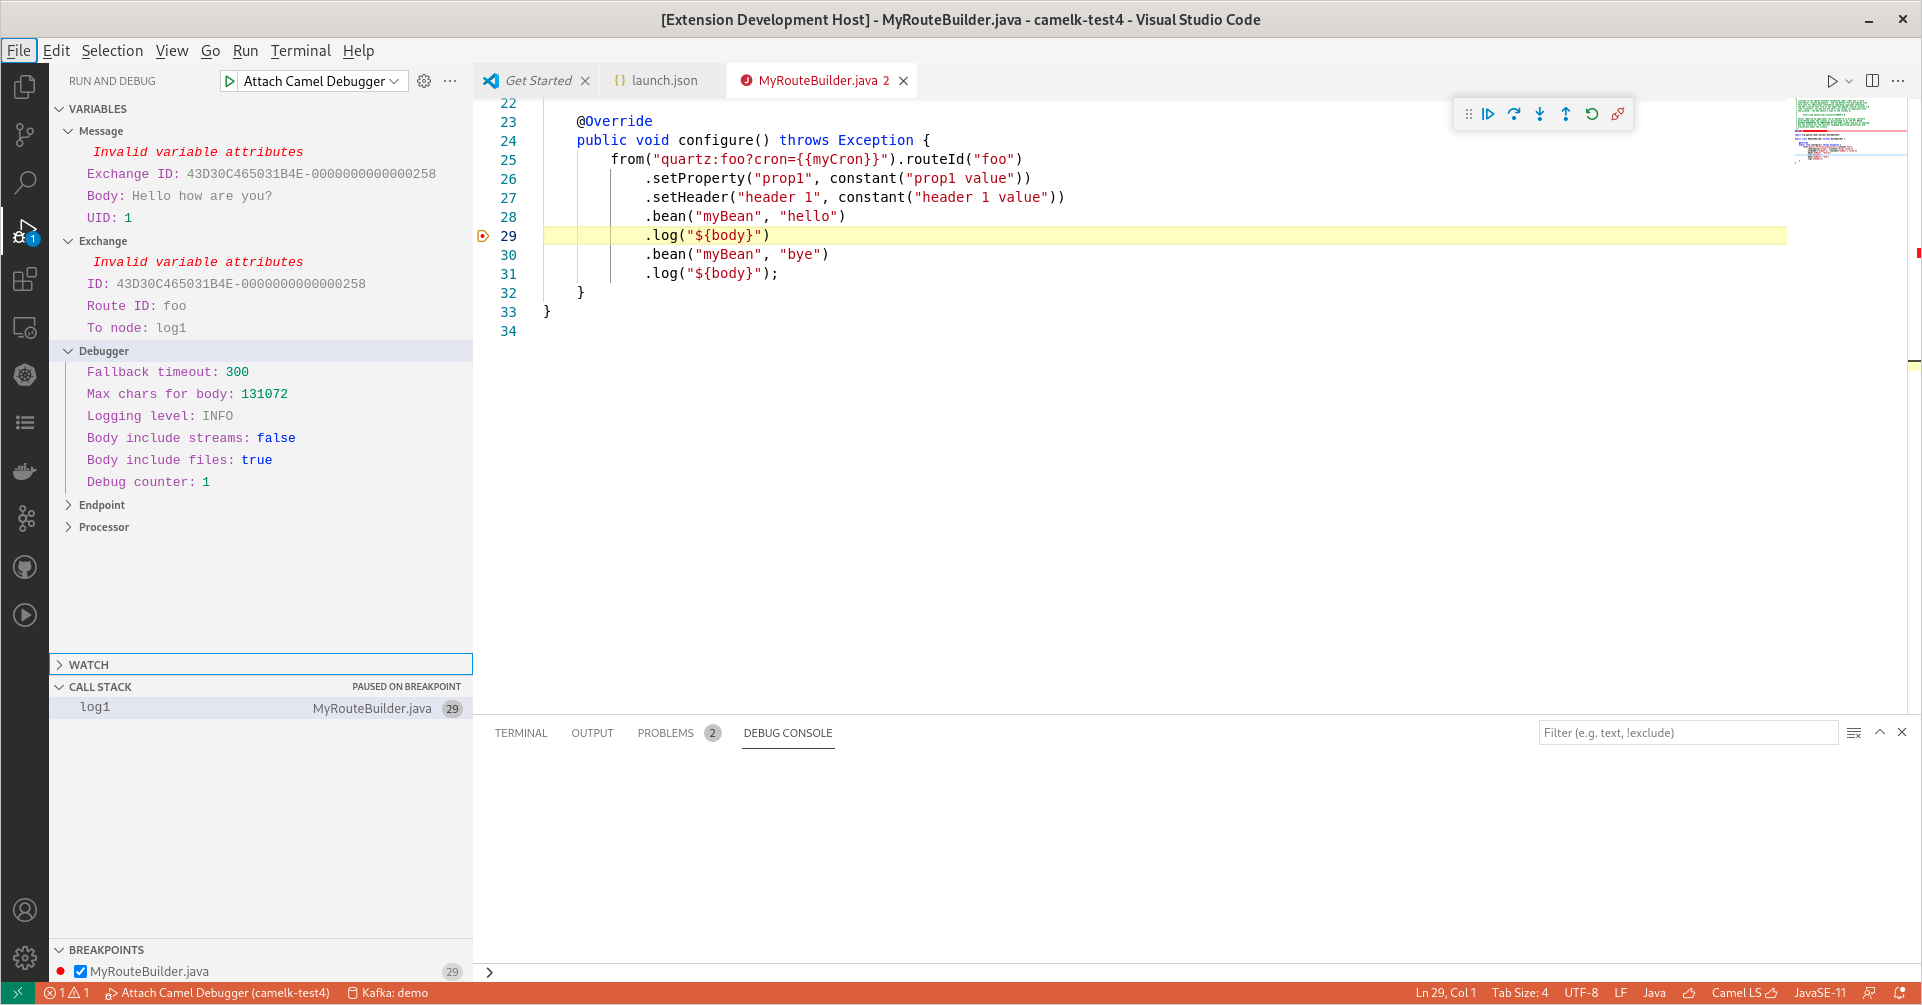
Run and Debugpanel, launch theAttach Camel Debugger - Put a breakpoint on the Camel route
- Enjoy!
In .vscode/launch.json, provide this kind of content for a local default JMX connection (which is service:jmx:rmi:///jndi/rmi://localhost:1099/jmxrmi/camel):
  {
	"version": "0.2.0",
	"configurations": [
		{
			"type": "apache.camel",
			"request": "attach",
			"name": "Attach Camel Debugger"
		}
	]
  }
or for a specific JMX Url:
{
  "version": "0.2.0",
  "configurations": [
  	{
  		"type": "apache.camel",
  		"request": "attach",
  		"name": "Attach Camel Debugger",
  		"attach_jmx_url": "service:jmx:rmi:///jndi/rmi://localhost:1099/jmxrmi/camel"
  	}
  ]
}
or for a local connection using PID of the Camel application process:
{
  "version": "0.2.0",
  "configurations": [
  	{
  		"type": "apache.camel",
  		"request": "attach",
  		"name": "Attach Camel Debugger",
  		"attach_pid": "857136"
  	}
  ]
}- Support use of Camel debugger by attaching to a running Camel route written in Java, Yaml or XML (only
Camel Mainmode for XML) using the JMX Url - Support local use of Camel debugger by attaching to a running Camel route written in Java, Yaml or XML (only
Camel Mainmode for XML) using the PID - Support a single Camel context
- Add/Remove breakpoint
- Support conditional breakpoint with
simplelanguage. See here for details on how to write condition with simple language. - Inspect variable values on suspended breakpoints
- Resume a single route instance and resume all route instances
- Stepping when the route definition is in the same file
- Allow to update values of variables:
- in scope
Debugger - the message body
- a message header when it is of type String
- an exchange property when it is of type String
- in scope
- Command
Start Camel Application with JBang and debug. It allows a one-click start and Camel debug in simple cases. This command is available through:- Command Palette. It requires having a valid Camel file opened in editor.
- Contextual menu in File explorer. It is visible to all
*.xml,*.java,*.yamland*.yml. It is up to the user to ensure it is a Camel route file. The command is also opening the files in editor to be ready to place breakpoints. - Codelens at the top of a Camel file (the heuristic for the codelens is checking that there is a
fromand atoor alogonjava,xmlandyamlfiles).
- Configuration snippets for Camel debugger launch configuration
- Configuration snippets to launch Camel application ready to accept a Camel debugger connection using JBang or Maven with Camel maven plugin or Quarkus Devs
Java Runtime Environment 11+ with com.sun.tools.attach.VirtualMachine (available in most JVMs such as Hotspot and OpenJDK) must be available on system path.
For some features, JBang must be available on command-line.
The Camel instance to debug must follow these requirements:
- Camel 3.16+
- Have
camel-debugon the classpath - Have JMX enabled
The Debug Adapter for Apache Camel by Red Hat extension collects anonymous usage data and sends it to Red Hat servers to help improve our products and services. Read our privacy statement to learn more. This extension respects the redhat.telemetry.enabled setting which you can learn more about at https://github.com/redhat-developer/vscode-redhat-telemetry#how-to-disable-telemetry-reporting

