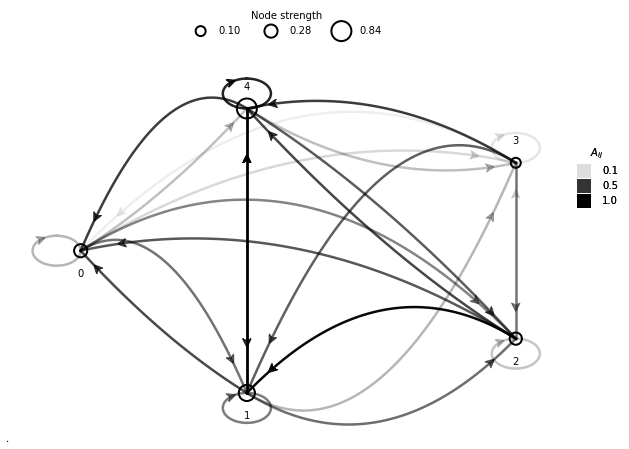
Visualizing graphs with edges plotted as parabolic lines.
Author: Muralikrishnan Gopalakrishnan Meena (Oak Ridge National Laboratory), https://sites.google.com/view/muraligm/
- For Python version (best version as is now): Run plotgraph_parabola.ipynb Or
- For Matlab version: Run test_matlab.m
Figure 1: An expected output from the Python version plotgraph_parabola.ipynb.
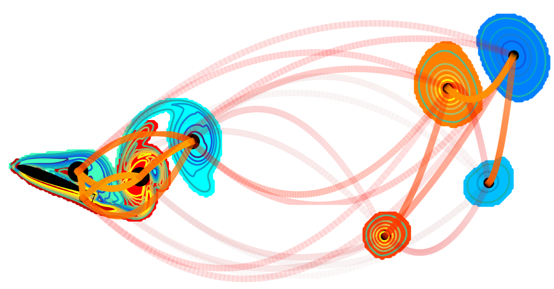
Figure 2: An image generated using the codes showing the interactions amongst vortical structures in the wake of an airfoil. Reference: https://doi.org/10.1103/PhysRevE.97.063103
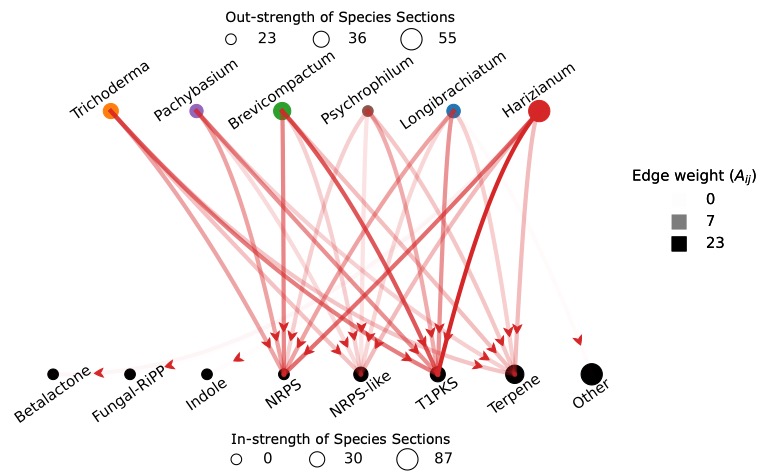
Figure 3: A bipartite network showing the influence of various species of Trichoderma fungus with enzymes. Reference: https://doi.org/10.3389/ffunb.2021.716511
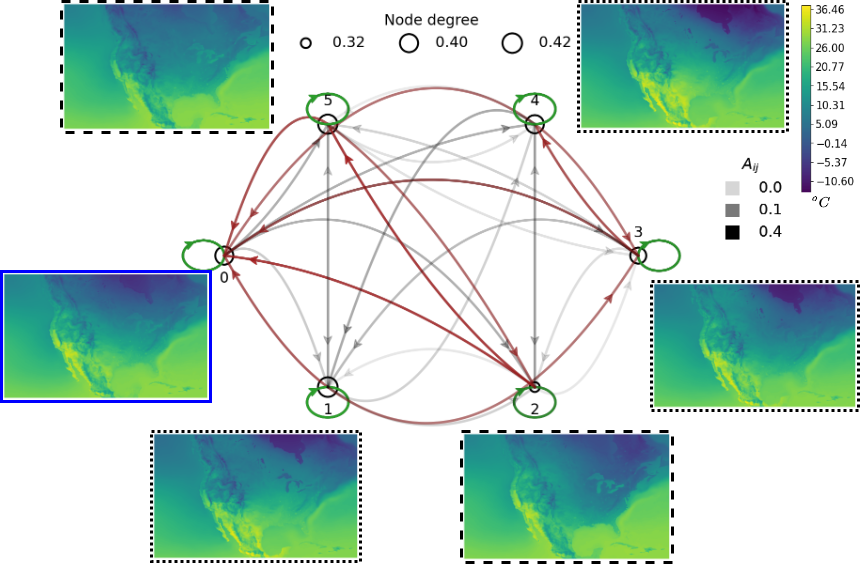
Figure 4: A network showing the interactions amongst surface temperature climate modes.


